


America's construction map is being redrawn. The metros that defined the last decade's boom are pulling back: Austin's issued residential permits are down more than a quarter since 2023, Dallas-Fort Worth's biggest builders have cut their permit volume by nearly 40%, and Raleigh is off almost 30%. But the permits didn't disappear. They moved. A new wave of homebuilding is spreading across smaller, less expensive metros.
For retail chains, commercial developers, and owner-operators, that shift raises a familiar question. Austin's moment is fading. Its building surge crested, real rent is falling, and builders are looking for fresher ground. So, where is the next Austin?
The permit record offers an early look. Building permits are issued before foundations are poured, families move in, or traffic counts begin to rise, and long before a growing market appears in retail sales data. We analyzed 4.5 million residential new-construction permits across 465 metro areas, then compared the results with the expansion patterns of the top 25 national homebuilders.
The pattern is clear. Nearly every market in the country peaked in 2021 and bottomed in 2023. The rising boomtowns of the next cycle are the metros climbing out of that trough fastest. A few have already moved well beyond their 2021 highs.
Key takeaways
- Austin's issued residential permits fell 27% from 2023 to 2025 in our stable-coverage panel, and the top 25 national builders cut their Austin permit volume by a third. Dallas-Fort Worth and Raleigh show the same pullback.
- The boom is moving to the middle of the country. Kansas City, St. Louis, and Omaha posted 22 to 57% growth in issued permits since 2023, backed by megaprojects from Panasonic, Google, and the NGA, with almost no national-builder competition yet.
- Dover, DE is the quiet outlier: permitting at nearly triple its 2021 pace, with NVR running at seven times its 2023 volume there.
- The builders are the tell. In Sebastian-Vero Beach, FL, the count of top-25 builders active went from 4 to 7 in two years. And in San Antonio, which didn't crack our growth ranking, a dozen national builders are now concentrated. That bet gets its own section.
- Commercial permits lag residential by design, and that lag is the site-selection window. In Memphis, San Antonio, and the New Orleans Northshore, commercial construction hasn't caught up to the housing recovery.
First, the uncomfortable news about Austin
Austin isn't collapsing. It's normalizing after a historic run. According to Shovels data, residential new-construction permits issued in the Austin metro fell from 4,850 in 2023 to 3,524 in 2025, and early 2026 filings are still running below last year's pace. Local reporting tells the same story: construction starts hit a ten-year low and citywide permits fell 18% in 2025.
The sharper signal is what the professionals are doing. Top homebuilders, the companies whose land acquisition teams spend all day answering the "where next" question, pulled their Austin permit volume down by a third between 2023 and 2025. Dallas-Fort Worth and Raleigh show the same pattern. The last cycle's boomtowns are being harvested, not planted.
So where is the planting happening?
How we found the next boomtowns
Finding the new growth markets requires a structured approach. Here’s how we did our analysis:
- Permits issued, stable coverage only. We count permits by issue date, the same basis as our national homebuilder ranking, and we only include metros that have reported permits in our database every year since 2021.
- Multi-year momentum, not one hot quarter. We ranked on the full-year change from the market's 2023 trough through 2025. Single-quarter comparisons are too easy for reporting quirks to distort.
- Builder expansion as confirmation. We tracked where top national homebuilders are adding permits and entering new metros, using the same builder set as our top 25 national homebuilder ranking.
The rankings
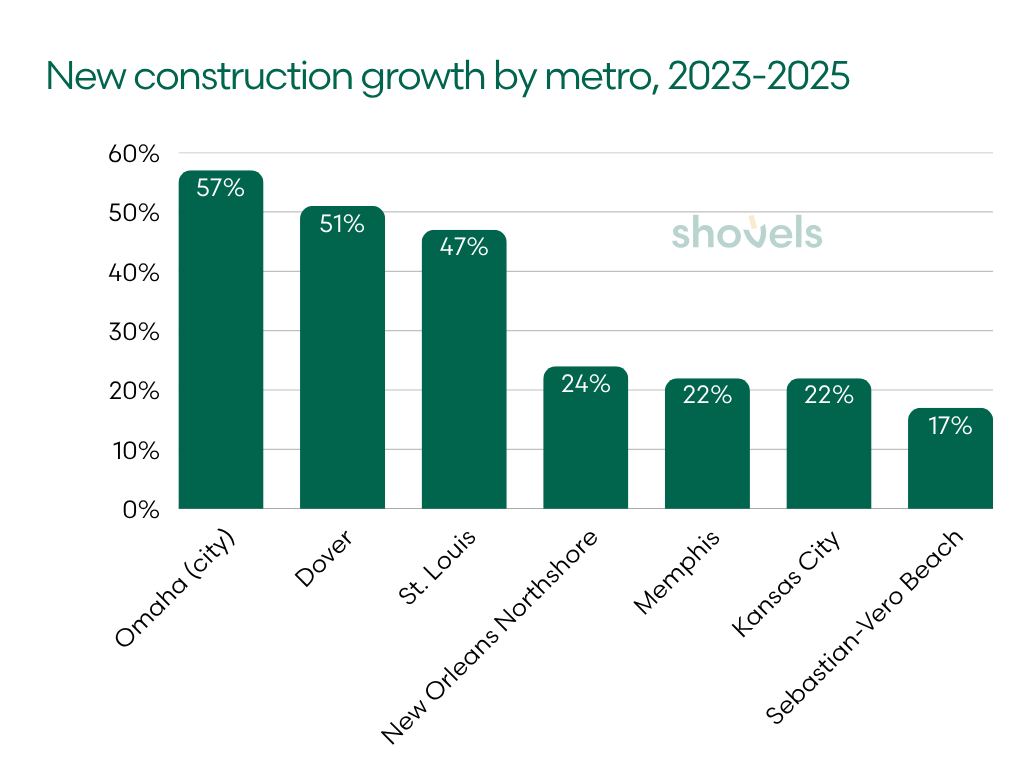
The result is a list that favors sustained, verifiable recoveries over isolated spikes. Think of it as a list of rapidly growing cities built from permit records rather than press releases. These are residential new-construction permits issued in continuously covered jurisdictions, ranked by growth from the 2023 trough.
| Rank | Metro | Growth '23-'25 | Trajectory |
|---|---|---|---|
| 1 | Omaha (city), NE | +57% | Already past its 2021 pace |
| 2 | Dover, DE | +51% | Nearly triple its 2021 pace |
| 3 | St. Louis, MO-IL | +47% | Up five straight years |
| 4 | New Orleans Northshore (St. Tammany Parish), LA | +24% | Steady climb year-over-year |
| 5 | Memphis, TN-MS-AR | +22% | Up two straight years |
| 6 | Kansas City, MO-KS | +22% | Rebounding, fueled by a nearby megaproject |
| 7 | Sebastian-Vero Beach, FL | +17% | Rising three straight years |
The builder tell: where national builders are expanding
While the permit totals show where construction is accelerating, builder behavior shows where the largest homebuilders are willing to commit capital. Land acquisition teams move years before ribbon cuttings, so a metro gaining national builders is a market that someone has already underwritten.
| Metro | Top-25 builders active, 2025 | Change since 2023 | The standout move |
|---|---|---|---|
| San Antonio, TX | 12 | 3 new arrivals | While overall permit volumes are flat, D.R. Horton, Toll Brothers, and Ashton Woods all entered in 2025 |
| Sebastian-Vero Beach, FL | 7 | Up from 4 | PulteGroup, Meritage, and LGI entered; NVR scaled nearly tenfold |
| Dover, DE | 4 | Steady roster, surging volume | NVR at 7x its 2023 volume, and Lennar more than tripled |
| Kansas City, MO-KS | 2 | D.R. Horton entered in 2025 | Regional builders still dominate |
| Omaha, NE | 1 | Steady | D.R. Horton at more than twice its 2023 pace |
| New Orleans Northshore, LA | 1 | Steady | D.R. Horton quadrupled activity in 2025 |
| Memphis, TN | 1 | Steady | D.R. Horton scaling steadily |
| St. Louis, MO-IL | 0 | None yet | The open door |
Two patterns stand out. Where growth is fastest, builders are piling in (Vero Beach, Dover). And where the megaprojects are, they've barely arrived (Kansas City, St. Louis, Omaha, Memphis), which means the land hasn't been repriced yet.
The Heartland wave: Kansas City, St. Louis, and Omaha
The widest gap between economic investment and national-builder activity is in the middle of the map. Across Kansas City, St. Louis, and Omaha, major employers are already committing billions while homebuilding is just starting to ramp up.
| Metro | 2023 | 2024 | 2025 | Growth '23-'25 |
|---|---|---|---|---|
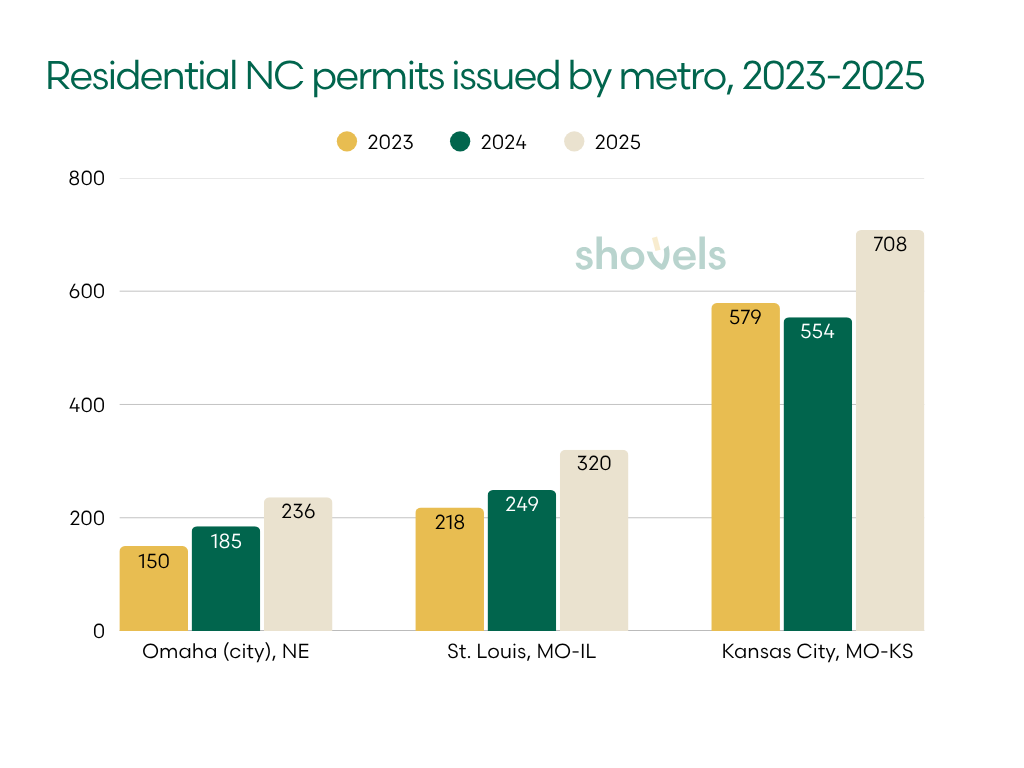
| Omaha (city), NE | 150 | 185 | 236 | +57% |
| St. Louis, MO-IL | 218 | 249 | 320 | +47% |
| Kansas City, MO-KS | 579 | 554 | 708 | +22% |
Kansas City, MO-KS
Kansas City has assembled a megaproject lineup few metros can match. Panasonic's 4.7 million-square-foot EV battery plant in De Soto has already produced its millionth battery, a $3 billion data center campus next door has doubled in size since it was announced, and Google just confirmed a $10 billion, 500-acre data center in the Northland.
The permits are following the employment opportunities. Residential permits issued in our covered jurisdictions are up 22% since 2023, led by Olathe. The national builders are also just starting to arrive. D.R. Horton entered the market in 2025, but like St. Louis, this is still regional-builder country. Commercial permits are edging up (+4% since 2023), an early signal that the broader development cycle has begun.
St. Louis, MO-IL
St. Louis is the steadiest riser on the list. Issued permits in our covered jurisdictions have increased every year since 2021, from 98 to 320, including a 47% gain since 2023.
Commercial projects are following, from a new Costco fuel facility to a $232 million mixed-use development rising in Downtown West. Behind that growth is a generational investment. The National Geospatial-Intelligence Agency opened its $1.7 billion Next NGA West campus in north St. Louis in late 2025, the largest single federal investment in the city's history.
But no top-25 national builder has established a meaningful position here. For land teams, that could be an open door.
Omaha, NE
Omaha shows a similar pattern at a smaller scale. The city issued 57% more residential new-construction permits in 2025 than in 2023 and is now permitting above its 2021 pace.
The growth engine is Sarpy County, Nebraska's fastest-growing county, where Google and Meta have poured billions into data center campuses and suburban Papillion's single-family permits nearly doubled year-over-year in early 2025. Google's Lincoln data center is now online as part of a $15 billion Nebraska buildout. D.R. Horton, the metro's only national builder, is also running at more than twice its 2023 pace in the area.
The Takeaway: Kansas City, St. Louis, and Omaha are compounding on megaproject employment with almost no national-builder competition. That combination doesn't usually last long.
The megaproject magnet: Memphis, TN
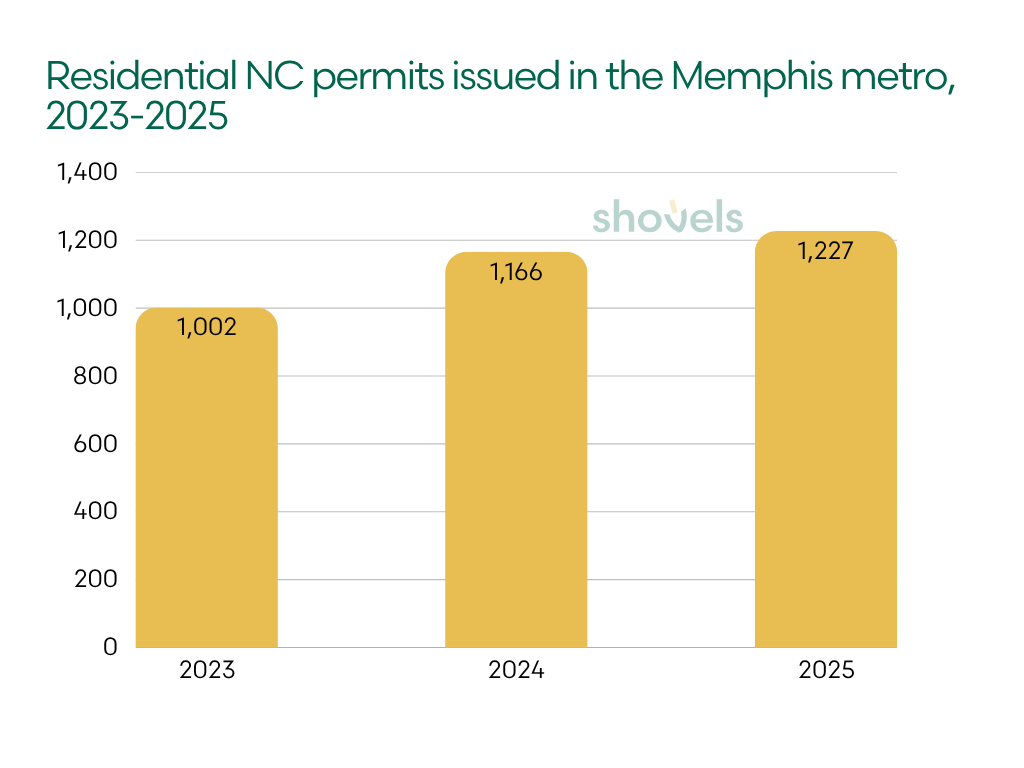
The same megaproject dynamic is visible farther south in Memphis, where our data shows a steady climb year-over-year.
| Metro | 2023 | 2024 | 2025 | Growth '23-'25 |
|---|---|---|---|---|
| Memphis, TN-MS-AR | 1,002 | 1,166 | 1,227 | +22% |
Issued permits have climbed for two straight years since the trough, from 1,002 to 1,166 to 1,227, and filings through spring 2026 are running ahead of last year's pace.
Here, two large investments are helping pull the market forward. Ford's $5.6 billion BlueOval City EV campus coming online east of the metro, and xAI's supercomputer buildout in southwest Memphis, where the company bought a million-square-foot site in 2025.
Other commercial permits, meanwhile, are still 38% below their 2023 level, the same rooftops-ahead-of-retail gap we see in San Antonio.
The Takeaway: Memphis housing is compounding while its commercial pipeline shrinks. For site selectors, that mismatch is the whole opportunity.
The coastal risers: Vero Beach and Dover
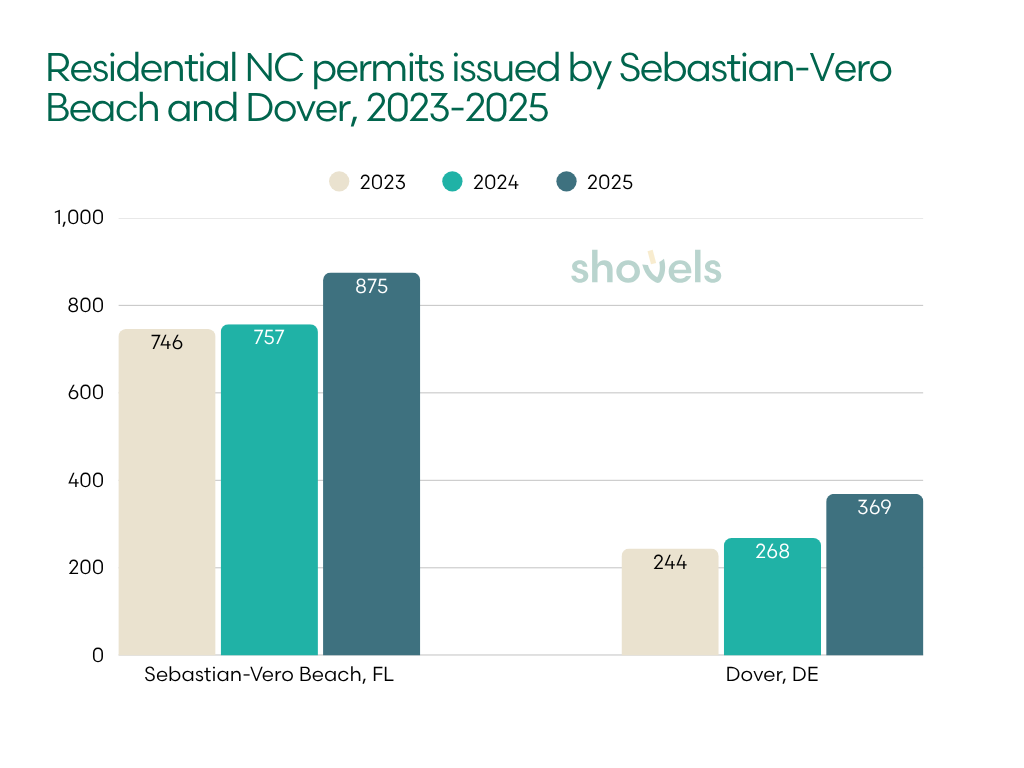
Two smaller coastal markets are drawing national builders faster than almost anywhere else. Growth in these two markets is driven less by megaproject employment than by migration and affordability.
| Metro | 2023 | 2024 | 2025 | Growth '23-'25 |
|---|---|---|---|---|
| Sebastian-Vero Beach, FL | 746 | 757 | 875 | +17% |
| Dover, DE | 244 | 268 | 369 | +51% |
Sebastian-Vero Beach, FL
Most lists of the fastest-growing cities in Florida stop at Tampa and Orlando, and Florida's big-name markets are cooling. But the Treasure Coast is bucking the trend. Issued permits fell from 1,097 in 2021 to a trough of 658 in 2022, then climbed three straight years to 875 by 2025.
National builders have moved just as quickly. The number of top-25 national builders active in the market rose from four to seven as PulteGroup, Meritage, and LGI entered, NVR scaled nearly tenfold, and D.R. Horton filed 103 permits in the first quarter of 2026 alone.
The infrastructure is now chasing growth, led by a $95 million I-95 interchange at Oslo Road built to open up the county's fast-growing western corridor.
The commercial market is only beginning to respond. Commercial permits reached 51 in 2025, up 9% from 2023. Indian River County's government pipeline points in the same direction, boasting 73 economic development incentives.
Dover, DE
Dover is the quieter of the two coastal stories, which is precisely what makes it interesting. Kent County is permitting at nearly triple its 2021 pace, rising from 139 issued permits then to 369 in 2025. The builder signal is even stronger: NVR is running at seven times its 2023 volume, Lennar has more than tripled its activity, and K. Hovnanian continues to expand.
The demand here is structural: Kent County has become the destination of choice for in-state movers priced out of Wilmington's suburbs and the beach towns, with 6,300 new homes in the county's planning pipeline. Delaware also has some of the lowest property tax rates in the nation, far below its neighbors, which keeps pulling retirees into the market for new single-family homes. Dover Air Force Base and the state government also provide a stable employment base.
The Takeaway: Vero Beach is the migration play and Dover is the affordability play, and in both, national builders moved first. Plenty of retail square footage is available in both markets.
The Gulf South sleeper: the New Orleans Northshore
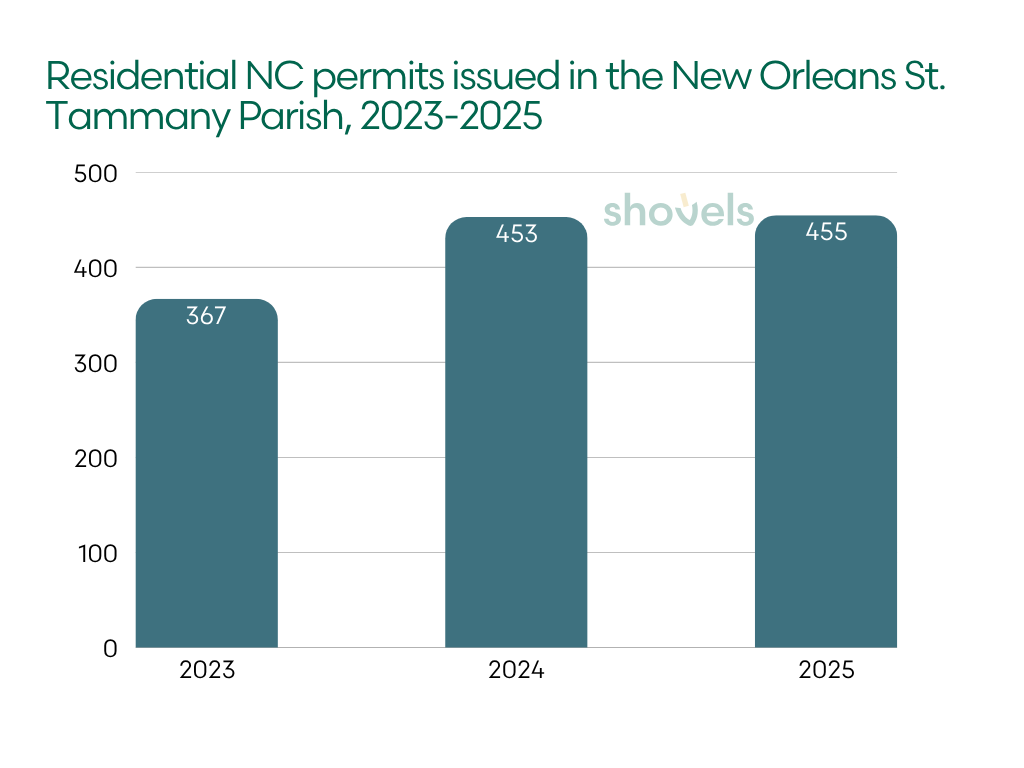
The New Orleans Northshore combines elements of both stories: sustained population pressure and a national builder beginning to scale. St. Tammany Parish, across Lake Pontchartrain from New Orleans, climbed from 367 issued permits in 2023 to 455, while D.R. Horton quadrupled its activity there in 2025.
| Area | 2023 | 2024 | 2025 | Growth '23-'25 |
|---|---|---|---|---|
| St. Tammany Parish, LA | 367 | 453 | 455 | +24% |
That growth is rooted in a long-running supply gap. St. Tammany's population has grown every single year since 2000 and has roughly quadrupled since 1970, and a recent housing study found the parish needs as many as 17,000 new homes by 2030 after two decades of underbuilding relative to demand. The contrast with the rest of the metro is stark: while the Northshore climbs, permits in Orleans and Jefferson Parishes have fallen 17% and 47% since 2023.
Commercial permits, meanwhile, have fallen 11% since 2023. In a parish with a documented housing deficit and America's largest builder scaling up, that divergence creates an opening.
The Takeaway: The Northshore has a documented housing deficit, decades of uninterrupted population growth, and national builders finally scaling in. If your site-selection map stops at Texas, start looking more east.
The relative winner: San Antonio-New Braunfels, TX
The ranking identifies the markets recovering fastest. San Antonio stands out for a different reason: builder conviction. It did not make the growth list (issued permit volume is flat to down) but it has remained comparatively stable within big-market Texas.
| Metro | 2023 | 2024 | 2025 | Growth '23-'25 |
|---|---|---|---|---|
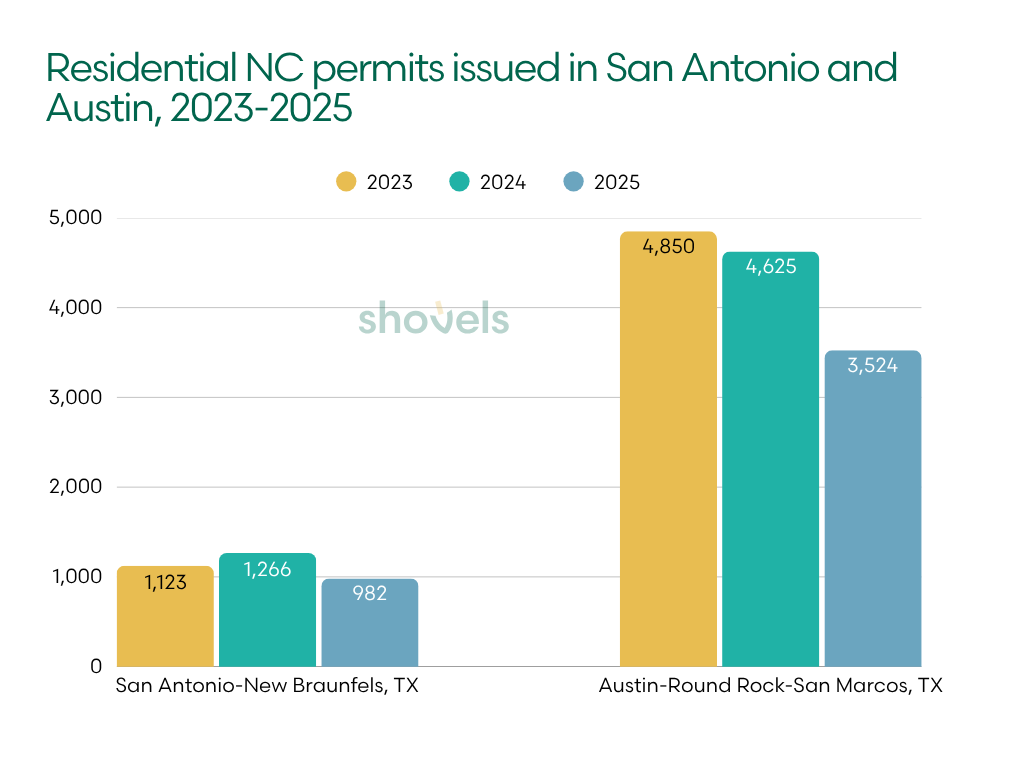
| San Antonio-New Braunfels, TX | 1,123 | 1,266 | 982 | -13% |
| Austin-Round Rock-San Marcos, TX | 4,850 | 4,625 | 3,524 | -27% |
While Austin's permits fell by more than a quarter and Dallas-Fort Worth's builders retreated, San Antonio largely held its ground. It is also the only major Texas metro where job growth is still trending upward. The metro added roughly 205,000 residents between 2020 and 2024, most from out of state, and suburban New Braunfels, perennially one of the fastest-growing cities in Texas, was just named America's No. 2 newest boomtown after growing its housing stock 34% in five years.
Importantly, the big builders have noticed the demand for new-construction homes in San Antonio. A dozen top-25 national builders are now active in the metro, with D.R. Horton, Toll Brothers, and Ashton Woods all entering in 2025. This is the most new-arrival activity we’ve seen in any of the markets we track.
Commercial development, however, has not kept pace. In San Antonio proper, issued commercial permits are down nearly 40% from their 2023 level, leaving the same rooftops-ahead-of-retail gap visible in Memphis and the Northshore. When the country's largest builders concentrate in a market where commercial construction has yet to follow, they are making a bet on where the next several years of demand will emerge.
The Takeaway: San Antonio isn't a growth story yet, but it is a conviction story. It’s the most builder-crowded stable market in America, at a fraction of Austin's land cost, with the retail gap still open.
Retail follows rooftops
Taken together, these markets point to the pattern that matters most for site selection. Single-family permits tend to rise first, multifamily follows, and commercial construction arrives 12 to 24 months later. Our Q1 2026 commercial real estate analysis found national commercial permits down 16% year over year, but that headline obscures the local divergence.
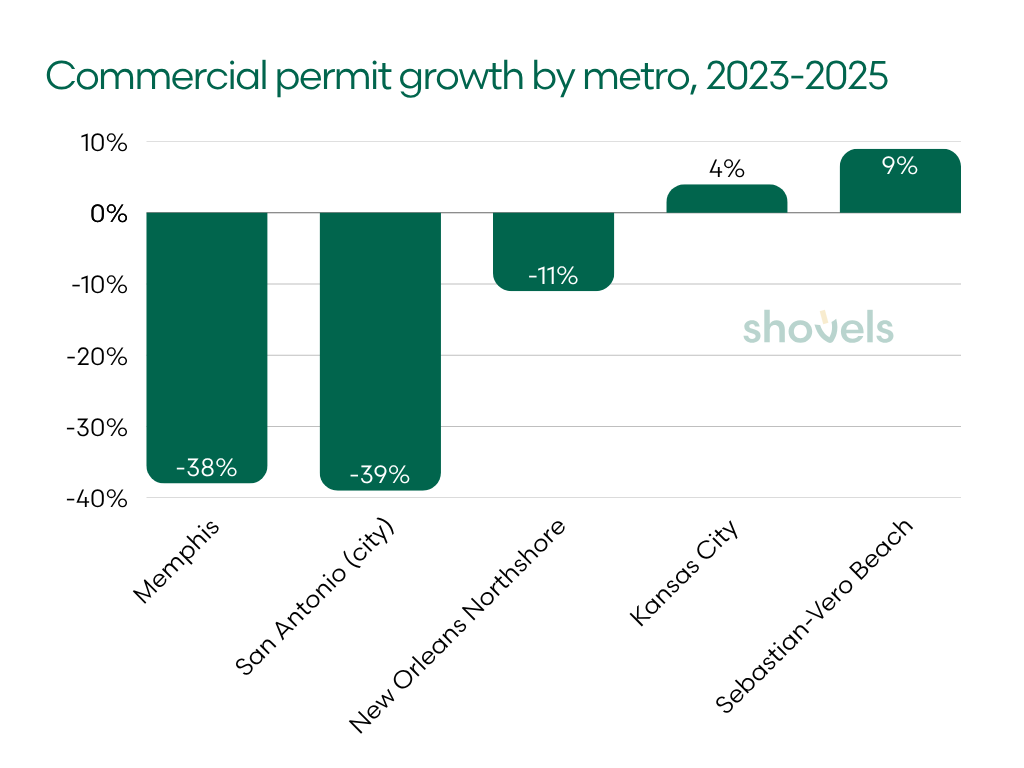
Commercial permits are edging up in Kansas City (+4%) and Vero Beach (+9%). In Memphis, San Antonio, and the Northshore, they are still lagging behind the housing recovery.
| Market | 2023 | 2024 | 2025 | Change '23-'25 |
|---|---|---|---|---|
| Kansas City, MO-KS | 216 | 177 | 224 | +4% |
| Sebastian-Vero Beach, FL | 47 | 45 | 51 | +9% |
| Memphis, TN-MS-AR | 388 | 248 | 239 | -38% |
| San Antonio (city), TX | 114 | 95 | 69 | -39% |
| New Orleans Northshore (St. Tammany Parish), LA | 102 | 121 | 91 | -11% |
That lag creates the site-selection window. When housing permits are rising while commercial permits are falling, much of the future retail demand has yet to be claimed. By the time commercial permit counts catch up, the best corner parcels may already be gone.
The next boom is already taking shape
The permit record points to a broader shift toward markets where housing remains attainable, major employers are investing, and new supply can still get built. Vero Beach and Dover are already drawing national builders at scale. Kansas City, St. Louis, Omaha, and Memphis are earlier in the cycle, with employment and infrastructure investment moving faster than homebuilding. San Antonio offers a third variation: not rapid growth, but sustained builder confidence as its larger Texas peers retreat.
For site selectors, the sequence matters more than the label. By the time population estimates, traffic counts, and retail sales confirm a boom, builders have already acquired the land and families have begun moving in. Permits reveal the shift sooner. When the rooftops are still plans on paper, commercial development is still catching up, and the best sites may still be available.
If you're interested in exploring the building permit data behind this post, check out Shovels Online or contact us directly about site-selection use cases.
Frequently Asked Questions
- What city is the next Austin, Texas?
-
The fastest-growing permit markets are smaller metros: Omaha (+57% issued permits since 2023), Dover, DE (+51%), and St. Louis (+47%). Among big markets, San Antonio is the builders' pick: a dozen top-25 national homebuilders are now active there, three of them new arrivals in 2025, even though its own permit volumes are flat. Stability plus builder conviction is what "the next Austin" looks like before the growth shows up.
- How can building permit data help with retail site selection?
-
Residential permits lead retail demand by one to two years, because homes are permitted before families move in and long before their spending shows up in market data. Tracking where new-construction permits (and the national homebuilders behind them) are accelerating lets retail and commercial teams claim sites before the market reprices them.
- What are the fastest-growing cities in the US in 2026?
-
In issued-permit data from continuously-covered jurisdictions, the fastest-growing markets from the 2023 trough through 2025 are Omaha (+57%), Dover, DE (+51%), St. Louis (+47%), the New Orleans Northshore (+24%), Memphis (+22%), Kansas City (+22%), and Sebastian-Vero Beach, FL (+17%), with St. Louis posting gains every single year since 2021.
- What is the fastest-growing city in America?
-
It depends on the measure. By population growth, the Census Bureau puts Myrtle Beach, SC at the top, growing about 3.2% per year. By growth in new residential construction, the leaders are smaller markets like Omaha, Dover, DE, and St. Louis, where issued building permits have grown 47 to 57% since 2023.
- Is Austin still growing?
-
Austin is cooling, not collapsing. Issued residential new-construction permits fell 27% from 2023 to 2025 in continuously-covered jurisdictions, and the top 25 national builders cut their Austin permit volume by a third, while concentrating in San Antonio and expanding across the Midwest.
- What data is this analysis based on?
-
The analysis uses Shovels' database of 4.5 million residential new-construction permits across 465 US metros (2021 through early 2026), counted by issue date, plus permit-level activity of the top 25 national homebuilders and 427,000 local government development decisions. Every ranked metro was cross-checked against county-level Census Bureau permit data and local reporting.