

It's no secret that America needs more homes. Depending on the estimate, the U.S. is short somewhere between 3 and 5 million housing units. Zillow puts the deficit at 4.7 million. Realtor.com estimates 4 million. Economists agree that decades of underbuilding have left the country with a structural supply problem that will not be solved quickly.
At the same time, a growing share of new construction is concentrated in the hands of a relatively small group of builders. The top 10 now account for roughly half of all new single-family home sales in the U.S., up from about a third two decades ago. Scale is the advantage here. Larger builders can navigate permitting delays, secure land earlier, negotiate better with suppliers, and withstand rate cycles that sideline smaller competitors.
All this raises an obvious question: if supply is constrained and increasingly concentrated, who is actually building and where?
To answer that, we looked at permit data across Shovels' nationwide dataset. We ranked the 25 most active homebuilders over the past 5 years by permitted volume, the earliest signal of where and how fast homes are actually being built.
Key Takeaways
- The top 3 builders (Lennar, D.R. Horton, and PulteGroup) account for roughly half of all top-25 permit volume over five years. Concentration at the top of the market is structural, not cyclical.
- Florida, Texas, and the Carolinas are the most active new construction markets in the country, with multiple national builders competing simultaneously in the same metros. Fort Worth, Charlotte, and the Research Triangle are markets to watch.
- D.R. Horton leads in near-term momentum, pulling 3,946 permits in Q1 2026. While Lennar tops the five-year cumulative ranking, Horton entered 2026 with the stronger pipeline.
- Outside the top 10, volumes diverge sharply. Dream Finders has grown permit volume every year since 2021. Mattamy Homes had a breakout 2025 driven by geographic expansion. LGI Homes and Tri Pointe Homes have been pulling back.
- The market is separating by price point. Entry-level-focused builders are under the most pressure from sustained affordability constraints. Move-up and luxury builders, Toll Brothers in particular, are recovering faster.
How We Measure Builder Activity
For this analysis, we focused on new construction permits with a recorded builder name and an issue date between January 1, 2021 and December 31, 2025, plus Q1 2026. Rankings reflect total permitted projects, not closed sales or reported deliveries. Although we strive for comprehensive coverage, our totals may undercount and are better used as directional indicators, not definitive figures.
A few things to note about the data before we dive in:
- Permit volume is a leading indicator. A permit filed today typically reflects a home that hits the market 6–18 months later, depending on jurisdiction and project complexity. Builders with strong 2024–2025 permit numbers are likely to show up in sales data through 2026.
- Coverage varies by jurisdiction. Some municipalities have stronger digital records than others, but the builders on this list are all active in well-covered jurisdictions.
- We group builder entities at the brand level using contractor group IDs, but actual construction activity may be higher. Large national builders frequently file permits through project-specific subsidiaries and LLCs that are not always linked to the parent company in permit records.
The Big Picture: Which Builders Control the Housing Supply?
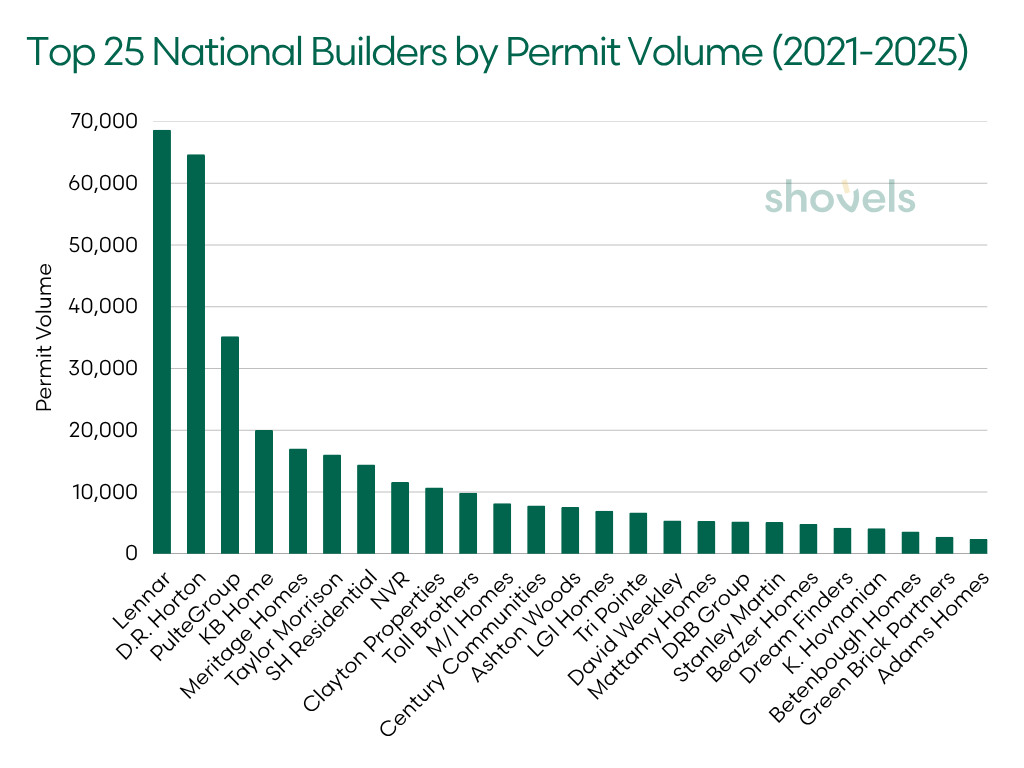
In the five years between 2021 and 2025, America's top 25 builders accounted for roughly 349,000 permitted homes across more than 28 states. But that activity is far from evenly distributed.
The top three builders, Lennar, D.R. Horton, and PulteGroup, alone account for roughly 169,000 permits, or nearly half of total top-25 volume. In several individual years, Lennar and D.R. Horton combined outpaced the remaining 22 builders.
| Rank | Builder | Total Permits (2021-2025) |
|---|---|---|
| 1 | Lennar | 68,699 |
| 2 | D.R. Horton | 64,713 |
| 3 | PulteGroup | 35,216 |
| 4 | KB Home | 20,024 |
| 5 | Meritage Homes | 17,023 |
| 6 | Taylor Morrison | 16,078 |
| 7 | SH Residential | 14,435 |
| 8 | NVR | 11,606 |
| 9 | Clayton Properties | 10,727 |
| 10 | Toll Brothers | 9,880 |
| 11 | M/I Homes | 8,170 |
| 12 | Century Communities | 7,823 |
| 13 | Ashton Woods | 7,571 |
| 14 | LGI Homes | 6,969 |
| 15 | Tri Pointe | 6,672 |
| 16 | David Weekley | 5,376 |
| 17 | Mattamy Homes | 5,292 |
| 18 | DRB Group | 5,218 |
| 19 | Stanley Martin | 5,138 |
| 20 | Beazer Homes | 4,831 |
| 21 | Dream Finders | 4,205 |
| 22 | K. Hovnanian | 4,120 |
| 23 | Betenbough Homes | 3,611 |
| 24 | Green Brick Partners | 2,739 |
| 25 | Adams Homes | 2,401 |
As a review of aggregate numbers makes clear, concentration defines the nation's housing market. A small group of builders is responsible for a disproportionate share of new supply, and they shape where that supply shows up.
The Takeaway: Three builders, Lennar, D.R. Horton, and PulteGroup, account for nearly half of all top-25 permit volume.
The Q1 2026 Map: Where America Is Being Built Right Now
To understand how builder concentration plays out on the ground, we looked at where the nation's top 25 homebuilders were pulling permits in Q1 2026, a quarter when the housing market showed steady forward momentum heading into the spring selling season.
The interactive map below is a first-quarter snapshot of the pipeline heading into the year. Each dot is a geocoded residential new construction permit, 15,182 in total, color-coded by builder.
As expected, the gap between the top few builders and the rest of the field is substantial. Building activity is dense, clustered, and dominated by a handful of names.
D.R. Horton pulled 3,935 permits in Q1 2026. Lennar followed with 2,499. PulteGroup, in third, pulled 1,546. While Lennar leads the five-year cumulative ranking, D.R. Horton outpaced them in Q1 2026, a sign that Horton entered the year with stronger near-term momentum.
Geographically, the concentration is just as striking. Florida, Texas, and the Carolinas show the heaviest clustering, with multiple builders operating simultaneously in the same metros. Fort Worth stands out in particular, with overlapping activity from several national builders. Charlotte and the Research Triangle exhibit a similar pattern.
Of the nearly 15,200 permits on the map, 11,259 are in active construction and 3,334 are still in review. A significant portion of the Q1 pipeline is still moving through permitting, which means the construction activity visible here will continue well into 2026.
The Takeaway: D.R. Horton entered 2026 with the strongest near-term momentum, outpacing Lennar in Q1 despite trailing over the full five years. Florida, Texas, and the Carolinas are where the pipeline is densest and where construction activity is already well underway.
How Builders Compete: National vs. Regional Strategies
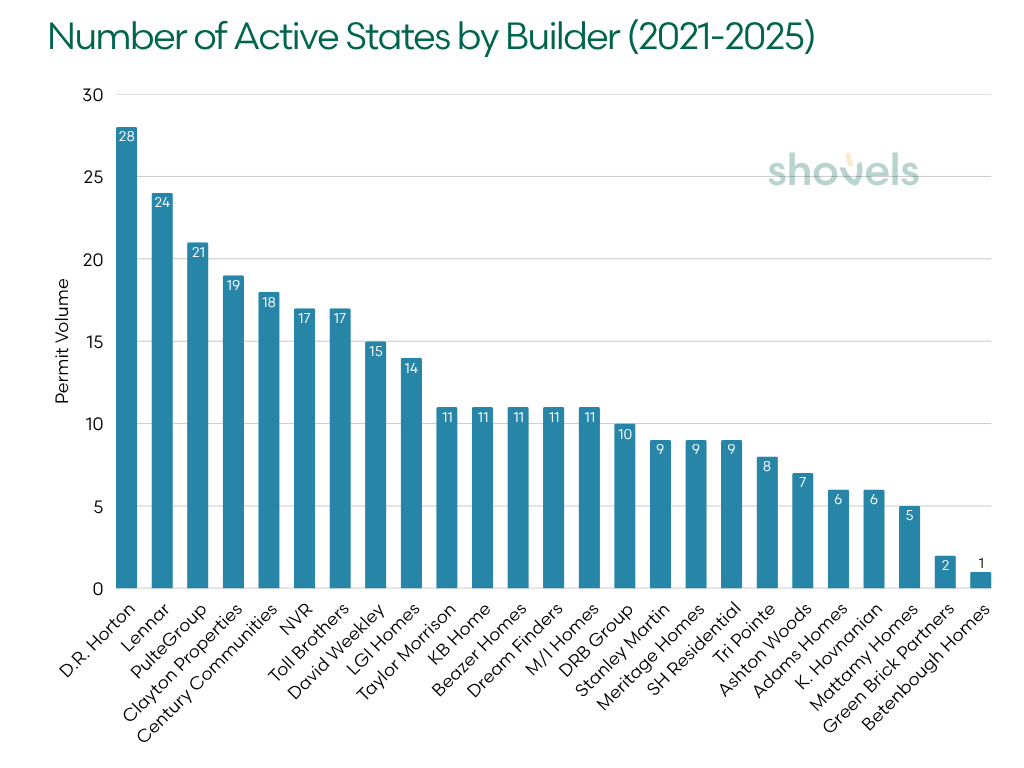
Total volume is just part of the story. Not all builders scale the same way. Some expand nationally, spreading risk across markets. Others go deep in a smaller number of regions. Here's a breakdown of the number of states where each builder is active, based on permit activity across the full 2021–2025 dataset.
| Tier | Builder | States Active |
|---|---|---|
| National (12+ states) | D.R. Horton | 28 |
| Lennar | 24 | |
| PulteGroup | 21 | |
| Clayton Properties | 19 | |
| Century Communities | 18 | |
| NVR | 17 | |
| Toll Brothers | 17 | |
| David Weekley | 15 | |
| LGI Homes | 14 | |
| Multi-Regional (8-11 states) | Taylor Morrison | 11 |
| KB Home | 11 | |
| Beazer Homes | 11 | |
| Dream Finders | 11 | |
| M/I Homes | 11 | |
| DRB Group | 10 | |
| Stanley Martin | 9 | |
| Meritage Homes | 9 | |
| SH Residential | 9 | |
| Tri Pointe | 8 | |
| Deep Regional (1-7 states) | Ashton Woods | 7 |
| Adams Homes | 6 | |
| K. Hovnanian | 6 | |
| Mattamy Homes | 5 | |
| Green Brick Partners | 2 | |
| Betenbough Homes | 1 |
D.R. Horton is the clearest example of the national model, operating in 28 states. Lennar (24 states) and PulteGroup (21 states) follow similar strategies, balancing scale with geographic diversification.
At the other end of the spectrum, regional builders are going deep. Companies like Betenbough Homes and Green Brick Partners focus on select markets, building local advantages in permitting relationships, supplier networks, and brand recognition.
Both approaches show up clearly in the data. National builders dominate total volume, but regional players often punch above their weight in specific markets.
Where Top 12 Builders Are Focusing in 2026
The Q1 2026 data makes each builder's current state-level focus very clear. Here's a look at the twelve builders with the most geographically concentrated activity in Q1 2026.
| Builder | #1 State (permits) | #2 State (permits) | #3 State (permits) |
|---|---|---|---|
| D.R. Horton | FL (1,155) | TX (887) | NC (762) |
| Lennar | FL (699) | TX (530) | CA (444) |
| Meritage Homes | NC (112) | AZ (99) | TX (78) |
| KB Home | CA (229) | NV (204) | AZ (106) |
| Ashton Woods | NC (134) | TX (74) | FL (58) |
| NVR | NC (301) | VA (164) | FL (131) |
| PulteGroup | FL (663) | NC (287) | AZ (172) |
| LGI Homes | NC (110) | TX (76) | CA (50) |
| Toll Brothers | NV (132) | VA (92) | NC (81) |
| Dream Finders | CO (139) | FL (115) | NC (55) |
| M/I Homes | FL (204) | NC (95) | TX (65) |
| Clayton Properties | CO (151) | NC (131) | GA (61) |
D.R. Horton's Florida concentration (1,155 permits in Q1) leads all states by a wide margin. KB Home leads with California (229 permits) but Nevada has emerged as a close second (204). Toll Brothers shows strength across Nevada (132), Virginia (92), and North Carolina (81), confirming that luxury new construction demand is holding across multiple markets.
Where the New Action Is: Key Markets
Zooming in further, a handful of metros stand out as focal points for builder activity. Unsurprisingly, residential buildouts follow population migration. Texas and the Carolinas have been among the fastest-growing states in the country by net domestic migration, drawing hundreds of thousands of new residents annually. Americans are following lower costs, warmer climates, and more permissive land-use environments.
 Townhomes are a popular option in dense, high-demand areas.
Fort Worth, TX: The Top City to Watch in America
Fort Worth is the clearest example of a metro on the rise. In Q1 2026, Lennar led with 421 permits, D.R. Horton followed with 300, and Meritage Homes added 40, combining for more than 760 permits from three builders in a single city. Land availability, efficient permitting, and proximity to major job centers have made it a hub for large-scale development.
What builders are actively offering provides a live read on who is actually moving to the market. D.R. Horton's Fort Worth listings skew toward 3-4 bedroom entry-level homes. Lennar is running a wider range, from starter homes around $261k to 4-5 bedroom move-up product near $440k, including their Next Gen® suite format aimed at multigenerational buyers.
Charlotte, NC: The Townhome Story
Charlotte offers another angle on expansion. Here, builders are leaning into townhomes and higher-density formats, hemmed in by affordability constraints and land scarcity in high-demand areas. In Q1 2026, D.R. Horton led Charlotte with 120 permits, followed by NVR with 108 and Mattamy Homes with 80. PulteGroup pulled 104 permits in nearby Durham, with Lennar close behind at 100.
Ryan Homes' 28 active Charlotte communities and Mattamy's newest townhome openings are almost entirely 3-bedroom offerings in the $215k–$370k range. The mix is itself a data point: builders' own research suggests Charlotte demand is coming from smaller households—couples, young professionals, and commuters. These are not large families seeking square footage.
Denver, CO: The Move-Up Market Hiding in Plain Sight
Colorado doesn't get the same headlines as Texas or Florida, but the permit data still tells an interesting story. Dream Finders pulled 139 permits in Colorado in Q1 2026, their single highest state, with eight active Denver-metro communities ranging from townhomes near Arvada starting at $399k to single-family homes in Parker from $615k.
Clayton Properties similarly led with Colorado as their top Q1 state. For both builders, Colorado offers something the South doesn't easily provide: higher price points, less competition from the national volume builders, and buyers with more purchasing power. The floor plans reflect it. Dream Finders is building 3-6 bedroom homes up to 4,100 sq ft, a noticeably larger product than their Southeast portfolio.
Manteca, CA: The Central Valley Proving Ground
Manteca rarely shows up in national homebuilder headlines, but it's an active region that's gaining volume. Lennar pulled 99 permits in Manteca in Q1 2026 alone, with another 93 in nearby Roseville, deliberately concentrating California activity in the Central Valley and Sacramento corridor rather than coastal markets.
They're not alone: D.R. Horton, Lennar, and KB Home are all actively selling in the same master-planned communities in Villa Ticino and Griffin Park, building 3–6 bedroom homes priced from the high $500ks to low $600ks. When three national builders are present in the same community at the same price tier, the demand analysis is clear. Manteca's Central Valley buyers, many of them priced out of the Bay Area, are a real and growing market.
The Takeaway: Fort Worth, Charlotte, and the Central Valley are the bellwether markets of this cycle. Builders who established footholds in these metros early are the ones pulling the most permits now.
Which Builders Are Growing Their Footprint? Which Ones Are Pulling Back?
Looking at the past five years, we can see how top builders are faring more broadly and which ones are poised to accelerate in 2026.
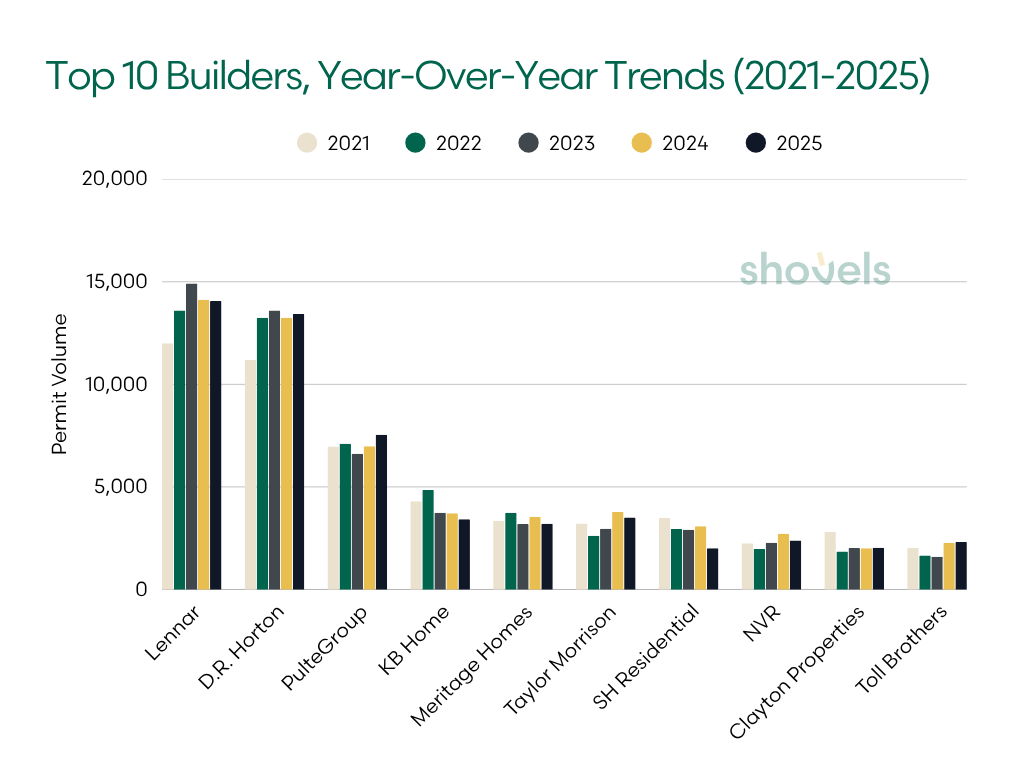
At the top, the largest builders have more or less plateaued. Lennar and D.R. Horton grew steadily through 2023 before leveling off in 2024. PulteGroup has remained relatively stable throughout with measured growth in 2025.
SH Residential's decline is best understood through a major corporate event. The company is the U.S. subsidiary of Sekisui House, the Japanese homebuilding conglomerate that completed a $4.9 billion acquisition of M.D.C. Holdings, the parent company of Richmond American Homes, in April 2024. The integration and rebranding that followed likely account for the permit slowdown.
Toll Brothers is the clearest recovery story, rebounding from a 2023 low and stabilizing through 2025 despite operating in a rate-sensitive luxury segment.
| Builder | 2021 | 2022 | 2023 | 2024 | 2025 | Trend |
|---|---|---|---|---|---|---|
| Lennar | 11,999 | 13,603 | 14,918 | 14,121 | 14,059 | Plateau |
| D.R. Horton | 11,188 | 13,244 | 13,597 | 13,250 | 13,433 | Plateau |
| PulteGroup | 6,970 | 7,106 | 6,617 | 6,987 | 7,537 | Stable |
| KB Home | 4,298 | 4,852 | 3,742 | 3,712 | 3,420 | Declining |
| Meritage Homes | 3,354 | 3,739 | 3,187 | 3,543 | 3,199 | Stable |
| Taylor Morrison | 3,218 | 2,619 | 2,956 | 3,779 | 3,507 | Growing |
| SH Residential | 3,491 | 2,950 | 2,909 | 3,082 | 2,005 | Sharp drop |
| NVR | 2,251 | 1,975 | 2,274 | 2,722 | 2,383 | Growing then dip |
| Clayton Properties | 2,820 | 1,849 | 2,021 | 2,004 | 2,034 | Declined, now steady |
| Toll Brothers | 2,030 | 1,657 | 1,598 | 2,274 | 2,320 | Recovery |
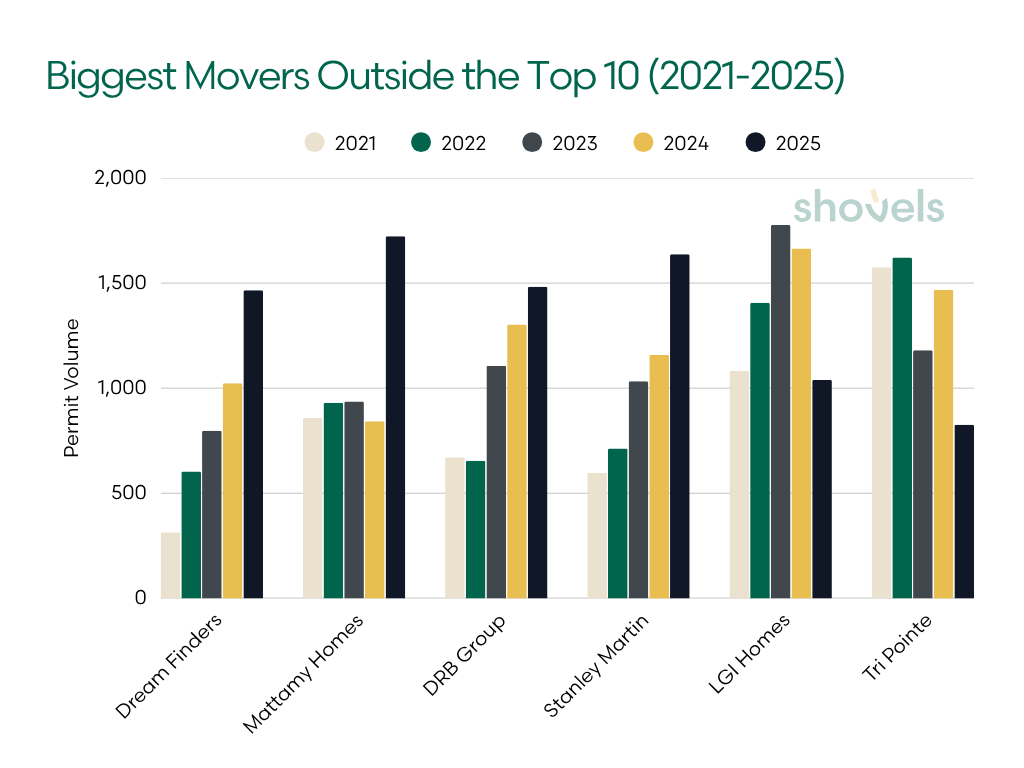
Outside the top 10 builders, the divergence becomes more pronounced. We also looked at the biggest movers in the top 25.
| Builder | 2021 | 2022 | 2023 | 2024 | 2025 | Trend |
|---|---|---|---|---|---|---|
| Dream Finders | 314 | 604 | 798 | 1,023 | 1,466 | Consistent growth |
| Mattamy Homes | 858 | 931 | 937 | 843 | 1,723 | 2025 breakout |
| DRB Group | 671 | 655 | 1,106 | 1,303 | 1,483 | Consistent growth |
| Stanley Martin | 597 | 713 | 1,033 | 1,158 | 1,637 | Consistent growth |
| LGI Homes | 1,082 | 1,407 | 1,776 | 1,664 | 1,039 | Peak then dip |
| Tri Pointe | 1,575 | 1,622 | 1,181 | 1,468 | 826 | Sharp drop |
Dream Finders Homes stands out as the cleanest growth story, increasing permit volume every year from 2021 through 2025. Mattamy Homes shows a different pattern, a quiet few years followed by a sharp breakout in 2025. That breakout is directly traceable to a deliberate geographic push: Mattamy launched a new Southwest Florida Division in April 2025 covering markets from Sarasota to Naples, simultaneously expanded into Raleigh with four new communities, and acquired land in Arizona, moves that collectively drove their permit volume to a five-year high.
Stanley Martin has also posted consistent gains, growing permit volume from 597 in 2021 to 1,637 in 2025 through steady expansion across the Mid-Atlantic and Southeast.
On the other side, several builders are pulling back. Tri Pointe saw significant declines in 2025, while LGI Homes peaked in 2023 and has been trending downward since. These shifts likely reflect changes in land pipelines, financing conditions, or market exposure.
The divergence between builders like LGI and Toll Brothers reflects a broader split in the market. Entry-level buyers, LGI's core customer, faced the sharpest affordability squeeze as rates stayed elevated, while luxury and move-up buyers were more likely to bring home equity or pay in cash, making them less rate-sensitive. That dynamic helps explain why builders targeting different price points have had such different trajectories over the same period.
The Takeaway: The builders gaining ground heading into 2026, Dream Finders, Mattamy Homes, DRB Group, and Stanley Martin, either expanded aggressively into new geographies or serve buyers who aren't rate-constrained.
Builder by Builder: What the Permit Data Shows
For buyers and vendors evaluating different builders, permit volume and trends reveal something reviews don't: how consistently a company is actually building. Here's what the data shows for six of the most-searched builders.
Lennar
For buyers asking whether Lennar is a good builder, the permit data is clear. Lennar is the most active homebuilder in the country, with 68,699 permits over five years across 24 states. Activity has been steady, peaking in 2023 (14,919 permits) before leveling through 2024 and into 2025. Lennar operates across nearly every major Sun Belt market and ranks near the top in most of them.
D.R. Horton
For D.R. Horton, scale is hard to ignore. Active in 28 states with 64,713 permits, Horton is the widest-reaching builder in the U.S. and has maintained a consistent pace since 2022. Their focus on entry-level and move-up homes has helped sustain demand, even as affordability tightened.
PulteGroup
For PulteGroup, consistency stands out. Permit volume has stayed between 6,600 and 7,500 annually since 2021, across 21 states. Their multi-brand approach (Centex, Del Webb, DiVosta) allows them to serve different buyer segments while maintaining steady output.
KB Home
How KB Home fares is harder to answer with permit data. Permits have declined from 4,852 in 2022 to 3,420 in 2025. This represents a 29% drop. Active in 11 states, KB remains concentrated in California, Texas, and the Southeast, with trends suggesting a pullback in volume, potentially in favor of margin discipline.
Taylor Morrison
Taylor Morrison is a growth story. After a dip in 2022, permits have increased each year since, reaching 3,779 in 2024 and holding near that level in 2025. Active in 11 states, the builder is concentrated in Florida, Arizona, and Texas, with a focus on move-up and higher-end segments.
Meritage Homes
For buyers asking whether Meritage Homes is a good builder, stability is the key signal. Permit volume has held between 3,187 and 3,739 annually over five years. With a strong Sun Belt presence and a focus on energy-efficient homes, Meritage has remained consistently positioned in the mid-tier.
The Takeaway: Permit volume doesn't measure quality, but it does measure commitment. Builders with steady or growing permit counts (Lennar, D.R. Horton, Taylor Morrison, Meritage) are consistently delivering. Declining permit counts, like KB Home's 29% drop since 2022, signal strategic contraction that buyers and vendors should factor in.
A Concentrated Path to Closing the Housing Gap
Our permit data confirms what the headlines have been saying: housing supply is geographically clustered and increasingly in the hands of builders with the scale, land pipelines, and permitting relationships to keep building when conditions get difficult.
That concentration is unlikely to change. The same structural advantages that carried Lennar, D.R. Horton, and PulteGroup to the top of this list make it harder, not easier, for smaller competitors to close the gap nationally. This is particularly the case in a rate environment where the capital to offer buydowns and hold lots through slow periods has become its own form of competitive moat.
What's less settled is what happens within the top 25 itself. The 2025 data shows the field splitting along predictable lines: builders with move-up and luxury exposure are holding up better than those targeting entry-level buyers, and builders who concentrated early in Texas and the Carolinas are outperforming those who didn't. The builders entering 2026 with the strongest momentum are, almost without exception, the ones who placed those geographic and segment bets early.
The permit data will keep moving. What this list looks like in 12 months will depend on how the rate environment evolves, where migration patterns shift, and which builders have land positioned to move quickly when conditions improve.
If you're interested in exploring building permit and contractor data, check out Shovels Online or contact us for customized solutions.
Frequently Asked Questions
- Who is the #1 homebuilder in the US by permit volume?
-
Lennar is the most active homebuilder in the US by permit volume, with 68,699 permits issued between 2021 and 2025 across 24 states. D.R. Horton ranks second with 64,713 permits across 28 states, the widest geographic reach of any builder. Together, Lennar and D.R. Horton account for nearly 40% of all top-25 permit volume over five years.
- Which states have the most new home construction?
-
Florida, Texas, and North Carolina lead the country in new home construction activity. Multiple national builders compete simultaneously in the same metros in each of these states, with Fort Worth, Charlotte, and the Research Triangle seeing the heaviest concentration of permits. Florida alone accounted for over 1,100 D.R. Horton permits in Q1 2026.
- Which homebuilders are growing the fastest?
-
Among the top 25, Dream Finders Homes posted the most consistent growth, increasing permit volume every year from 2021 through 2025. Mattamy Homes had a breakout 2025, more than doubling its 2024 volume after launching a new Southwest Florida division and expanding into Raleigh. DRB Group and Stanley Martin also posted consistent year-over-year gains.
- What does permit data reveal that home sales data doesn't?
-
Permit data is a leading indicator: a permit filed today typically reflects a home that hits the market 6 to 18 months later. This makes it one of the earliest available signals of builder momentum, geographic focus, and pipeline health. Permit volume also reveals which builders are actively investing in new communities, regardless of what their reported sales or delivery figures show.
- How concentrated is America's homebuilding industry?
-
Highly concentrated, and getting more so. The top 3 builders (Lennar, D.R. Horton, PulteGroup) account for roughly half of all top-25 permit volume over five years. The top 10 now represent approximately half of all new single-family home sales nationally, up from about a third two decades ago. Scale advantages in land acquisition, permitting, and financing are making it harder for smaller builders to compete nationally.