

Residential HVAC is one of the largest categories of home improvement work in the United States. But it’s also one of the hardest to see on the record. Most replacements happen quietly, a failed condenser in July or a furnace that gives out in January, with no listing, no sale, and no paper trail beyond a building permit.
To help understand how this market is moving, we analyzed HVAC permits on existing homes across more than 1,100 jurisdictions where Shovels has consistent coverage, covering roughly 54.6 million homes. The picture shows national permit activity falling steadily. HVAC work fell about 8% between 2021 and 2025, and the first quarter of 2026 shows no hint of a rebound.
Our findings, however, point to distinct opportunities: higher permit rates in the upper Midwest and Southeast, a growing share of heat pump work, and replacement activity concentrated in homes built during the 2000s housing boom. Local contractor markets also vary widely, from thousands of firms sharing the work to a handful accounting for more than half of recorded activity.
Key takeaways
- We see fewer jobs, not more: Permitted HVAC work on existing homes fell about 8% from 2021 to 2025, and early 2026 showed no rebound.
- Regional markets differ sharply: Minnesota recorded 31 HVAC jobs per 1,000 homes in 2025, ahead of North Carolina at about 27.
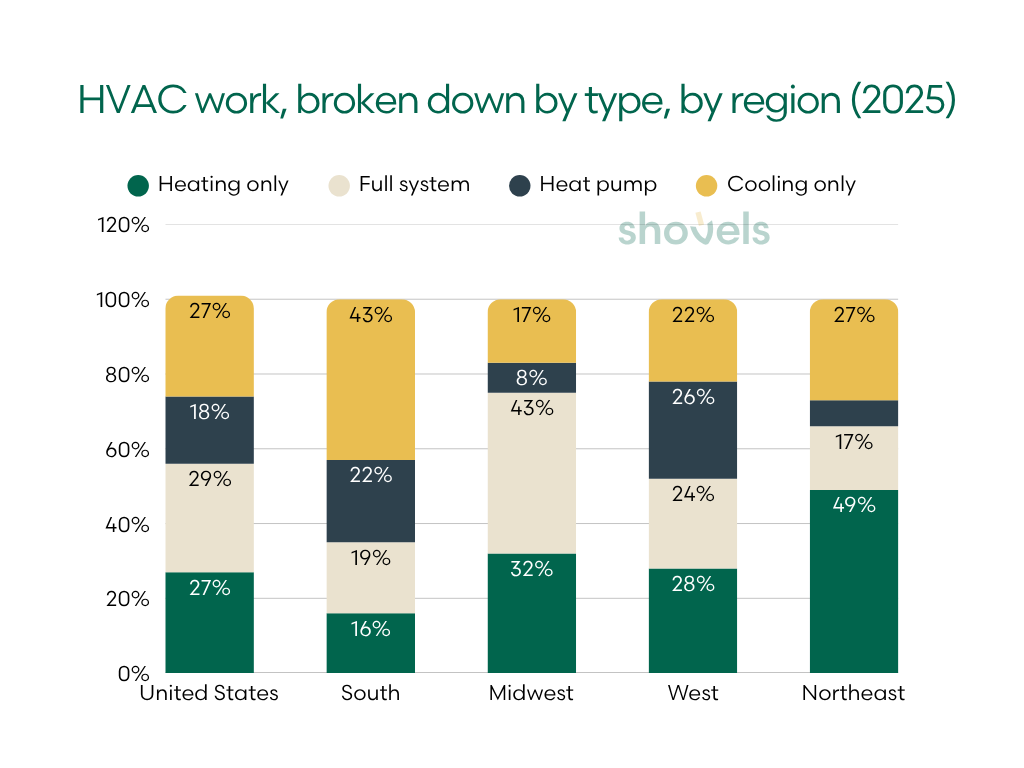
- AC replacements dominate in the South: 43% of Southern permits that name equipment are cooling-only, while 43% of Midwestern permits cover full systems.
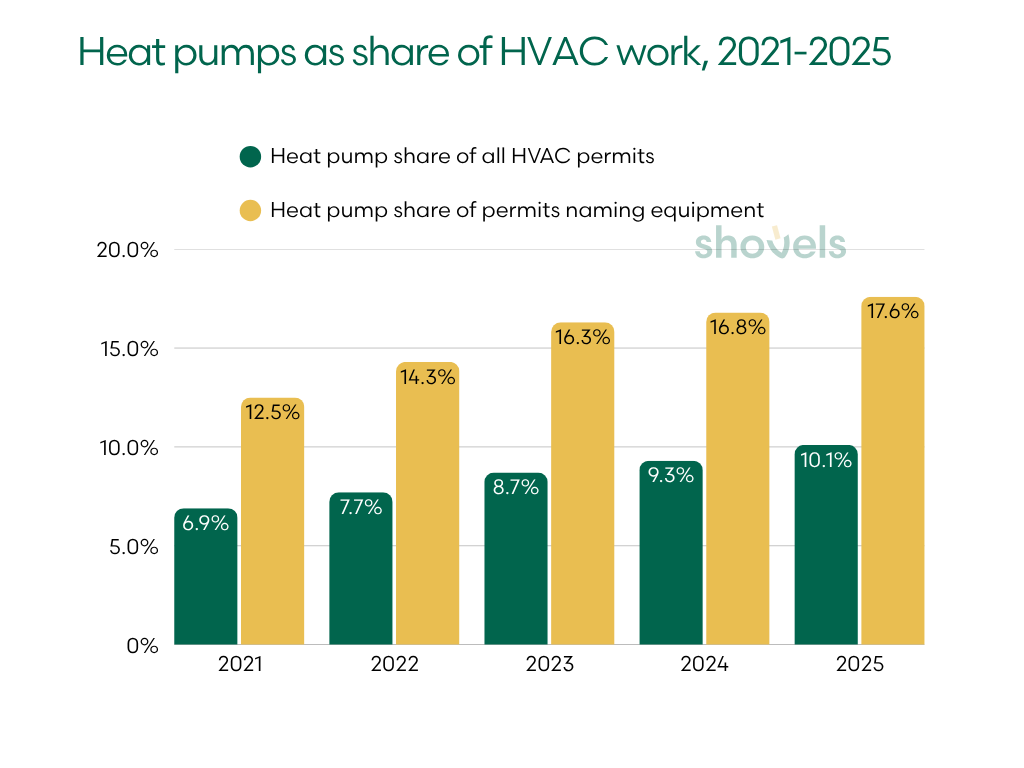
- Heat pumps are gaining share: Heat pumps increased from 6.9% of HVAC permits in 2021 to 10.1% in 2025.
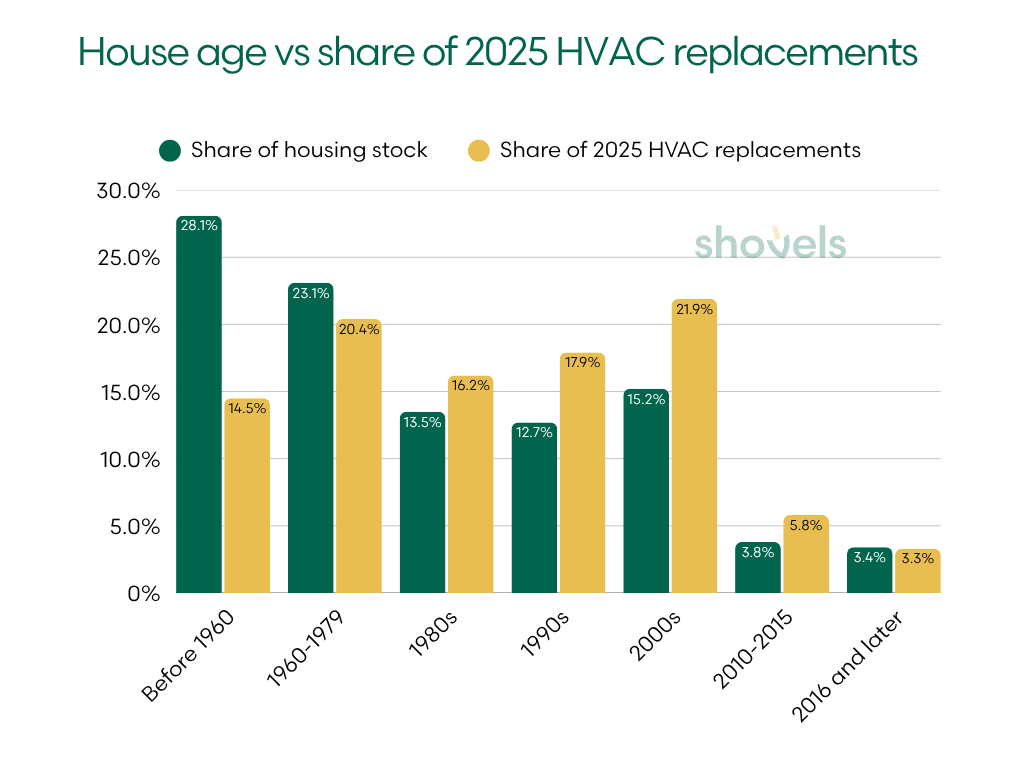
- The 2000s boom is aging into replacement: Homes built in the 2000s make up 15% of the housing stock but 22% of 2025 replacements.
Methodology
We analyzed residential HVAC permits on existing homes (replacements and general HVAC work, excluding new construction) filed from January 2021 through March 2026. The analysis covers 1,191 jurisdictions in 47 states where Shovels has consistent year-over-year data, representing roughly 40% of U.S. housing.
For activity rates, we count each home once per year, even if it has multiple HVAC permits, and report that count per 1,000 housing units in covered jurisdictions. Equipment, home-age, and contractor analyses use separate subsets.
Our figures capture only permitted HVAC work and should be read as directional trends, not a precise count of all installations. Permits are not pulled for all HVAC work, so actual aggregate activity may differ.
HVAC work on existing homes fell 8% since 2021
The pandemic brought forward years of home improvement work, including HVAC upgrades. Our data shows HVAC permit activity peaking in 2022, then declining each year since.
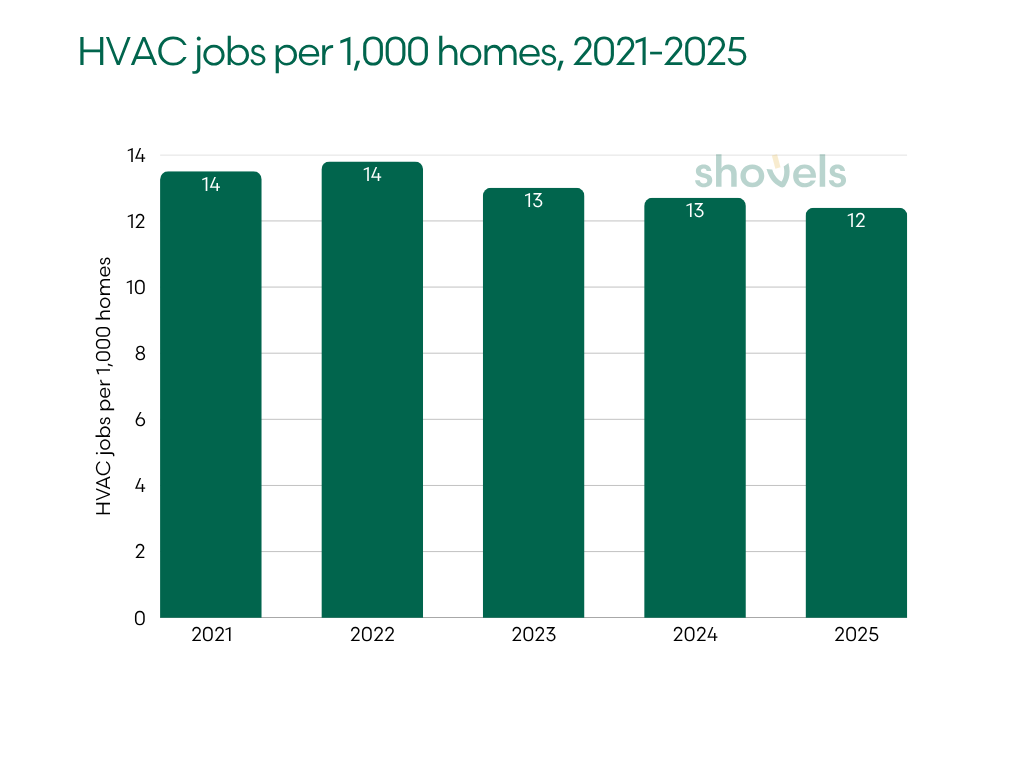
| Year | HVAC jobs per 1,000 homes | YoY |
|---|---|---|
| 2021 | 13.5 | - |
| 2022 | 13.8 | +2.4% |
| 2023 | 13.0 | -6.0% |
| 2024 | 12.7 | -2.4% |
| 2025 | 12.4 | -2.1% |
By 2025, about 593,600 homes in the jurisdictions we looked at had permitted HVAC work, down from roughly 645,200 in 2021. Equipment shipments fell much more sharply: AHRI reported 7.75 million central air conditioners and heat pumps shipped in 2025, compared with 10.2 million in 2021.
The two measures point in the same direction but capture different stages of the market: shipments track equipment sent to distributors, while permits record planned work at homes. The permit data shows a more gradual decline.
First-quarter 2026 activity roughly matched the same period in 2025. So far, permitted HVAC work is holding near its recent level, with no clear rebound.
The upper Midwest and the Southeast pull the most HVAC permits
The national decline alone masks where HVAC work remains most active. In 2025, the highest permit rates were in the upper Midwest and Southeast, where long heating or cooling seasons create sustained demand.
West North Central, which includes Minnesota, Nebraska, and Missouri, led in HVAC activity, followed by East South Central and South Atlantic. (We left out New England and Middle Atlantic because our coverage is currently too limited to be representative.)
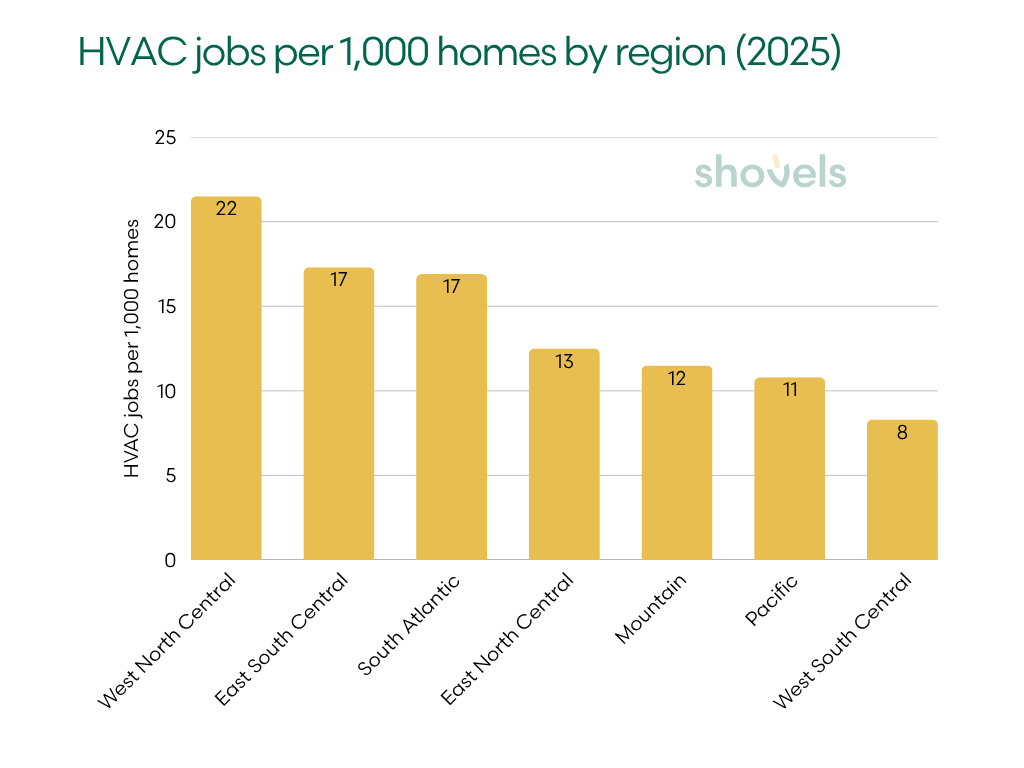
| Census division | HVAC jobs per 1,000 homes (2025) |
|---|---|
| West North Central | 21.5 |
| East South Central | 17.3 |
| South Atlantic | 16.9 |
| East North Central | 12.5 |
| Mountain | 11.5 |
| Pacific | 10.8 |
| West South Central | 8.3 |
Long winters put sustained strain on furnaces and boilers in the upper Midwest. In the Southeast, extended cooling seasons keep air conditioners running for much of the year. Those different demands help explain why both regions rank highly.
Among the states in the regions we analyzed, Minnesota had the most HVAC activity, with 31.1 homes with permitted HVAC work per 1,000 homes, followed by North Carolina at 27.2.
Permitting practices also matter. For example, we know that HVAC activity is high in California, but research has documented consistent low permitting rates for HVAC replacements, so a lower recorded rate does not necessarily mean less work. Regional rankings just show where HVAC activity is most visible in the permit record.
The Takeaway: The upper Midwest and the Southeast lead on HVAC permits per home, driven by heating in one and cooling in the other. Local permitting rules shape these rates too.
Fort Wayne, Sarasota, and Raleigh lead the metro rankings
Climate, storm recovery, and local permitting rules all help explain which metros show the most HVAC activity. Long heating and cooling seasons drive demand, while hurricanes can trigger waves of replacements. Permit requirements also determine how much routine work enters the record.
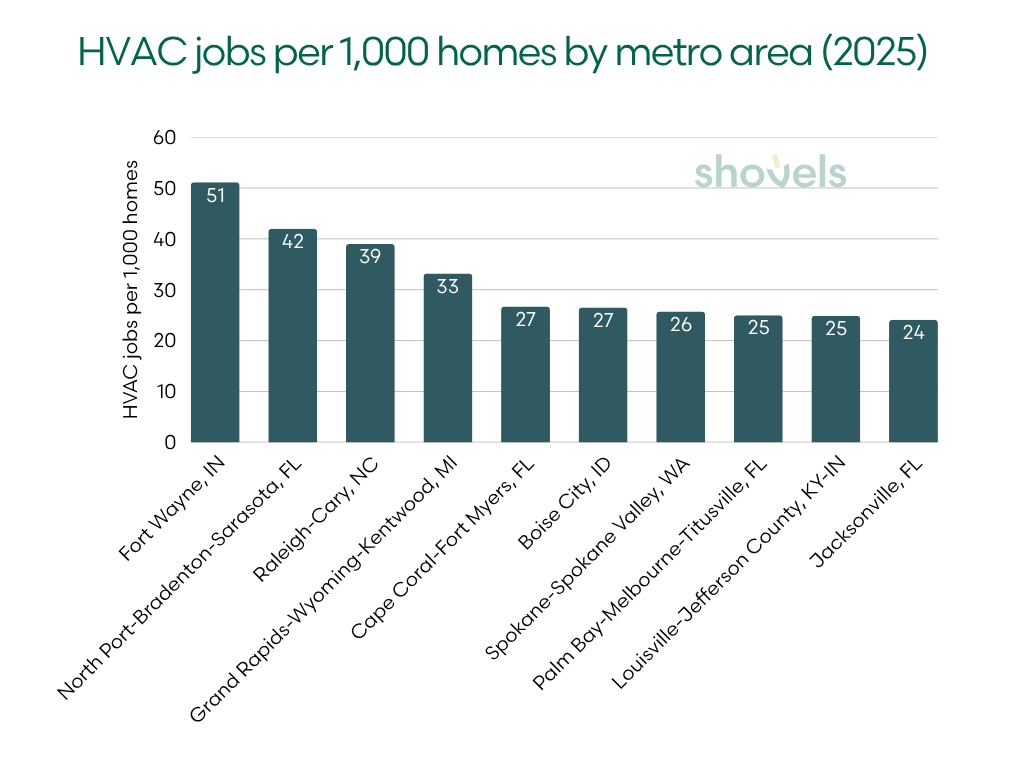
| Metro | HVAC jobs per 1,000 homes (2025) |
|---|---|
| Fort Wayne, IN | 51.1 |
| North Port-Bradenton-Sarasota, FL | 42.0 |
| Raleigh-Cary, NC | 39.0 |
| Grand Rapids-Wyoming-Kentwood, MI | 33.2 |
| Cape Coral-Fort Myers, FL | 26.7 |
| Boise City, ID | 26.5 |
| Spokane-Spokane Valley, WA | 25.7 |
| Palm Bay-Melbourne-Titusville, FL | 25.0 |
| Louisville-Jefferson County, KY-IN | 24.9 |
| Jacksonville, FL | 24.1 |
Fort Wayne, Sarasota, and Raleigh lead the 2025 rankings, each reflecting a different mix of these factors. In Fort Wayne, long winters and permit requirements both likely contribute to the high rate. Furnaces endure months of sustained use, and Allen County requires a mechanical permit even for a like-for-like HVAC replacement. Routine changeouts therefore enter the record alongside larger projects.
In Sarasota, hurricane recovery adds to demand from a long cooling season. Hurricanes Helene and Milton damaged equipment in 2024, and Sarasota County waived permit fees for storm-related AC changeouts. That recovery work is an important consideration when interpreting the metro’s position. Our hurricane recovery analysis explores how storm damage translates into permitted work.
Raleigh combines sustained cooling demand with rules that capture routine replacements. North Carolina requires a mechanical permit and a licensed contractor for HVAC replacement. Together, Florida and North Carolina account for five of the top 10 metros.
For businesses comparing markets, the distinction matters: a high rate may reflect recurring replacement demand, temporary recovery work, or more comprehensive permitting.
The Takeaway: The top metros each reflect a different mix of climate, storm recovery and permitting rules. Florida and North Carolina account for half of the top 10.
Cooling-only work leads in the South. Combined systems lead in the Midwest.
Climate shapes the type of HVAC work and predicts its frequency. Among permits that identify equipment, cooling-only work dominates in the South. Combined heating and cooling work is more common in the Midwest.
| Region | Heating only | Cooling only | Full system | Heat pump |
|---|---|---|---|---|
| United States | 27% | 27% | 29% | 18% |
| South | 16% | 43% | 19% | 22% |
| Midwest | 32% | 17% | 43% | 8% |
| West | 28% | 22% | 24% | 26% |
| Northeast | 49% | 27% | 17% | 7% |
We looked at 2025 permits on existing homes in jurisdictions where at least half of permits identify equipment. “Full system” means heating and cooling equipment named on the same permit. Shares may not total 100% because of rounding.
In the South, cooling-only work accounts for 43% of permits that identify equipment, consistent with EIA data showing that 93% of Southern households use air conditioning. Florida is the clearest example: 81% of its equipment-identifying permits are cooling-only, compared with just 1% for heating-only work.
In the Midwest, combined heating and cooling systems account for 43%, with heating-only work contributing another 32%. Minnesota leans toward combined systems, at 48%, while Wisconsin leans toward heating-only work, at 50%.
The West has the highest heat pump share among equipment-identifying permits, at 26%. Nationwide, heat pumps also account for a growing share of recorded HVAC work.
The Takeaway: Nationally, the work splits evenly between heating, cooling and combined systems. Regionally it doesn't: cooling-only work leads in the South, and combined systems lead in the Midwest.
Heat pumps went from 1 in 14 HVAC permits to 1 in 10
Heat pumps provide both heating and cooling. Their share of HVAC permits on existing homes rose every year from 2021 through 2025, even as overall activity declined.
| Year | Heat pump share of all HVAC permits | Heat pump share of permits naming equipment |
|---|---|---|
| 2021 | 6.9% | 12.5% |
| 2022 | 7.7% | 14.3% |
| 2023 | 8.7% | 16.3% |
| 2024 | 9.3% | 16.8% |
| 2025 | 10.1% | 17.6% |
Table shows jurisdictions where Shovels reports consistent year-over-year data. The second percentage column covers jurisdictions where at least half of permits name the equipment installed.
Washington had the highest share among the states highlighted in this analysis, at 26.4%, followed by Ohio at 24.1%, Maryland at 22.3%, and North Carolina at 21.1%. Oregon also stood out at 20.8%.
California recorded a particularly sharp increase, from 4.6% in 2021 to 15.5% in 2025. That rise coincides with incentive programs such as TECH Clean California and the policy changes discussed in our analysis of California home electrification.
It’s important to note that permit descriptions do not always distinguish heat pumps from conventional air conditioners, and more detailed reporting may explain part of the increase. Even with that limitation, heat pumps represent a growing share of the work explicitly recorded.
Homes built in the 2000s account for the largest share of replacements
Equipment choice is changing, but replacement opportunities also depend on the homes already in place. Homes built during the 2000s housing boom account for 15% of housing in the markets we looked at. However, they represent 22% of recorded replacements, the largest share among the age groups analyzed.
| Year built | Share of housing stock | Share of 2025 replacements | Index* |
|---|---|---|---|
| Before 1960 | 28.1% | 14.5% | 0.52 |
| 1960-1979 | 23.1% | 20.4% | 0.88 |
| 1980s | 13.5% | 16.2% | 1.20 |
| 1990s | 12.7% | 17.9% | 1.40 |
| 2000s | 15.2% | 21.9% | 1.44 |
| 2010-2015 | 3.8% | 5.8% | 1.52 |
| 2016 and later | 3.4% | 3.3% | 0.97 |
* Replacement permits in jurisdictions where most HVAC permits identify replacement work. An index above 1.0 means homes of that age are over-represented among replacements.
Homes built from 2000 through 2009 were 16 to 25 years old in 2025. Any original equipment would be approaching or beyond the 15- to 20-year service life manufacturers commonly cite for central air conditioners. While home age does not establish the age of the current system, it can be an indicator for neighborhoods where replacement work is in demand.
The younger 2010–2015 cohort also accounts for more replacements than its share of housing would suggest. That pattern is stronger in the South: these homes account for 1.43 times their share of housing among replacements, compared with 0.85 in the Midwest.
Home age, local conditions, and prior permit history all impact whether replacement work is needed. The same construction period can represent a different replacement opportunity in a hot Southern market than in a Midwestern one.
HVAC is still local: the biggest brand handles about 1 in 75 jobs
Replacement work is still dominated by local brands. The largest single brand in our data, American Residential Services (ARS), filed about 11,500 permits across 19 states and 64 metros in 2025. This is roughly 1 in 75 existing-home HVAC permits.
Brand share, however, is not the same as ownership share. Platforms such as Apex Service Partners operate multiple companies under their local names. The figures here group contractors by brand, rather than combining all brands owned by the same parent.
At the metro level, concentration varies widely. In some large markets, thousands of contractors share permitted HVAC work. In others, a few firms account for a substantial share.
| Metro | Contractors filing permits* | Top-5 share | Leading contractor (share) |
|---|---|---|---|
| Tampa-St. Petersburg-Clearwater, FL | 2,262 | 10% | Acree Air Conditioning (2%) |
| Los Angeles-Long Beach-Anaheim, CA | 4,812 | 11% | NexGen Air Conditioning and Heating (3%) |
| Dallas-Fort Worth-Arlington, TX | 1,286 | 14% | Milestone Electric (4%) |
| Minneapolis-St. Paul-Bloomington, MN-WI | 1,153 | 20% | K & S Heating, Air Conditioning & Plumbing (6%) |
| Detroit-Warren-Dearborn, MI | 1,792 | 27% | Randazzo Mechanical (10%) |
| Memphis, TN-MS-AR | 546 | 41% | ARS (19%) |
| Las Vegas-Henderson-North Las Vegas, NV | 276 | 54% | Sierra Air Conditioning (23%) |
* We looked at 2025 HVAC permits on existing homes that name a contractor.
Tampa and Los Angeles illustrate the fragmented end of the spectrum. More than 2,200 contractors filed permits in Tampa, yet the top five accounted for just 10%. Los Angeles had more than 4,800, with the top five holding 11%.
Memphis and Las Vegas were more concentrated. The top five contractors accounted for 41% of contractor-identified permits in Memphis and 54% in Las Vegas. Sierra Air Conditioning alone represented 23% in Las Vegas.
Overall, the fragmented landscape matches how industry advisors describe the sector: highly fragmented, with residential services midway through a consolidation cycle. For now, the typical HVAC job in America is still done by a local firm.
The Takeaway: Even the biggest HVAC brand handles about 1 in 75 permitted jobs. In most large metros, hundreds or thousands of local contractors share the work, though private-equity platforms own more of them than brand names show.
How the permit record can help contractors, manufacturers, and lead buyers
A slower national market still contains distinct local opportunities. The most useful signals come from combining market activity, equipment mix, home age, and contractor concentration.
For HVAC contractors, identify replacement opportunities and assess the competition. Homes built during the 2000s boom account for a disproportionate share of replacements in the study markets. Combine construction year with prior HVAC permits to refine prospecting, then use local contractor activity to understand who already serves those neighborhoods. Our guide to finding construction leads with permit data explains how to put those signals to work.
For manufacturers and distributors, plan around regional equipment needs. Florida’s cooling-heavy mix differs from Minnesota’s emphasis on combined systems, while heat pumps are gaining share. Permit descriptions can inform inventory planning and contractor support alongside shipment data. Local contractor concentration also helps determine how broadly to build distribution relationships.
For marketers and lead buyers, use home age as a starting filter. Pair it with geography and permit history, including whether a property has recently recorded HVAC work. That provides a more specific basis for targeting than location or construction year alone.
Looking to explore HVAC activity in your markets? Shovels connects building permits, contractors, and property details so teams can assess local demand, refine prospecting, and benchmark competitors. Contact us to learn more, or start a free trial.
Frequently asked questions about HVAC permit activity
- Is permitted HVAC activity going up or down?
-
It has declined gradually in the jurisdictions analyzed. The rate fell from 13.5 homes with permitted HVAC work per 1,000 homes in 2021 to 12.4 in 2025, about an 8% decline. First-quarter 2026 activity roughly matched the same period in 2025.
- Which states have the highest HVAC permit rates?
-
Among the 32 states with at least 250,000 homes covered, Minnesota led in 2025 at 31.3 homes with permitted HVAC work per 1,000 homes, followed by North Carolina at 27.2. Rates reflect covered jurisdictions and are influenced by permitting requirements and compliance as well as demand.
- Which metros have the highest HVAC permit rates?
-
Among qualifying metros, Fort Wayne led in 2025 at 51.1 per 1,000 homes, followed by North Port–Bradenton–Sarasota at 42.0 and Raleigh–Cary at 39.0. Qualifying metros have at least 150,000 covered homes and coverage of at least 40% of metro housing.
- Are heat pumps becoming more common in HVAC permits?
-
Yes. Heat pumps rose from 6.9% of HVAC permits on existing homes in 2021 to 10.1% in 2025 in the trend sample. Descriptions do not always identify equipment, so these figures measure explicitly recorded heat pump work.
- Which homes account for the most HVAC replacement work?
-
Homes built in the 2000s accounted for the largest share among the construction-age groups analyzed: 21.9% of 2025 replacements, compared with 15.2% of housing in the study markets. Construction year is a useful targeting signal, but does not establish the age or condition of the current equipment.
- Do you need a permit to replace an HVAC system?
-
Requirements depend on the jurisdiction and scope of work. Some jurisdictions require a mechanical permit even for a like-for-like replacement. Check with the local building department; our mechanical permit guide explains the basics.
- Who are the largest residential HVAC contractors?
-
The largest single brand in Shovels data, American Residential Services (ARS), filed about 11,500 existing-home HVAC permits in 2025 across 19 states and 64 metros, roughly 1 in 75 permits. This is a brand-level comparison; platforms owning multiple local brands are not combined.
- How concentrated are local HVAC contractor markets?
-
It varies widely. In 2025, the top five contractors accounted for 10% of contractor-identified permits in Tampa and 11% in Los Angeles, compared with 41% in Memphis and 54% in Las Vegas. These shares reflect contractor groupings in the dataset, not a complete analysis of corporate ownership.