

The California home is evolving. Policy changes, incentives, and cost dynamics are reshaping what gets installed, and what homeowners choose to skip.
To understand how those shifts are playing out, we analyzed trade permit trends across California jurisdictions where Shovels has consistent year-over-year coverage. Permits offer a direct view into what is actually being installed and upgraded, and how that mix is changing over time.
From what we've seen, the biggest shifts can be found in how homes source and use energy. Gas appliance permits declined steadily each year. Solar permits peaked in 2022, then fell sharply. Battery storage moved in the opposite direction, with strong growth over the same period, while heat pump permits nearly quadrupled.
These changes are not random. They line up with a set of major policy shifts, including the 2022 Title 24 building code update, the April 2023 NEM 3.0 solar tariff change, and federal tax incentives under the Inflation Reduction Act.
Methodology
We analyzed trade permit data across 213 California jurisdictions where Shovels has consistent year-over-year records. Permit counts are filtered by issue date, require a positive approval duration (approval date not null), and exclude inactive permits.
The data covers calendar years 2021 through 2025. Figures reflect directional trends across a large share of California's residential market and should not be treated as a precise count of total statewide activity.
Key Takeaways
- Solar permits peaked in 2022 and fell 32% in 2024 after NEM 3.0 cut export rates by roughly 75%
- Battery storage permits rose 157%, accelerating after NEM 3.0 made solar-plus-storage more attractive than solar alone
- EV charger permits doubled, anchored by Title 24's EV-ready circuit mandate for new construction
- Heat pump permits grew 230% from 2021 to 2025, driven by Title 24 code mandates and the IRA's Section 25C credit
- Gas appliance permits declined 20% over four years with no sign of reversal
Title 24: The Code That Pre-Wired the Transition
In 2022, California quietly updated its building code, laying the foundation for solar ramp-downs, EV charger growth, and other major trends in energy use. The 2022 Title 24 standards took effect January 1, 2023, and applied to all new residential construction permitted after that date. It was an update that set a new standard across the state:
- Solar panels became mandatory on new single-family homes (a requirement that had existed since the 2019 code, but was now coupled with battery-readiness wiring)
- EV-ready circuits became required in new construction garages
- Heat pump water heaters became the go-to appliance for domestic hot water
- New homes also needed to be "battery ready." They had to be wired and panel-sized to support future battery storage
The code didn't require homeowners to immediately install batteries or EV chargers, but it required that homes be ready for them. That distinction matters. As we will see, it created a wave of new construction equipped for electrification before incentives pushed homeowners to actually install the hardware.
Solar Permits Peaked in 2022, Then NEM 3.0 Hit
Solar permit volumes tell a clear before-and-after story. NEM 2.0 allowed solar owners to export excess power to the grid at near-retail rates. The replacement tariff, Net Billing (NEM 3.0), went live April 15, 2023, and cut those export rates by roughly 75%. We saw the impact of this switch clearly reflected in permit data.
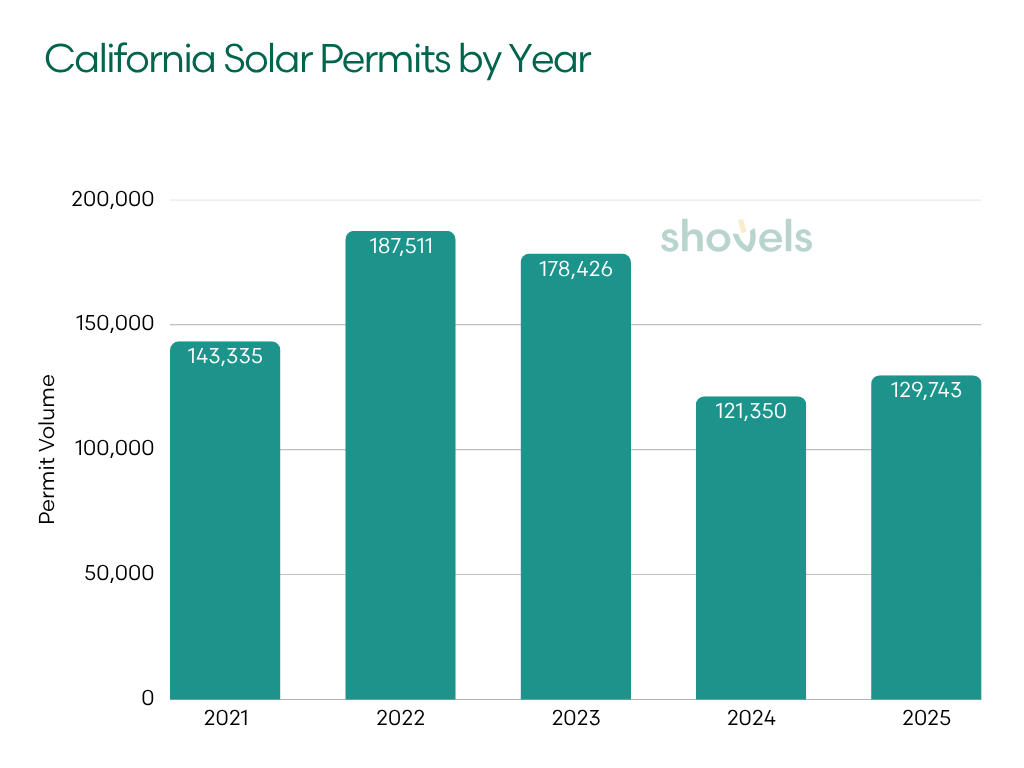
| Year | Solar Permits | YoY Change |
|---|---|---|
| 2021 | 143,335 | — |
| 2022 | 187,511 | +30.8% |
| 2023 | 178,426 | −4.8% |
| 2024 | 121,350 | −32.0% |
| 2025 | 129,743 | +6.9% |
The 2022 peak reflects a rush of homeowners (and installers) to lock in NEM 2.0 rates before the California Public Utilities Commission finalized the new tariff. The logic for a standalone solar installation weakened overnight.
Payback periods lengthened. New solar-only installs dropped sharply through 2023 and 2024. By 2025, volumes were 30.8% below the 2022 peak, though they showed a modest recovery from the 2024 trough.
We can see this play out in detail if we look at 2023 permit trends by month.
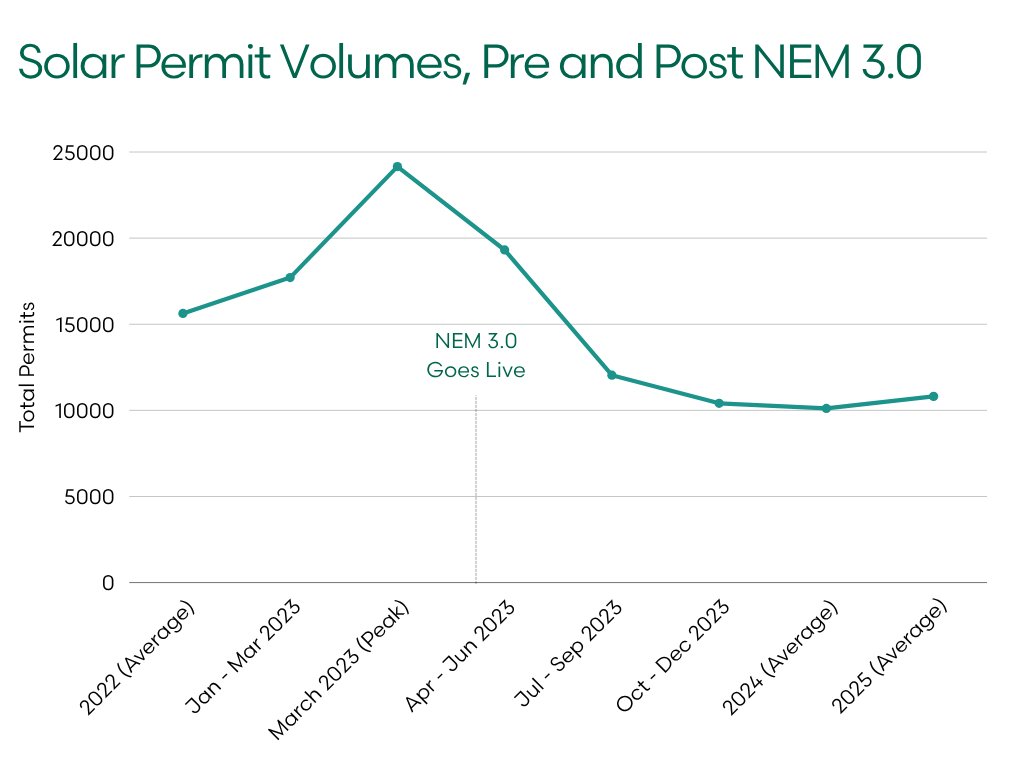
| Period | Avg Monthly Permits | Note |
|---|---|---|
| 2022 full year | ~15,626 | Baseline boom |
| 2023 Jan–Mar | ~17,710 | Pre-deadline rush |
| 2023 Mar (peak) | 24,155 | Highest single month in dataset |
| 2023 Apr–Jun | ~19,312 | Still elevated, permits filed before cutoff |
| 2023 Jul–Sep | ~12,044 | Cliff begins |
| 2023 Oct–Dec | ~10,410 | New normal emerges |
| 2024 full year | ~10,113 | Stabilized floor |
| 2025 full year | ~10,812 | Slight recovery |
March 2023 hit 24,155 permits, the highest single month in the dataset, as installers raced to file before the new tariff. April through June stayed elevated at around 19,300 per month as pre-cutoff applications cleared the queue. By July, volumes had fallen to roughly 12,000. By Q4, the new floor around 10,400 had set, and it held through all of 2024 and 2025.
But the NEM 3.0 story has a second chapter. The tariff was designed to make solar and battery storage more attractive than solar alone and from our perspective, that's exactly what happened.
NEM 3.0 Paved the Way for Battery Storage Growth
Under net billing, batteries let homeowners store solar energy for later use. Residential battery systems like a Tesla Powerwall or Enphase IQ Battery are typically wall-mounted in a garage or utility room. They store solar electricity generated during the day and discharge it during evening peak hours, keeping that energy out of the new, low-rate export market.
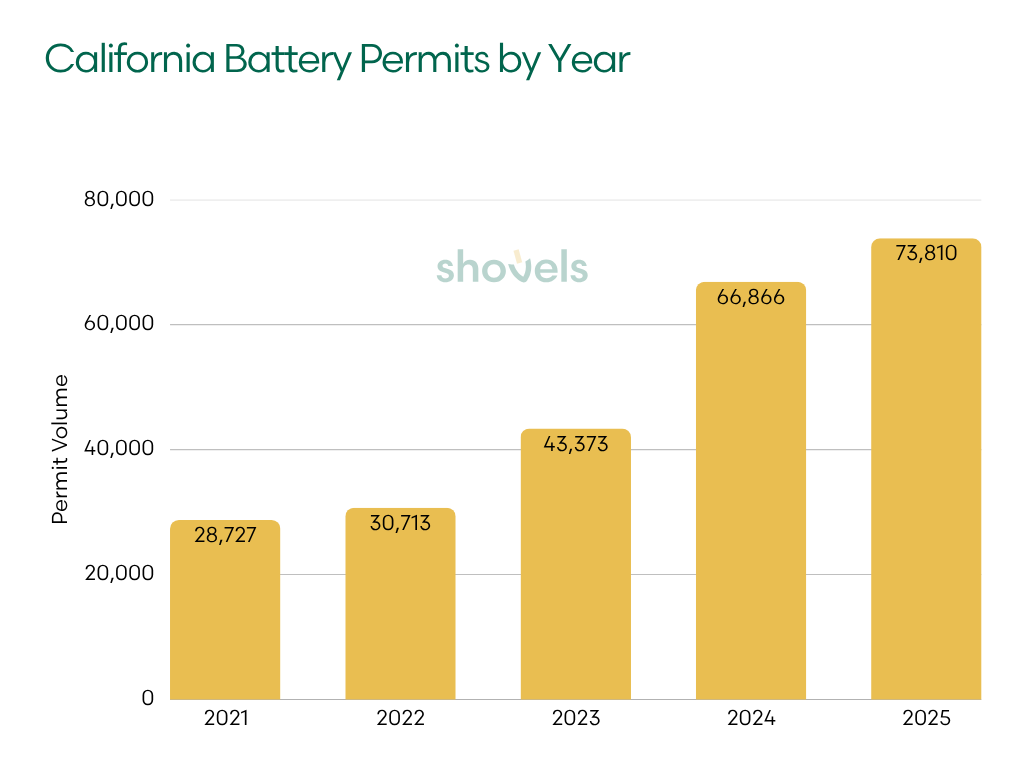
| Year | Battery Permits | YoY Change |
|---|---|---|
| 2021 | 28,727 | — |
| 2022 | 30,713 | +6.9% |
| 2023 | 43,373 | +41.2% |
| 2024 | 66,866 | +54.2% |
| 2025 | 73,810 | +6.7% |
The economics of solar with battery storage improved precisely as solar-only economics worsened. As a result, battery permit volumes shot up, growing 157% from 2021 to 2025. The sharpest jump (+54.2%) came in 2024, the year NEM 3.0 launched and the year that solar permits dropped.
Other incentives also played a role. The Self-Generation Incentive Program (SGIP), California's battery incentive program, ran throughout this period, though funding tiers quickly filled up. By late 2025, most residential SGIP equity offerings were exhausted in high-demand areas. However, homeowners are still able to take advantage of the federal Section 48 investment tax credit for standalone storage.
EV Chargers Doubled, But Incentives Are Winding Down
EV Permits also saw significant growth from 2021 to 2025. This increase tracks closely with California's growing EV adoption, spurred by several state-sponsored incentives.
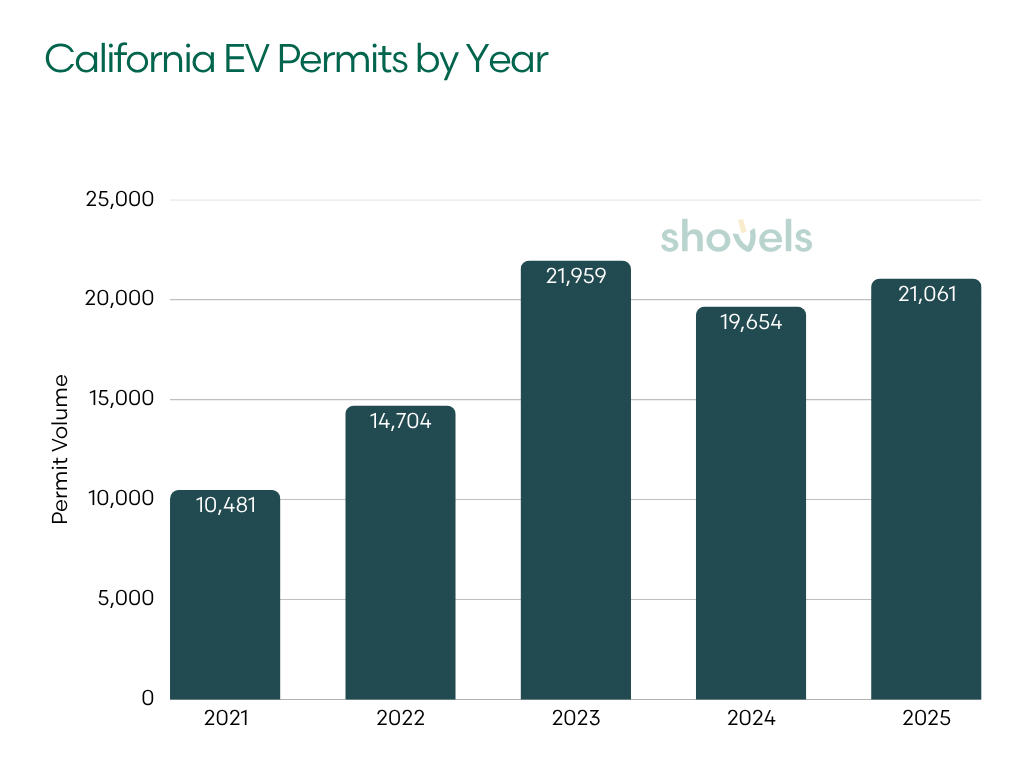
| Year | EV Charger Permits | YoY Change |
|---|---|---|
| 2021 | 10,481 | — |
| 2022 | 14,704 | +40.3% |
| 2023 | 21,959 | +49.3% |
| 2024 | 19,654 | −10.5% |
| 2025 | 21,061 | +6.0% |
Title 24's EV-ready circuit mandate for new construction created a pipeline of homes pre-wired for Level 2 charging. Many homeowners followed up with permitted charger installations once a vehicle was purchased. The Alternative Fuel Vehicle Rebate Project (AFVRP) and utility-funded EV charger rebate programs also fueled significant demand.
Additionally, the federal Section 30C credit (including 30% of installation cost, up to $1,000 for residential) is still active through June 30, 2026. If you're a homeowner planning a charging install, now is the time to take advantage.
Looking ahead, growth will likely decelerate as the market matures. The early-adopter wave has passed. But absolute volumes appear to be holding as long as EV registrations continue at steady rates.
Heat Pumps: The New Standard for California Energy
Heat pumps are electric appliances that move heat rather than burn fuel. They can be two to three times more efficient than combustion alternatives. Heat pump water heaters replace a traditional gas water heater in the utility closet or garage, and heat pump HVAC systems replace gas furnaces, supporting heating and cooling from an outdoor unit.
Their growth is one of the clearest signals in our permit dataset over the past five years.
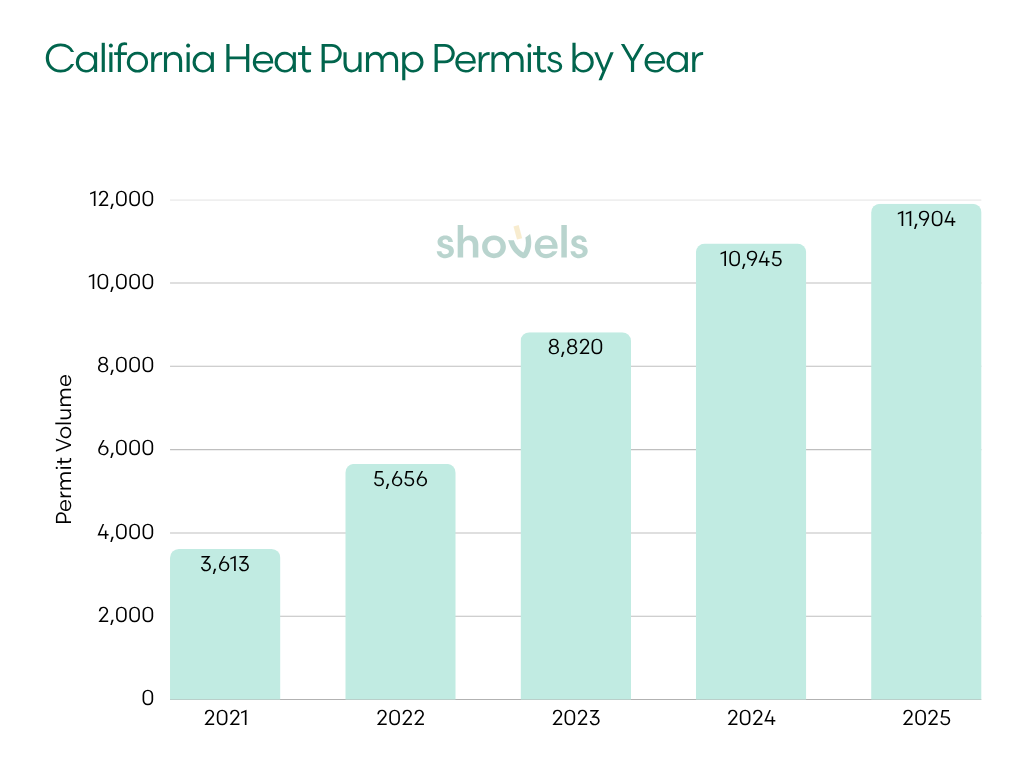
| Year | Heat Pump Permits | YoY Change |
|---|---|---|
| 2021 | 3,613 | — |
| 2022 | 5,656 | +56.5% |
| 2023 | 8,820 | +55.9% |
| 2024 | 10,945 | +24.1% |
| 2025 | 11,904 | +14.1% |
The number of heat pump permits increased 229.5% over four years, and from what we can tell, two policies are the engines behind this boom.
TECH Clean California offered rebates of up to $3,000 for heat pump HVAC systems and $1,000 for heat pump water heaters. The program ran from 2021 through late 2025, when it stopped accepting new applications.
The IRA's Section 25C credit gave homeowners a 30% federal tax credit (up to $2,000) for qualifying heat pump installations. This was available through December 31, 2025 before it was struck by the One Big Beautiful Bill Act. The deadline created a real end-of-year push, but the growth deceleration in 2025 (+8.8% vs. +24.1% in 2024) also tracks with those credits closing. The urgency was real while it lasted.
The Flip Side: Gas Permits Are Declining
Inevitably, as electrification categories grew, gas appliance permits moved in the other direction, posting a 20.4% decline over four years. This category covers permits for gas furnaces, water heaters, boilers, and ranges, the core combustion appliances in a typical California home.
This isn't just a construction cycle effect. HVAC permit volumes were nearly flat over the same period, a sign that total replacement activity held roughly steady. Homeowners replacing HVAC equipment increasingly chose heat pumps over gas furnaces and water heaters.
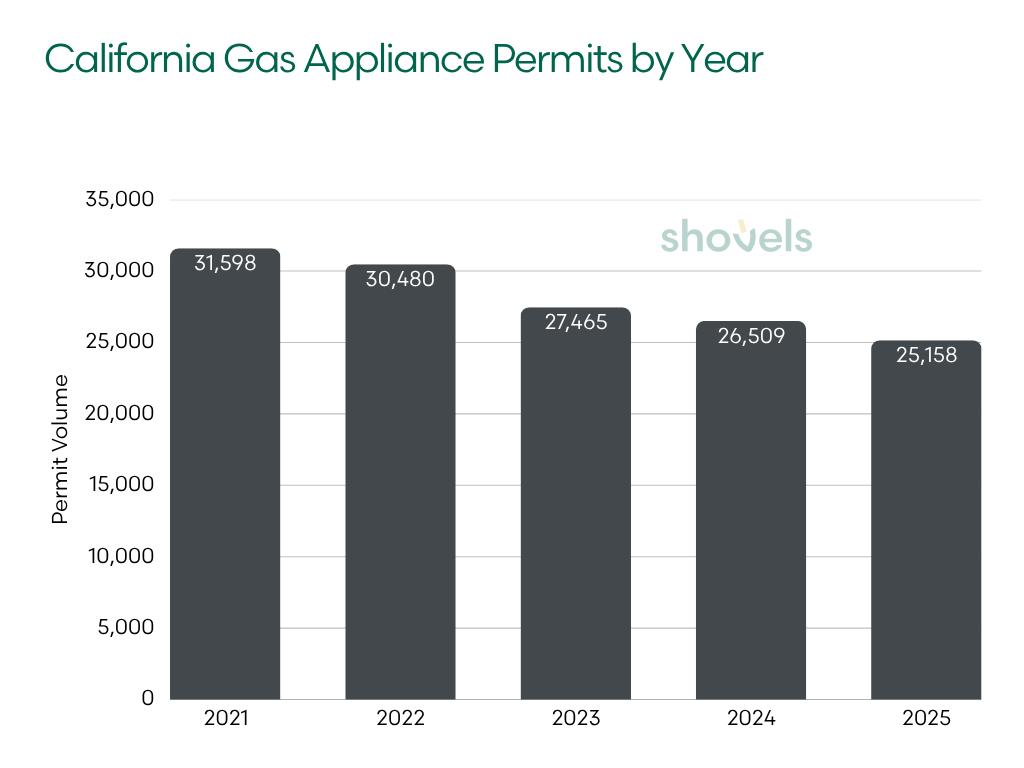
| Year | Gas Appliance Permits | YoY Change |
|---|---|---|
| 2021 | 31,598 | — |
| 2022 | 30,480 | −3.5% |
| 2023 | 27,465 | −9.9% |
| 2024 | 26,509 | −3.5% |
| 2025 | 25,158 | −7.1% |
The building electrification movement and local gas ban ordinances, most prominently Berkeley's 2019 ban (which inspired dozens of municipal follow-ons before facing federal court challenges), created tailwinds that show up directly in permit volumes.
One more data point worth flagging: ADU permits grew over the same time period. California's push to ease accessory dwelling unit construction (through AB 2221 and related bills) created a new category of housing stock built under 2022 Title 24 standards from day one. ADUs are disproportionately likely to be all-electric.
What This Means for the Vendors, Contractors, and Real Estate
The California home of 2026 runs differently than it did five years ago. Not in layout or size, but in what powers it. Heat pumps are replacing gas systems. EV chargers are standard. Solar, when installed, is increasingly paired with battery storage. These shifts are not incidental. They track directly to policy changes.
Their impact is also visible in the trades doing the work. For HVAC contractors and heat pump installers, this is a structural change, not a cycle. As systems age out, homeowners are choosing heat pumps by default.
For solar and storage companies, the market has split. NEM 3.0 did not end solar. It ended solar-only. Battery attachment rates have increased each year since the change, with growth shifting toward systems built for self-consumption rather than export.
At the construction level, the baseline has already moved. For builders and developers, homes permitted under 2022 Title 24 standards are typically pre-wired for EV charging, battery-ready, and built with heat pump systems. These are no longer upgrades.
That shift carries through to the resale market. For real estate platforms and agents, permit history is becoming a meaningful signal. Homes with heat pumps, battery storage, and EV chargers represent a different product.
If you'd like to dive into California permit data and see for yourself, you can sign up for an account directly. Or, if you have questions about how permit data can help your business, contact us.
Frequently Asked Questions
- What is California's Title 24 energy code and how does it affect home construction?
-
California's Title 24 building energy efficiency standards set minimum requirements for all new residential construction. The 2022 update, effective January 1, 2023, mandated solar panels, EV-ready circuits, heat pump water heaters, and battery-ready wiring on new single-family homes. These requirements created a generation of homes pre-equipped for electrification before homeowners installed the hardware.
- Why did California solar permits drop after 2022?
-
Solar permits peaked in 2022 as homeowners rushed to lock in NEM 2.0 export rates before they changed. When Net Billing (NEM 3.0) took effect April 15, 2023, it cut solar export rates by roughly 75%, lengthening payback periods for solar-only systems. Annual permit volumes fell 32% in 2024 and remain about 31% below the 2022 peak.
- How much have heat pump installations grown in California?
-
Heat pump permits grew 229.5% from 2021 to 2025, rising from 3,613 to 11,904 annually. Two policies drove most of this growth: TECH Clean California rebates (up to $3,000 for HVAC systems) and the IRA's Section 25C federal tax credit (30%, up to $2,000). The steepest growth years were 2022 and 2023, each posting roughly 56% year-over-year increases.
- What is driving battery storage permit growth in California?
-
Battery storage permits grew 157% from 2021 to 2025, with the sharpest acceleration coming after NEM 3.0 launched in 2023. The new tariff made solar-plus-storage significantly more attractive than solar alone, since stored energy avoids the low export rates. California's Self-Generation Incentive Program (SGIP) and the federal Section 48 investment tax credit provided additional financial incentives.
- How does Shovels track California energy permit trends?
-
Shovels analyzes trade permit records across 1,800+ jurisdictions nationwide, including 213 California jurisdictions with consistent year-over-year coverage. The dataset covers permit categories including solar, battery storage, EV chargers, heat pumps, and gas appliances, filtered for issued and approved permits. This gives contractors, investors, and policy analysts a ground-level view of what's actually being installed — not just what's being planned.