

When a homeowner renews their insurance policy, they're often asked a simple question: when was your roof last replaced? The answer, more often than not, is a guess.
Self-reported roof ages are notoriously unreliable. Homeowners don't remember. Properties change hands. And for commercial buildings, it's not clear who might know. Insurers have historically tackled the problem by dispatching field inspectors, scheduling aerial flyovers, or simply trusting what's on the application. Each approach has its limitations.
Building permit data offers something better: a dated, jurisdiction-issued record of when roofing work was performed, filed within days of the job. Across more than 4.6 million roofing permits issued between 2015 and 2025, we analyzed national trends in roofing activity, geographic concentration at the state and county level, storm-driven surges, metro-level roof age distributions, and the commercial versus residential dynamics that matter most to P&C underwriters. Here's what the data shows, and why it matters for underwriters, actuaries, and claims teams.
Key Takeaways
- Florida, California, and Colorado account for nearly 62% of all U.S. roofing permits. Normalized by households, Florida runs at nearly 12 permits per 1,000 households, roughly six times the national median, and Colorado follows at 10.18
- At the county level, roofing rates range from 62.51 permits per 1,000 households in Mesa County, CO to near zero in major urban markets. Storm geography is legible at the zip code level
- Permit volumes surge 2–4x in storm-affected regions within 60–90 days of major hail and hurricane events, creating a measurable post-disaster signal in near-real time
- In Florida, commercial roofing permits grew 157% since 2015 and held flat post-Ian. While residential fell 18%, commercial replacement has a longer post-storm tail that permit data uniquely captures
- Roofing permits reach jurisdiction databases within days of filing, versus aerial imagery that updates once or twice per year. For a roof replaced in June, permit data is available by July
The Problem Insurers Face When Tracking Roof Age
Property and casualty insurers have three tools for assessing roof age: ask the policyholder, send an inspector, or buy aerial imagery. Each method has its drawbacks.
Self-reported data is unreliable by design. Policyholders estimate. Sellers disclose what they know. When a property changes hands, the roof age resets in someone's memory, but not necessarily in reality. A 2015 roof sold with a 2022 home becomes a "four-year-old roof" when it's actually much older.
Physical inspections are expensive and slow. At the scale of a major carrier's book of business, for example evaluating permit data against 300,000-500,000 policyholder addresses, manual inspection is not a viable approach for routine underwriting.
 Image: aerial view of roofs in a neighborhood
Aerial imagery is the current industry standard for property condition assessment, and it works well for what it captures. But aerial programs typically fly over properties once or twice a year. As one insurer's chief data scientist explained it: "Aerial photos taken in March and August will miss a roof replaced in June. A permit doesn't."
What a Roofing Permit Actually Contains
A roofing permit is a legal document filed with a local building or permitting AHJ before roofing work begins. In jurisdictions with active permit programs, virtually all professional roofing jobs require one. The permit record captures:
- Address and parcel information — enabling matching to any property database
- Date fields — file date, issue date, and start date, providing a timeline of when work was performed
- Description of work — free-text scope including materials (composition shingles, TPO membrane, metal), method (tear-off or overlay), and job size in squares (1 square = 100 sq ft)
- Job value — the contractor's declared dollar value of the work
- Property attributes — year built, building area, property type (residential vs. commercial), owner information
- Contractor identity — licensed contractor who pulled the permit, linked to a national contractor database with license numbers, reviews, and permit history
The description field is particularly rich. Phrases like "tear off existing shingles to deck," "install new 30-year architectural shingles, 32 squares," and "underlayment: peel-and-stick" all confirm a full roof replacement and not a patch job. When that description is paired with a permit date, it becomes a derived "roof last replaced" field with genuine underwriting utility.
A roofing permit record might read:
Remove existing comp shingles. Install 30# felt, drip edge, and 40-year architectural shingles. 28 squares. Like for like. Tear-off: yes.
This single record tells an underwriter the roof was fully replaced, the approximate size, the material quality, and the date. For a $400,000 home in coastal Florida, that information makes a substantial impact.
Visit our data dictionary to learn more about the fields we capture and enrich.
The Scale of U.S. Roofing Activity
Between 2015 and 2025, Shovels identified more than 4.6 million roofing permits filed across the United States. That figure understates actual roofing activity: permit coverage varies by jurisdiction, and some markets have significant data gaps, but it represents the largest structured dataset of roofing permit records available at a national scale.
State-Level Concentration
Roofing activity is heavily concentrated in a handful of states driven by a combination of housing stock density, weather exposure, and permit compliance culture.
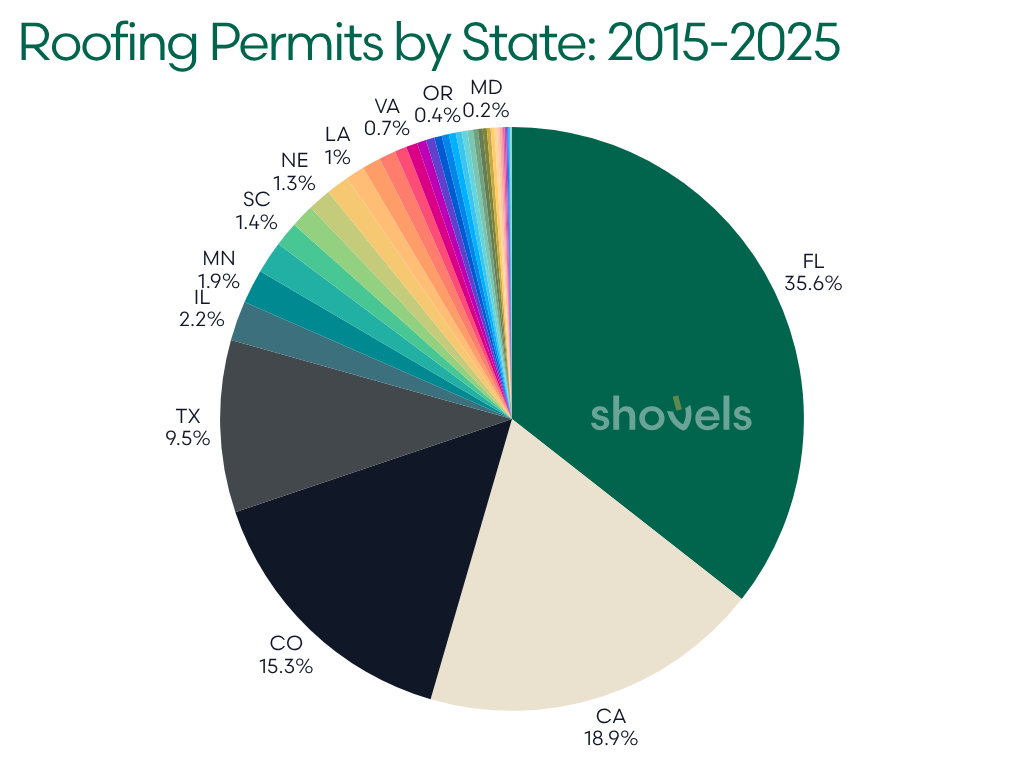
| State | Roofing Permits (2015–2025) |
|---|---|
| Florida | 1,334,878 |
| California | 709,666 |
| Colorado | 575,073 |
| Texas | 357,624 |
| Illinois | 82,337 |
| Minnesota | 71,043 |
| Indiana | 66,782 |
| South Carolina | 51,194 |
| Washington | 48,502 |
| Nebraska | 48,337 |
Florida, California, and Colorado alone represent about 62% of national volume. That concentration reflects two distinct dynamics: Florida and coastal states are driven by hurricane exposure and active replacement cycles; Colorado and the Great Plains states are driven by hail, where a single storm season can generate permit volumes 3–4x above baseline.
Roofing Activity Per Household: Normalizing for State Size
Raw permit counts favor large states. For example, California has 13 million households while Nebraska has fewer than 800,000. To understand which states genuinely have elevated roofing activity (versus which ones simply have more people) we normalized 2025 roofing permit counts against single-family household totals.
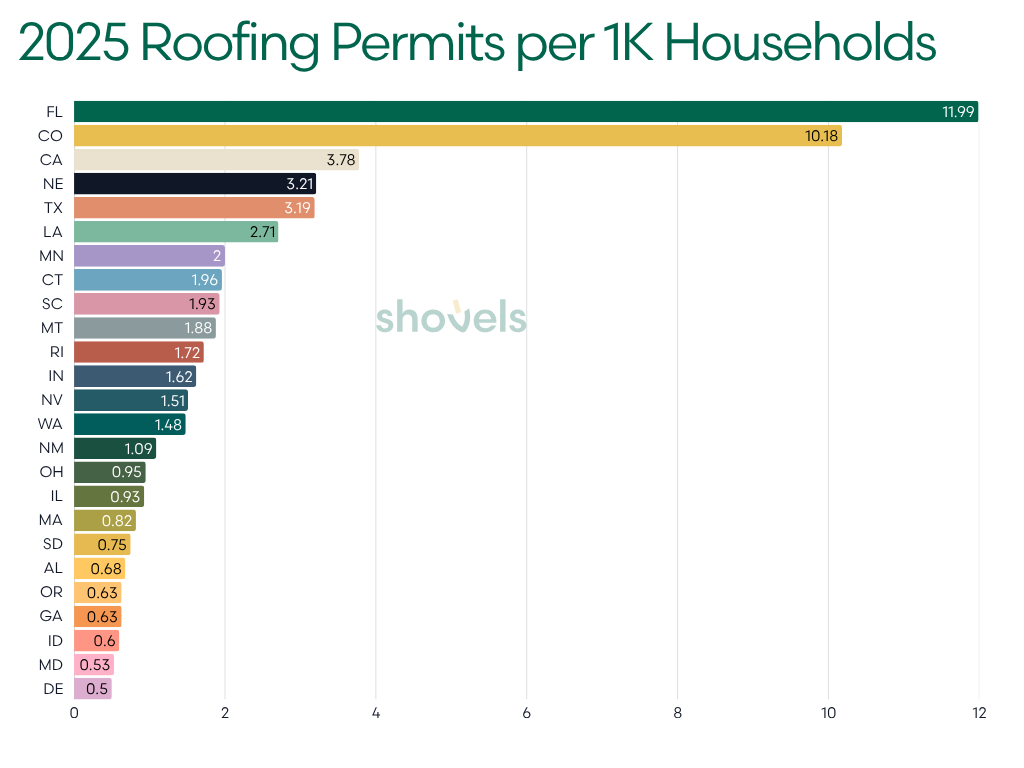
| State | Roofing Permits (2025) | Households | Per 1,000 HH |
|---|---|---|---|
| Florida | 102,497 | 8,550,911 | 11.99 |
| Colorado | 23,685 | 2,325,576 | 10.18 |
| California | 50,806 | 13,434,847 | 3.78 |
| Nebraska | 2,525 | 786,885 | 3.21 |
| Texas | 34,238 | 10,747,240 | 3.19 |
| Louisiana | 4,830 | 1,783,168 | 2.71 |
| Minnesota | 4,574 | 2,282,967 | 2.00 |
| Connecticut | 2,787 | 1,420,170 | 1.96 |
| South Carolina | 3,995 | 2,070,390 | 1.93 |
| Montana | 853 | 452,683 | 1.88 |
Florida and Colorado stand apart from the rest of the country. At nearly 12 permits per 1,000 households, Florida's roofing replacement rate is roughly six times the national median, a direct consequence of hurricane exposure, aging coastal housing stock, and insurance-market dynamics that actively incentivize roof replacement. Colorado's 10.18 rate reflects hail corridor volatility: even in a non-catastrophe year, the Front Range sees enough storm activity to sustain elevated replacement demand.
 Image: roof damaged by hail
The drop-off after Colorado is sharp. California, Nebraska, and Texas cluster between 3 and 4 roofing permits per 1K HH, meaningful activity, but driven by different forces (wildfire and coastal exposure in CA, hail in NE and TX). Most of the country falls well below 1 permit per 1,000 households.
States at the very bottom of the normalized ranking, New York (0.10), Michigan (0.07), Arizona (0.07), New Jersey (0.03), likely reflect permit data coverage gaps as much as actual low roofing activity. These are large, mature housing markets with active roofing industries. Their low rates are a signal to interpret carefully, not take at face value. For insurers using this data to assess portfolio exposure, high-rate states offer the most complete picture. Low-rate states warrant supplemental validation.
County-Level Concentration: Where Roofing Activity Peaks
The state-level picture flattens important variation. At the county level, the 2025 data reveals just how concentrated roofing activity is, and how clearly storm geography shapes it.
Interactive map: counties with high roofing permits per 1K homes
| County | State | Roofing Permits (2025) | Households | Per 1,000 HH |
|---|---|---|---|---|
| Mesa County | CO | 4,009 | 64,138 | 62.51 |
| Lubbock County | TX | 6,636 | 114,065 | 58.18 |
| Indian River County | FL | 3,786 | 68,605 | 55.19 |
| Hillsborough County | FL | 26,778 | 571,271 | 46.87 |
| Wichita County | TX | 1,904 | 40,834 | 46.63 |
| Manatee County | FL | 7,055 | 152,867 | 46.15 |
| Sarasota County | FL | 8,454 | 200,219 | 42.22 |
| Santa Rosa County | FL | 2,313 | 58,179 | 39.76 |
| Beltrami County | MN | 558 | 14,070 | 39.66 |
| Carver County | MN | 835 | 25,196 | 33.14 |
| Pasco County | FL | 6,448 | 198,267 | 32.52 |
| Martin County | FL | 2,177 | 68,018 | 32.01 |
| Potter County | TX | 2,005 | 62,658 | 32.00 |
| McLean County | IL | 637 | 19,933 | 31.96 |
| Walton County | FL | 872 | 30,339 | 28.74 |
The top of the list is split between two distinct storm regimes. Mesa County, Colorado (which includes Grand Junction), sits atop the ranking at 62.51 permits per 1,000 households, driven by hail exposure on the Western Slope. Lubbock County, Texas (58.18) and Wichita County, TX (46.63) are squarely in the southern plains hail corridor, where spring convective storms regularly produce damaging hail across densely populated areas.
Florida counties tell a different story. Indian River County (55.19), Manatee (46.15), Sarasota (42.22), and Hillsborough (46.87) all reflect the sustained post-Ian replacement wave that followed the 2022 hurricane season. Charlotte County (the county closest to Ian's Category 4 landfall) doesn't crack the top 15 in 2025 because that wave peaked in 2023; the replacement surge is still visible but has begun to normalize. The Florida Panhandle counties of Santa Rosa and Walton remain elevated from their own prior hurricane exposures.
The presence of Beltrami and Carver counties in Minnesota (both above 33 per 1,000) is a reminder that the upper Midwest hail belt, though less discussed than Colorado or Texas, drives consistent roofing demand. For insurers with Midwest commercial books, these county-level rates signal meaningful exposure that state-level averages obscure.
At the other end, major urban counties like Harris (Houston, 1.21), Travis (Austin, 0.35), and Maricopa (Phoenix, 0.12) show rates well below their storm exposure would suggest, a reflection of data coverage gaps in large, complex jurisdictions rather than genuinely low roofing activity.
Annual Trends: Storm Events Are Visible in the Data
On a recent podcast, Brad Jacobs (QXO CEO), lamented, "…bad weather is good weather for roofing." He was being interviewed about the recent $17B acquisition of TopBuild, a leading installer and distributor of insulation and building material products. There's no denying the storm effect on the demand for roofing goods and services.
National roofing permit volume grew steadily from 2015 to a peak in 2023, then moderated slightly in 2024 and 2025. But the trend line masks significant volatility driven by named storm events.
| Year | National Roofing Permits | Notable Events |
|---|---|---|
| 2015 | 405,626 | Record CO hail season |
| 2016 | 297,581 | Post-hail-spike normalization |
| 2017 | 374,802 | Hurricanes Harvey, Irma |
| 2018 | 365,202 | |
| 2019 | 344,968 | |
| 2020 | 356,773 | |
| 2021 | 426,750 | Post-COVID supply catch-up |
| 2022 | 476,304 | Hurricane Ian (FL, Oct) |
| 2023 | 584,551 | Peak year |
| 2024 | 534,653 | |
| 2025 | 515,860 |
Colorado's 2015 spike is the most dramatic example. The state issued nearly 198,000 roofing permits in a single year, more than four times its baseline, following a catastrophic spring hail season. Volume then collapsed as the backlog cleared.
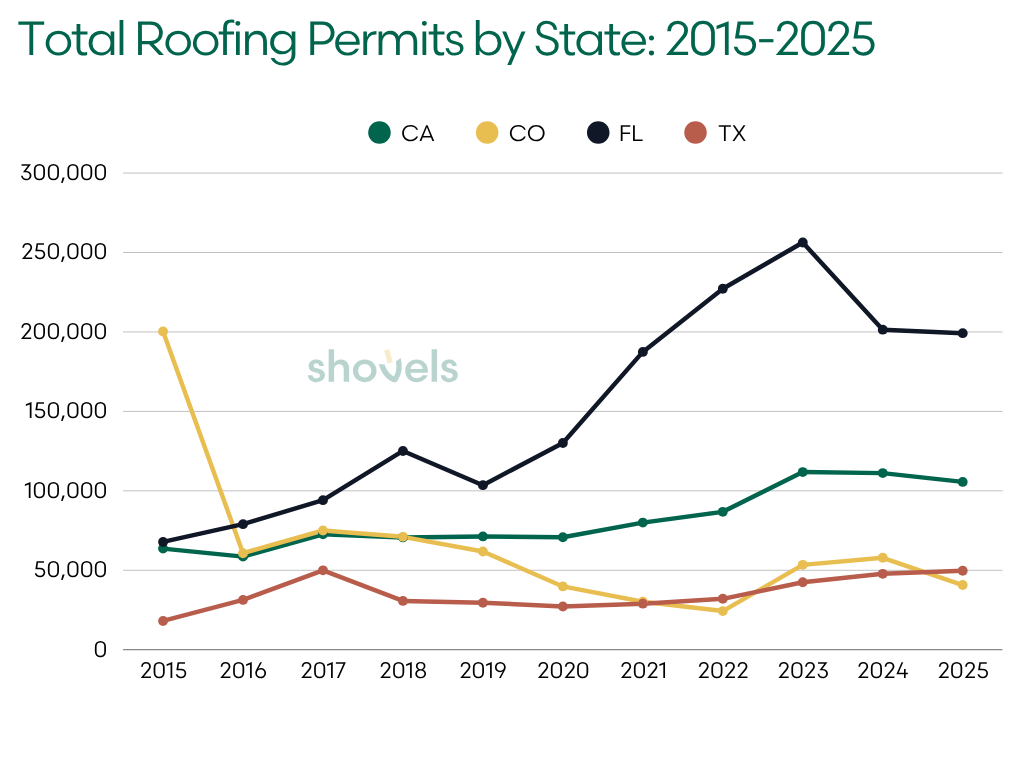
Florida's pattern is different. Rather than a single spike, the state has grown structurally, from 67,837 roofing permits in 2015 to 256,324 in 2023. Hurricane Irma (2017) and Hurricane Ian (2022) both produced visible bumps, but the underlying growth reflects Florida's expanding coastal housing stock, active insurance market, and state legislation that created incentives for roof replacement before the 15-year mark.
Seasonality: May Is the Peak Month for Roofing
Roofing permit volume follows a consistent seasonal pattern, peaking in May then, not surprisingly, hitting annual lows in January.
| Month | Avg. Monthly Permits |
|---|---|
| January | 227,642 |
| February | 228,100 |
| March | 280,653 |
| April | 299,946 |
| May | 459,980 |
| June | 322,512 |
| July | 324,215 |
| August | 346,851 |
| September | 340,581 |
| October | 346,736 |
| November | 272,162 |
| December | 220,600 |
May's permit volumes are roughly double January's. The pattern reflects spring storm season driving insurance claims, which convert to permits as contractors mobilize through the summer installation window. For insurers tracking claim-to-permit lag, the seasonal pattern is consistent and predictable.
Roofing Permits Reveal Roof Age — With High Confidence
The most direct insurance use case for roofing permit data is deriving a "roof last replaced" date. The methodology is straightforward:
- Match a policyholder or underwriting address to the permit database
- Identify all roofing permits at that address
- Filter for permits with full-replacement indicators (tear-off language, explicit square counts, material descriptions)
- Surface the most recent qualifying permit date as the derived roof age anchor
For addresses with a roofing permit on record, this produces a deterministic, jurisdiction-issued date, far more reliable than self-reported data. Contact our sales team if you'd like to learn more.
Shovels is SOC 2® Type II certified, learn more.
How Many Properties Have a Roofing Permit on Record?
Coverage varies significantly by market. In high-permit-compliance metros like Tampa and Denver, a substantial share of residential addresses have at least one roofing permit on record. In markets where permitting is less uniformly enforced, or where state data coverage is thinner, the no-permit share is higher.
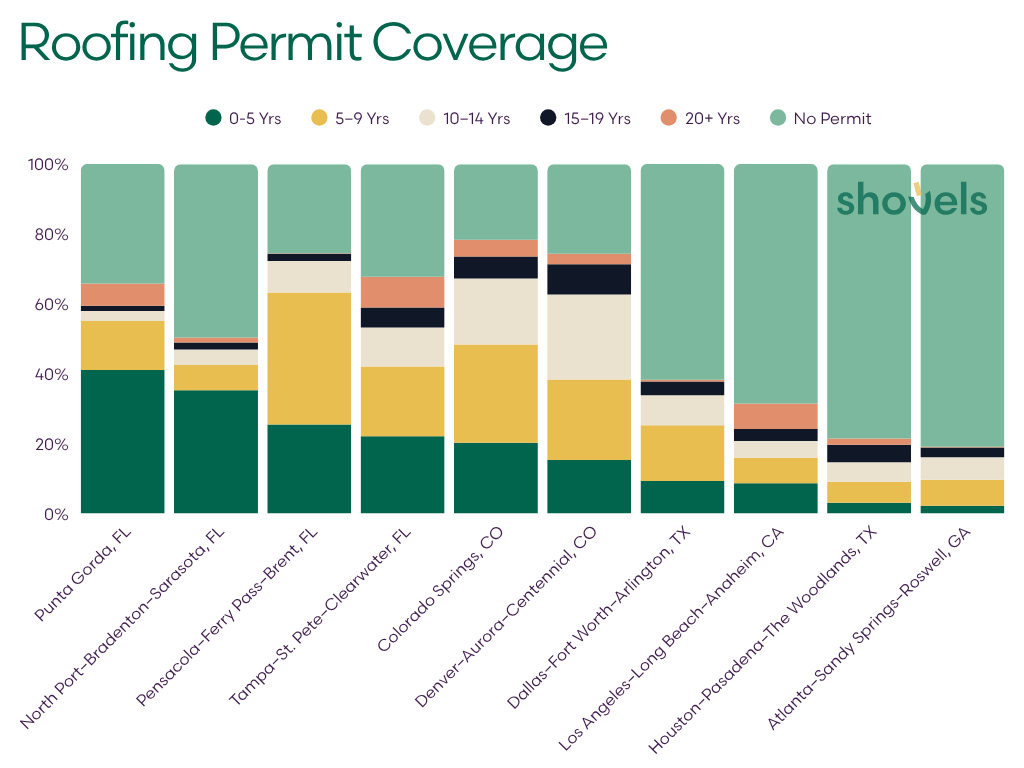
| Metro Area | Total Addresses | 0-5 Yrs | 5–9 Yrs | 10–14 Yrs | 15–19 Yrs | 20+ Yrs | No Permit |
|---|---|---|---|---|---|---|---|
| Punta Gorda, FL | 109,846 | 41.1% | 14.0% | 2.9% | 1.5% | 6.4% | 34.2% |
| North Port–Bradenton–Sarasota, FL | 108,728 | 35.3% | 7.2% | 4.5% | 2.0% | 1.4% | 49.6% |
| Pensacola–Ferry Pass–Brent, FL | 172,856 | 25.5% | 37.8% | 9.0% | 2.1% | 0.1% | 25.5% |
| Tampa–St. Pete–Clearwater, FL | 370,313 | 22.1% | 20.0% | 11.2% | 5.7% | 8.8% | 32.2% |
| Colorado Springs, CO | 267,744 | 20.3% | 28.1% | 18.9% | 6.3% | 4.8% | 21.6% |
| Denver–Aurora–Centennial, CO | 503,718 | 15.3% | 23.1% | 24.3% | 8.7% | 3.0% | 25.6% |
| Dallas–Fort Worth–Arlington, TX | 563,765 | 9.3% | 16.0% | 8.6% | 3.9% | 0.5% | 61.8% |
| Los Angeles–Long Beach–Anaheim, CA | 1,306,208 | 8.7% | 7.3% | 4.8% | 3.4% | 7.3% | 68.6% |
| Houston–Pasadena–The Woodlands, TX | 479,491 | 3.1% | 6.0% | 5.6% | 5.0% | 1.8% | 78.5% |
| Atlanta–Sandy Springs–Roswell, GA | 372,476 | 2.2% | 7.5% | 6.4% | 2.8% | 0.2% | 80.9% |
Florida markets show the deepest permit coverage and the youngest roof age distribution, a direct consequence of active hurricane-driven replacement cycles. Punta Gorda, the county seat of Charlotte County and ground zero for Hurricane Ian's Category 4 landfall, shows 41% of residential addresses with a roofing permit filed within the last five years. Notably, another 14% carry permits from the 5–9 year window, meaning more than half of all Punta Gorda addresses have a documented roofing event in the past decade. Pensacola (repeatedly impacted by Gulf storms) tells a similar story: 25.5% within five years and 37.8% in the 5–9 year cohort, driven by prior hurricane seasons that have kept the replacement cycle active across two successive windows.
Colorado Springs stands out as the highest-coverage non-Florida market at 20.3% within five years and 28.1% in the 5–9 year cohort. The high percentage of the 5–9 year bucket can be attributed to the lingering impact of heavy hail seasons between 2016–2019. Denver's distribution is notably spread across older cohorts (24.3% in the 10–14 year range) pointing to an earlier wave of hail-driven replacements that has aged into that bracket.
The "no permit" share tells the other side of the story. It ranges from a low of 21.6% in Colorado Springs to 80.9% in Atlanta and 78.5% in Houston, metros where data coverage gaps, not low roofing activity, likely drives the number. For insurers using this data to enrich a policyholder book, Florida and Colorado provide the most complete address-level picture. Large Sun Belt metros (Atlanta, Houston, Austin, Phoenix) have meaningful permit records but leave a large share of addresses unmatched, requiring supplemental validation or paired aerial imagery to fill the gap.
What Aerial Imagery Misses, and When It Matters Most
Aerial imagery is effective at detecting roof condition and, in some cases, recent replacement when visual characteristics change between capture dates. But aerial programs have a fundamental timing limitation: most providers capture imagery once or twice per year, with typical cycles running March–April and August–September.
That schedule creates a window of six to eight months during which a roof can be replaced without the change appearing in aerial data.
Consider a commercial property that had its flat roof replaced in June 2024. An insurer using aerial imagery would see the pre-replacement roof in their spring 2024 capture and the new roof in their fall 2024 capture, but with no way to pin the date of replacement without a permit record. The underwriter is left uncertain whether the "new" roof they see in September is three months old or three years old.
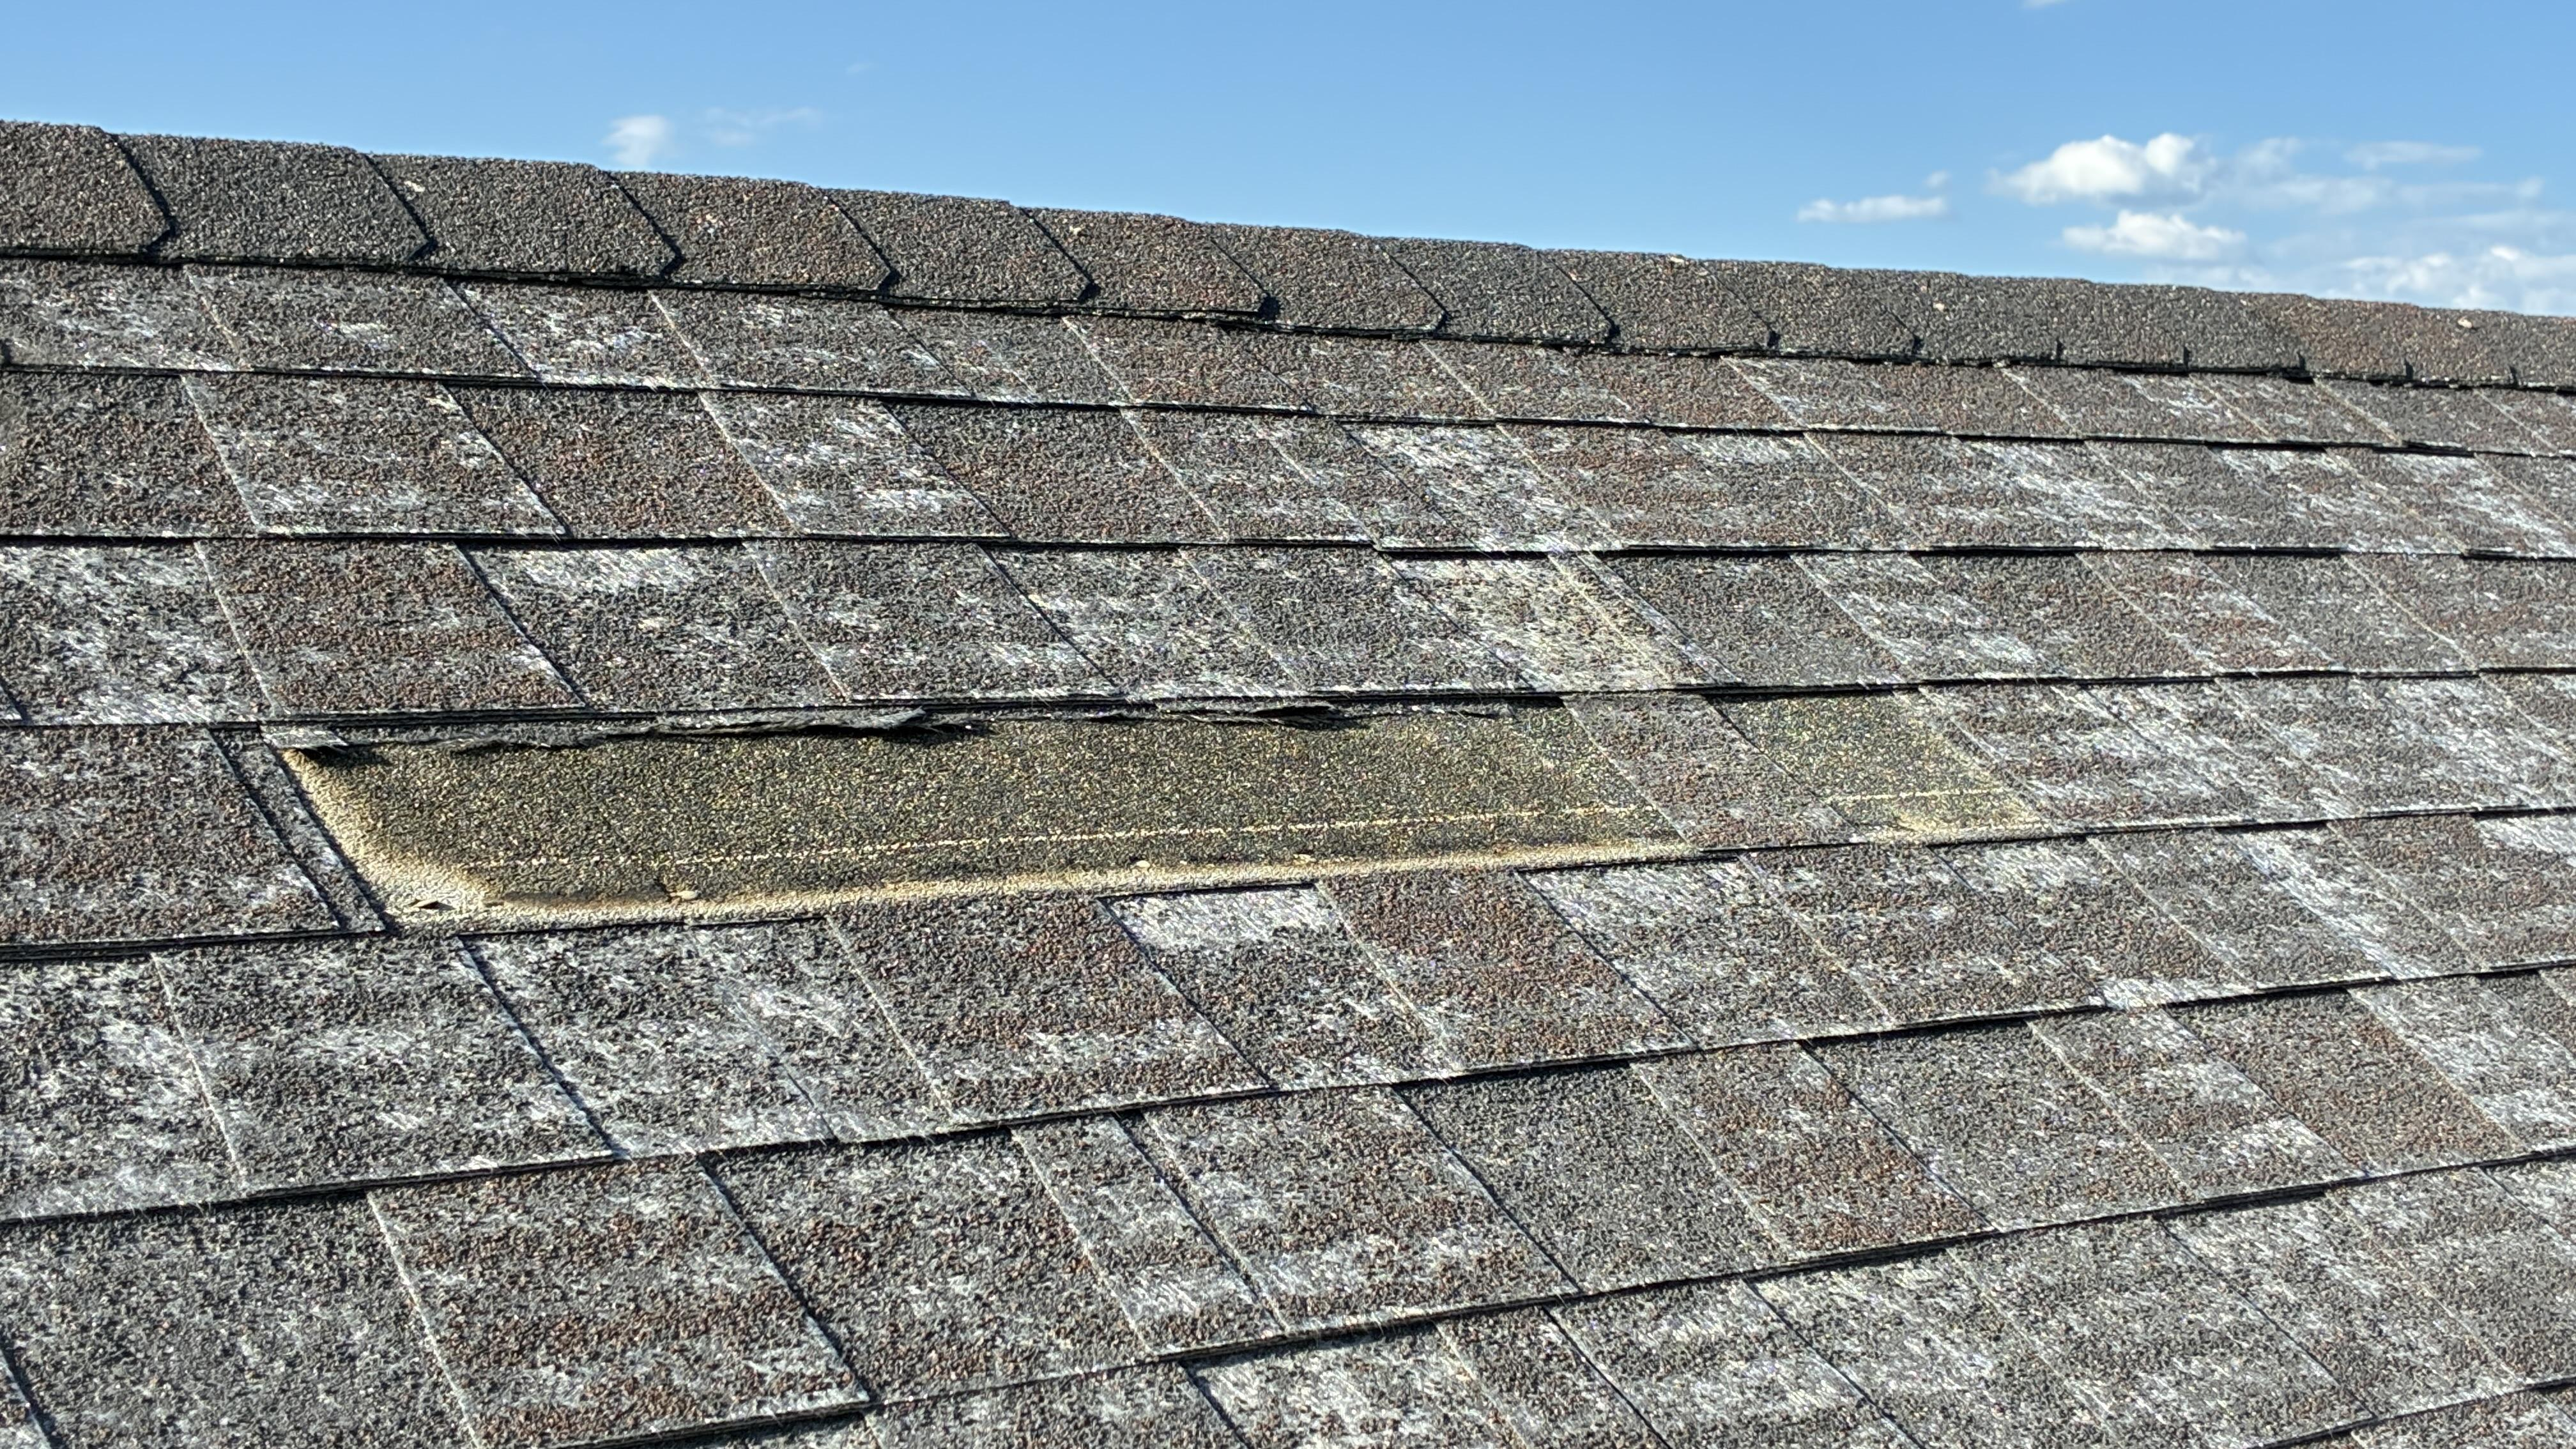 Image: old shingle roof needing replacement
For property and casualty underwriting, where a 10-year-old roof and a 3-year-old roof carry meaningfully different risk profiles, that uncertainty is material.
Permit data fills this gap with a dated record filed at the time of work. The typical timeline: a roofing contractor pulls a permit before work begins, work is performed, and the permit is inspected and finalized within days to weeks. Shovels currently refreshes its permit database every two weeks (with a goal of increasing cadence), meaning a roof replaced in early June is typically visible in the dataset by late June or early July, within the same month, not the following quarter.
Storm Response Patterns Are Measurable in the Data
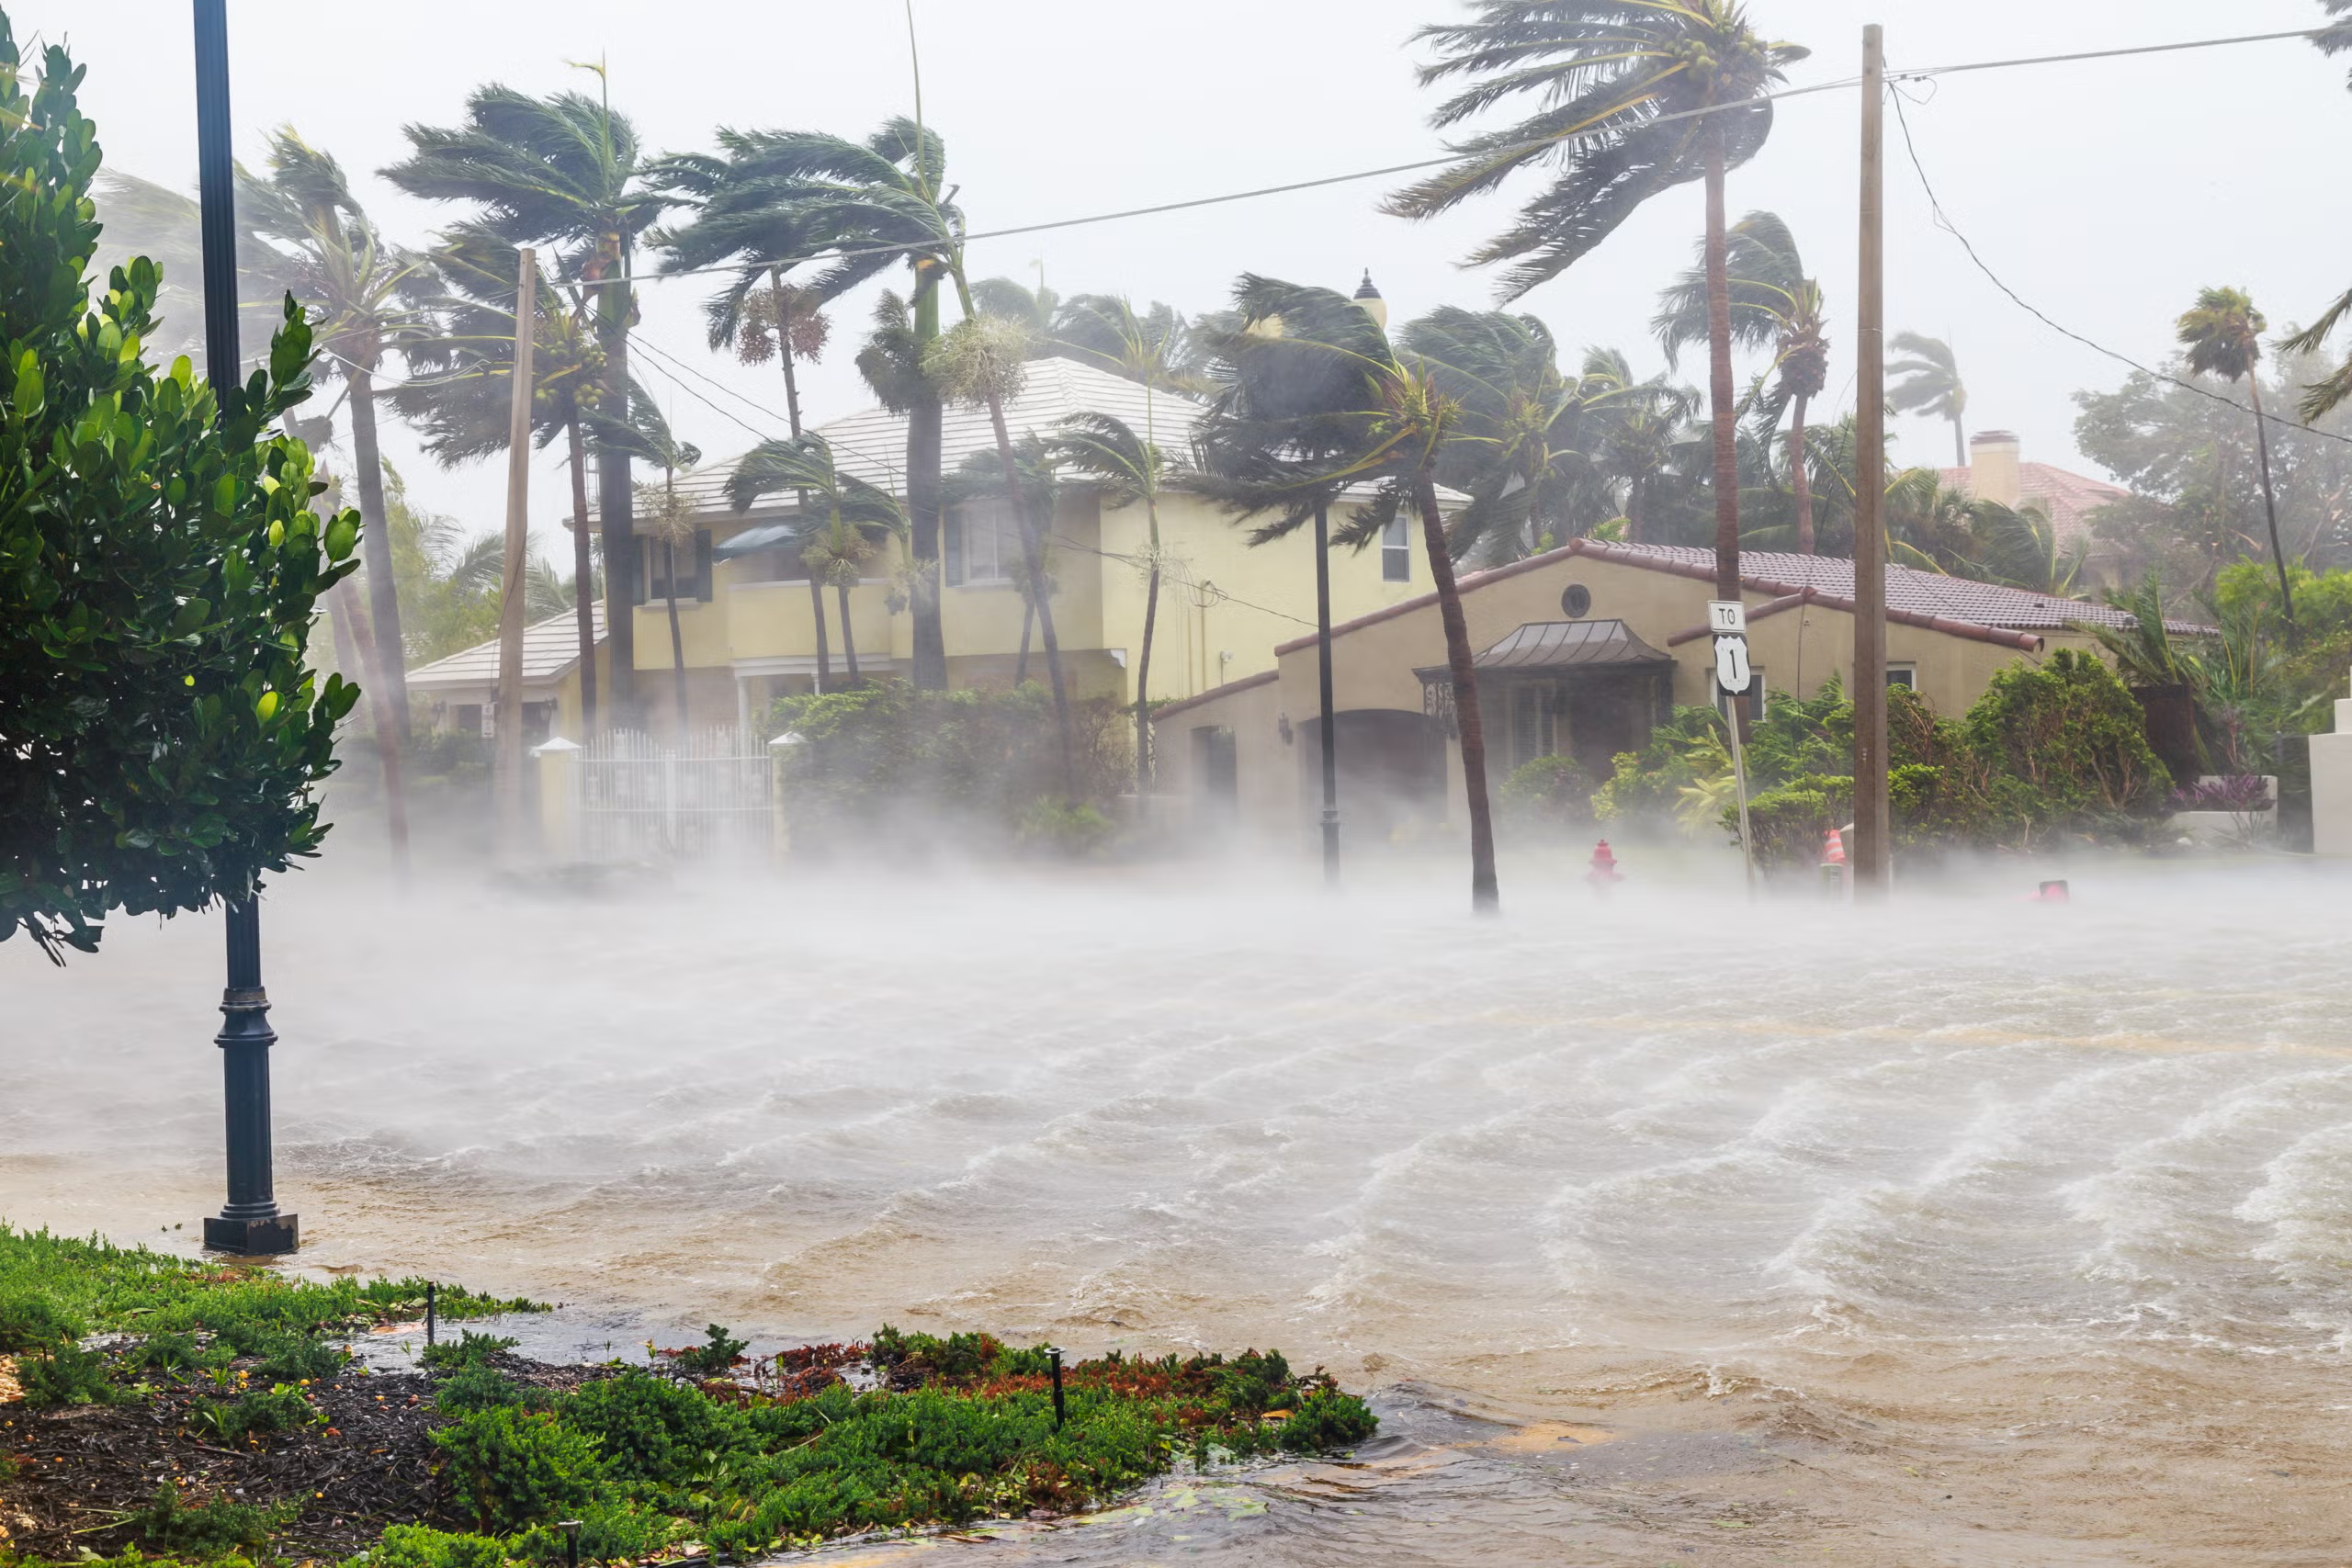 Image: hurricane wind damaging houses
Insurers focused on catastrophe modeling and storm corridor underwriting can use permit data to quantify post-event roofing activity in near-real time. The signal is consistent and large.
Colorado — 2015 Hail Season: Colorado issued 200,251 roofing permits in 2015, compared to a baseline of roughly 49,000. The surge was concentrated in the Denver and Colorado Springs metro areas following a series of hail events that caused an estimated $3 billion in insured losses. Permit volume collapsed the following year as the backlog cleared.
Texas — 2017 Hurricane Harvey: Texas roofing permits jumped from 31,356 in 2016 to 49,957 in 2017, with a disproportionate surge in Harris County (Houston metro) in the months immediately following Harvey's landfall. The permit data captures not just the volume but the geography — making it possible to identify which specific counties were most affected by roofing activity, down to the zip code level.
Florida — 2022 Hurricane Ian: Ian made landfall in Lee County on September 28, 2022, as a Category 4 storm. Charlotte County, directly in the storm's path, went from roughly 4,200 roofing permits in the 12 months preceding Ian to more than 64,000 in the following 36 months, a 15-fold increase. Lee County, Sarasota, and Manatee show similar, though less extreme, post-Ian surges visible in the permit data.
The ability to observe post-storm permit surges by geography has two distinct insurance applications: claims validation (confirming that roofing work did or didn't occur at a specific address after a storm event) and portfolio risk monitoring (identifying concentrations of aging roofs in storm-exposed regions before the next event).
For comprehensive analysis on post disaster relief through the lens of permits, read our posts When Disaster Strikes: What Permit Data Reveals About Hurricane Recovery (including hurricane Ian) and LA Wildfires Recovery: What the Permit Record Shows
How Quickly Do Roofs Get Replaced After a Storm?
Permit duration data shows how long the replacement process takes once the permit is filed: from approval to completion. Median construction durations vary significantly by geography and likely reflect both local contractor capacity and storm-driven backlog.
| State | Roofing Permits (since 2021) | Median Construction Duration |
|---|---|---|
| Florida | 1,114,010 | 34 days |
| California | 521,119 | 34 days |
| Colorado | 214,219 | 43 days |
| Texas | 207,063 | 50 days |
| Minnesota | 80,503 | 51 days |
| Washington | 37,092 | 63 days |
In Florida counties hit hardest by Ian (Lee, Charlotte, Sarasota) construction durations extended substantially post-storm, reflecting contractor capacity constraints. Pinellas County shows a 184-day median construction duration and Escambia County (Pensacola) shows 169 days, likely reflecting hurricane-driven backlogs and permit staffing limits at the jurisdiction level.
Commercial Roofing: A Distinct and Usable Dataset
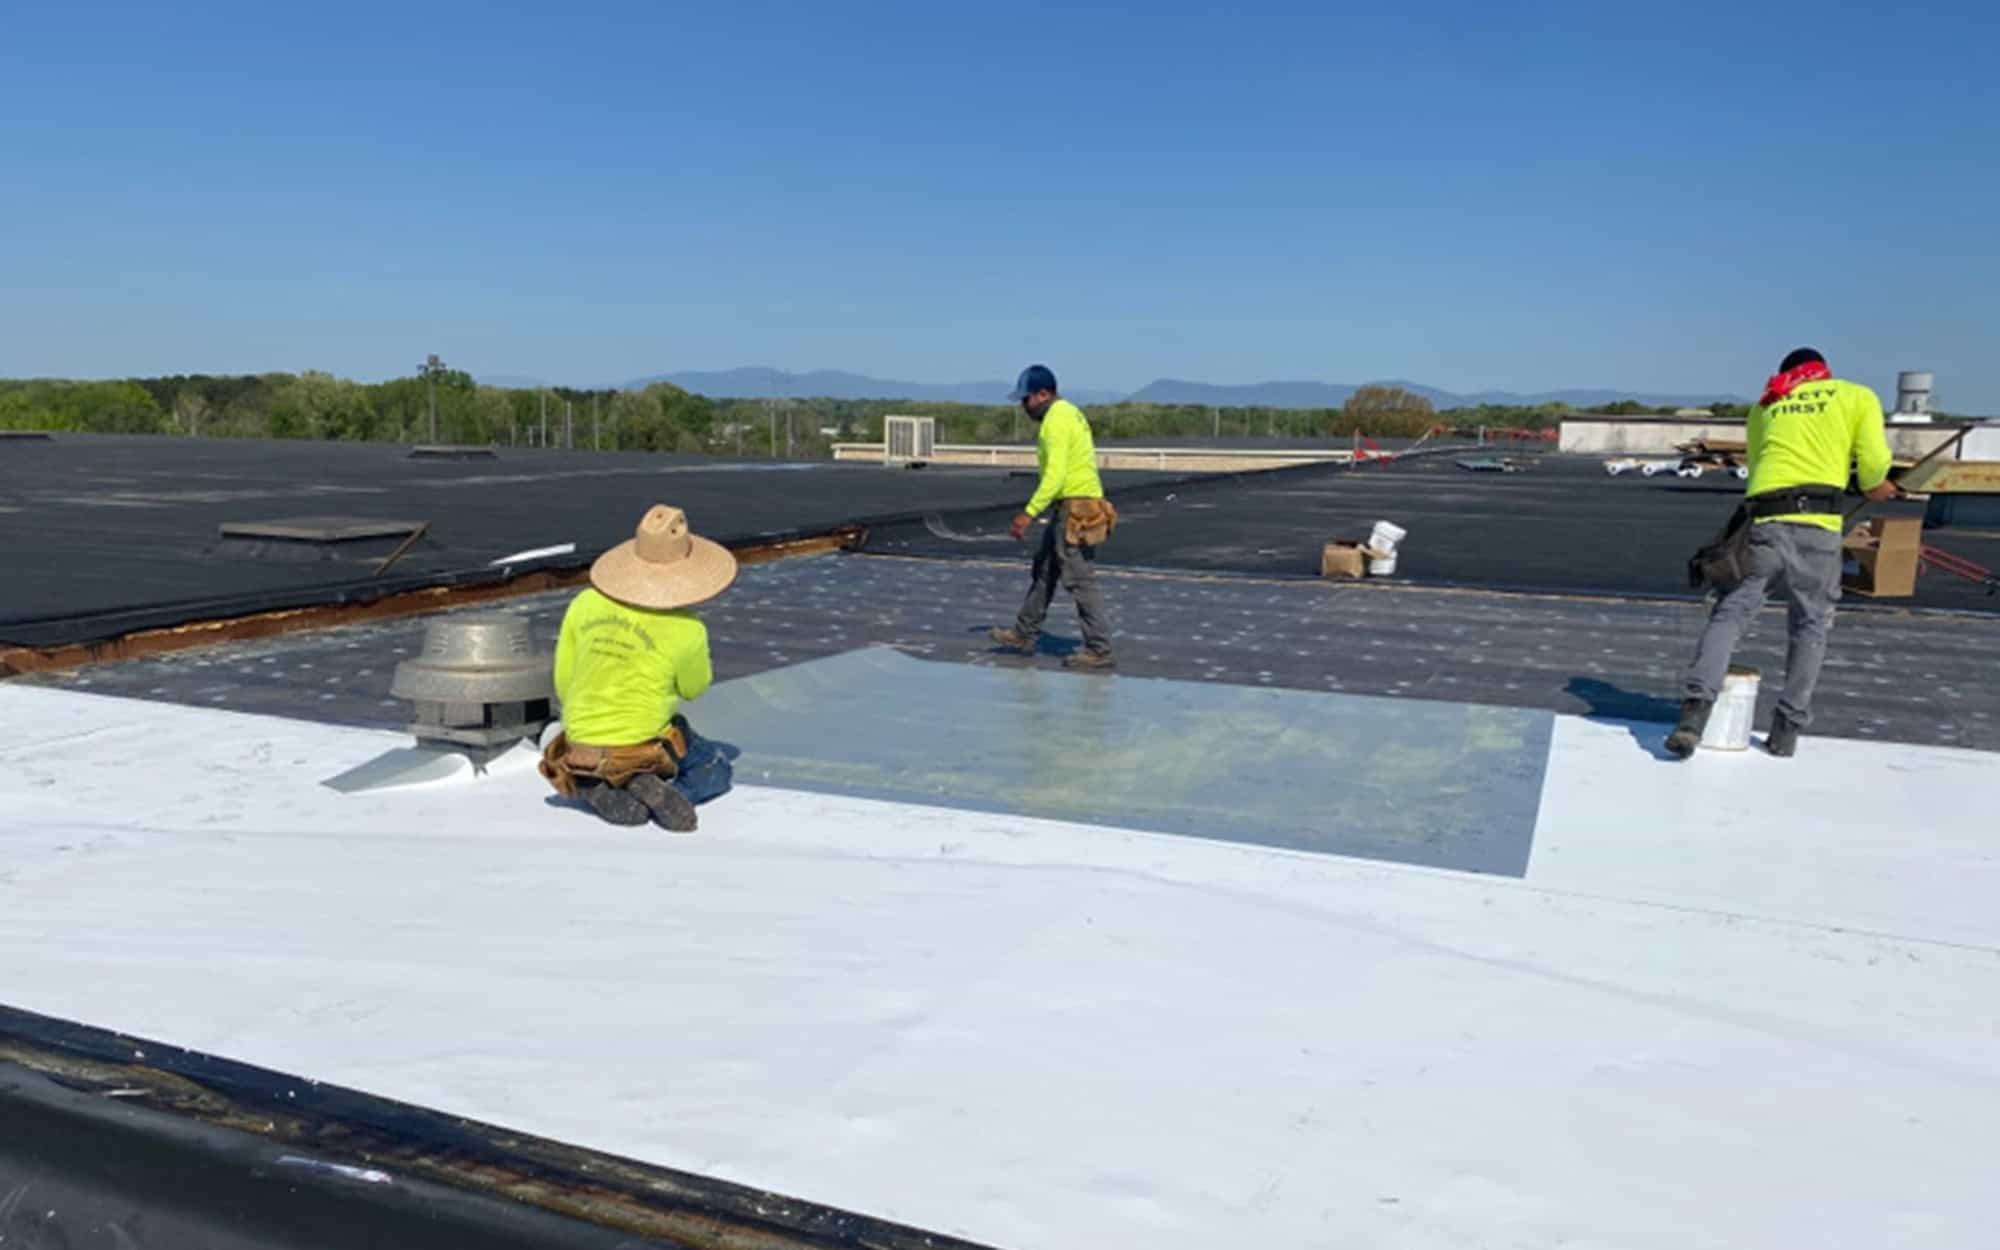 Image: commercial roofing installation in progress
Commercial roofing permits are a subset within roofing data, but they behave differently. Across the national dataset, roughly 8–10% of roofing permits are classified as commercial property. Commercial permits tend to involve larger job values, longer construction timelines, and distinct materials: flat roof membrane systems (TPO, EPDM, modified bitumen) rather than the asphalt shingles that dominate residential work. These material signals in the permit description are reliable markers for commercial use when the property type field alone is insufficient.
For commercial underwriters, who don't insure residential properties at all, permit data is particularly valuable because commercial building stock has far less public data infrastructure around it than residential does. Aerial programs cover commercial properties inconsistently. Property assessors record commercial data less uniformly than residential. Permit records, by contrast, apply equally to both.
The national commercial roofing permit dataset covers all 50 states with meaningful volume in Florida, Texas, California, Illinois, Minnesota, and the Carolinas, covering the major commercial property markets where storm exposure is highest.
Florida: A Case Study in Commercial vs. Residential Replacement Cycles
Florida offers the clearest view of how commercial and residential roofing activity diverge, both in volume and in timing. The state's permit data shows two parallel but distinct replacement cycles playing out over the past decade.
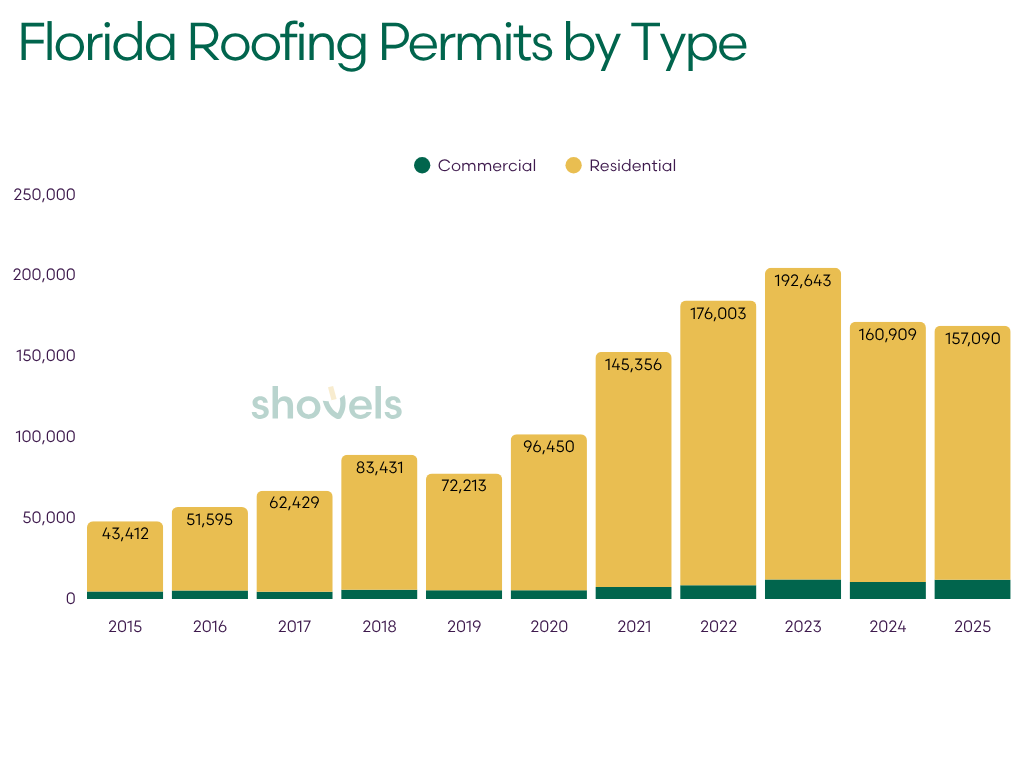
| Year | Residential | Commercial | Total | Commercial Share |
|---|---|---|---|---|
| 2015 | 43,412 | 4,606 | 48,595 | 9.5% |
| 2016 | 51,595 | 5,282 | 57,555 | 9.2% |
| 2017 | 62,429 | 4,551 | 67,758 | 6.7% |
| 2018 | 83,431 | 5,795 | 90,144 | 6.4% |
| 2019 | 72,213 | 5,424 | 78,357 | 6.9% |
| 2020 | 96,450 | 5,398 | 102,763 | 5.3% |
| 2021 | 145,356 | 7,397 | 153,960 | 4.8% |
| 2022 | 176,003 | 8,560 | 185,681 | 4.6% |
| 2023 | 192,643 | 12,086 | 206,467 | 5.9% |
| 2024 | 160,909 | 10,494 | 173,015 | 6.1% |
| 2025 | 157,090 | 11,841 | 170,583 | 6.9% |
Two things stand out. First, commercial volume has grown 157% since 2015, from 4,606 to 11,841 permits, on its own trajectory, not simply tracking residential. Second, and more relevant for commercial underwriters: commercial held firm while residential pulled back. Residential peaked at 192,643 permits in 2023 and fell 18% by 2025. Commercial peaked at 12,086 in 2023 and is essentially flat (-2%) through 2025.
This divergence reflects the structural difference between residential and commercial replacement timelines. Homeowners act quickly after a storm, insurance claims are filed, contractors are hired, and permits are pulled within weeks. Commercial properties move more slowly: lease agreements complicate scope decisions, insurance negotiations for large roofs take longer, and projects involving flat membrane systems require more planning. The result is a longer post-storm tail for commercial, visible in the data as a sustained plateau rather than the sharp peak-and-decline seen on the residential side.
For commercial P&C underwriters assessing Florida exposure, this has a direct implication: the post-Ian replacement wave is not over for commercial roofs in the same way it is for residential. Permit data is the only reliable way to know which specific commercial properties have completed replacement and which have not.
What's Inside a Permit Beyond the Date
Roof age is the primary ask from insurance prospects, but the permit record contains additional metadata that opens more advanced underwriting applications.
Materials and Quality Tier: Commercial and residential permits often include explicit material references. "30-year architectural shingles" versus "20-year 3-tab" indicates a different replacement cycle expectation. Metal roofing installations carry significantly longer lifespans than composition shingles. Tile reroof permits in coastal Florida often distinguish between tile reset (underlayment replacement only) and full tile replacement, a meaningful risk distinction.
Contractor Identity: Every permit includes the licensed contractor who performed the work. Shovels links these permit records to a national contractor database with license numbers, permit history, review data, and geographic coverage. Contractor quality is a proxy for installation quality. High-volume, locally licensed contractors with consistent jurisdictional histories are more reliable signals than out-of-state contractors who appear in a geography only after storm events (a classic storm-chaser pattern).
Co-Occurring Work: Roofing permits frequently co-occur with solar installations, HVAC replacements, and fire sprinkler upgrades. These combinations, visible through Shovels' AI-derived tags, provide a richer picture of the property's overall maintenance profile than any single permit in isolation.
Permit Frequency: Multiple roofing permits at a single address within a short window (for example, two permits within five years in a non-storm area) may indicate chronic installation issues, insurance-driven over-replacement, or a property that's more exposed to severe weather than its geography would suggest.
Conclusion: Permit Data as a Ground-Truth Layer
Esri interactive map: Nationwide Roofing Permits (Q1 2026)
The roofing data problem for insurers isn't a lack of data. It's a lack of dated, address-level, verifiable data. Self-reported ages are estimates. Aerial imagery has timing gaps. Manual inspection doesn't scale.
Building permit records provide the ground-truth layer that closes these gaps: a jurisdiction-issued date tied to a specific address, filed within days of the work, available at national scale, and rich with metadata that goes well beyond the date.
The data in this report makes the geographic and structural dimensions of that value concrete. Florida runs at nearly 12 roofing permits per 1,000 households, six times the national median, with individual counties like Indian River and Hillsborough exceeding 46 per 1,000. In high-activity markets like Tampa and Colorado Springs, more than 75% of residential addresses have at least one roofing permit on record, giving insurers a dense, matchable dataset for portfolio enrichment.
For commercial underwriters specifically, Florida's permit data shows something aerial imagery cannot: that commercial roof replacement has its own post-storm trajectory, lagging residential by years rather than months. The post-Ian commercial wave in Florida is still visible in 2025 data. Knowing which commercial properties have completed replacement (and which have not) is a question only permit data can answer definitively.
For carriers evaluating roof age at the portfolio level, permit data enables systematic enrichment of policyholder addresses. For underwriters assessing individual commercial properties, it provides the deterministic record that replaces manual calls to building departments. For catastrophe modelers, it produces a measurable post-storm signal within weeks of a major event, not months.
The question isn't whether permit data belongs in property risk assessment. It's whether your organization is using it yet.
Frequently Asked Questions
How does Shovels determine roof age from permit data?
Shovels matches a property address to its roofing permit history, then filters for permits with full-replacement indicators — tear-off language, explicit square counts, and material descriptions. The most recent qualifying permit date becomes a derived "roof last replaced" anchor. For addresses with a permit on record, this produces a deterministic, jurisdiction-issued date that is far more reliable than self-reported data.
What states have the highest roofing permit activity per household?
Florida and Colorado lead the nation by a wide margin. Florida runs at nearly 12 roofing permits per 1,000 households — roughly six times the national median — driven by hurricane exposure and insurance-market dynamics. Colorado follows at 10.18 per 1,000 households, reflecting persistent hail activity on the Front Range. Most of the country falls well below 1 permit per 1,000 households.
How quickly does roofing permit data appear after a storm event?
Permit data typically becomes available within weeks of the roofing work, not months. A roofing contractor pulls a permit before work begins, the job is completed and inspected, and the record enters the jurisdiction's database within days. Shovels currently refreshes its permit database every two weeks, meaning a roof replaced in early June is typically visible in the dataset by late June or early July.
How does commercial roofing data differ from residential for insurance purposes?
Commercial roofing permits involve larger job values, longer construction timelines, and distinct materials such as TPO, EPDM, and modified bitumen membrane systems. After a major storm, commercial replacement follows a longer tail than residential — in Florida, residential permits peaked in 2023 and fell 18% by 2025, while commercial held essentially flat through the same period. Permit data is the only reliable way to identify which specific commercial properties have completed post-storm replacement.
How much of the U.S. has roofing permit coverage?
Coverage varies significantly by market. In high-compliance metros like Tampa and Colorado Springs, over 75% of residential addresses have at least one roofing permit on record. Markets with data coverage gaps — including Houston (78.5% no-permit), Atlanta (80.9% no-permit), and Los Angeles (68.6% no-permit) — reflect jurisdictional reporting inconsistencies rather than genuinely low roofing activity. Shovels covers 1,800+ jurisdictions across the United States.
Shovels maintains a national database of building permit records, currently refreshed every two weeks, covering permits filed across 1,800+ (and growing) jurisdictions across the United States. Roofing activity is identified using a model-derived boolean tag validated against permit description text. Data analyzed in this report covers permits with recorded start dates between January 1, 2015 and December 31, 2025 unless otherwise noted.
Shovels data is accessible through Shovels Online, API, or Enterprise Data License, whatever fits your workflow. Start exploring roofing permits now, or contact us to learn more about how we can help.