

America's largest homebuilders are concentrating new construction in some of the country's most heat-exposed markets. To take a closer look at these and other climate-related risks, Shovels partnered with ClimateCheck to match new-construction permits from the top 50 builders to ZIP-level hazard data.
We analyzed six hazards: heat, extreme precipitation, drought, wildfire, flood, and tornado activity, to see where each builder's construction footprint is more or less exposed.
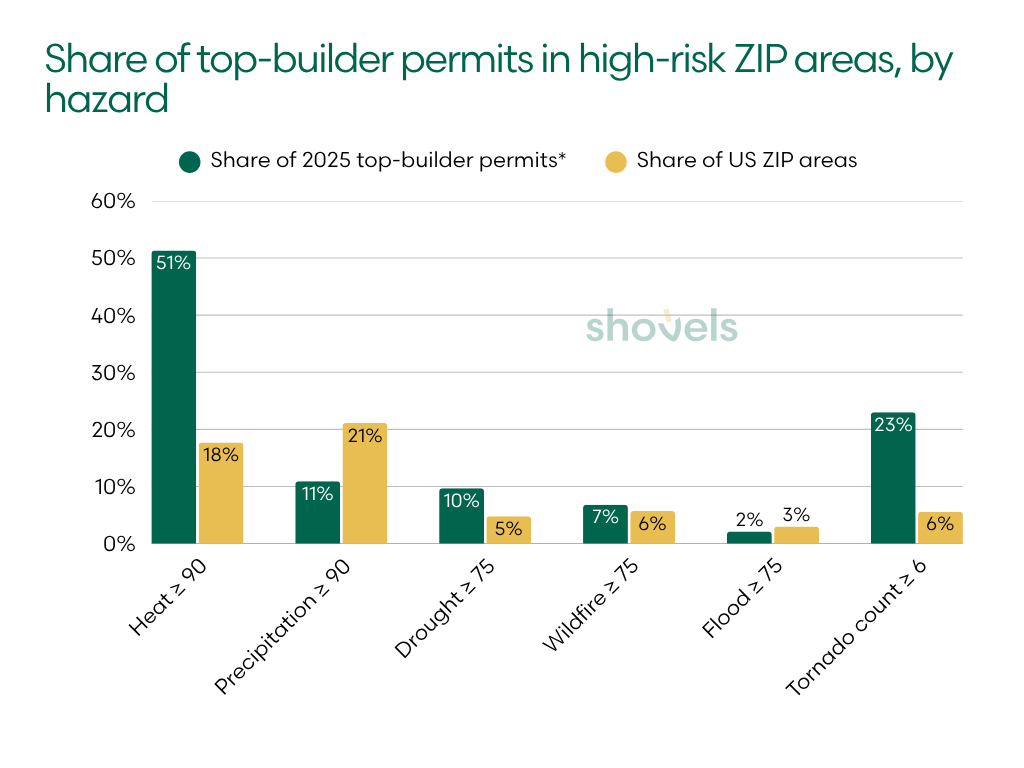
In broad terms, the pattern is clear. Half of these permits landed in the fifth of ZIP areas with the highest heat ratings, and top builders are overrepresented in places with high drought ratings and extensive tornado history. They are underrepresented in areas with high flood and extreme-precipitation ratings.
But a national footprint is just the start. Regional and local concentrations are the focus of this report. To understand each builder’s exposure, we followed every hazard into the markets they impact.
📊 Key takeaways
- Heat sees widespread exposure. 51.3% of analyzed permits were in ZIP areas with heat ratings of 90 or above, compared with 17.7% of ZIP areas nationally.
- Tornado history shows the largest proportional gap. 23.0% of new construction permits were in ZIP areas with at least six recorded tornadoes. These locations represent only 5.6% of ZIP areas nationally.
- Extreme precipitation shows the reverse pattern. 10.9% of permits were in ZIP areas with precipitation ratings of 90 or above. Nationally, high-precipitation areas make up 21.1% of national ZIP areas.
- A builder’s footprint can carry different exposures. Fischer Homes had no analyzed permits in high-wildfire, high-drought, or high-tornado ZIP areas. But it had the second-highest average precipitation rating among the 46 ranked builders.
- One metro can dominate a hazard profile. All 387 of Tri Pointe’s permits in high-wildfire ZIP areas were in Riverside–San Bernardino–Ontario.
How we measured builder climate exposure
We limited our scope to the 50 largest US homebuilders by 2025 closings on the 2026 Builder 100 list. We analyzed 2025 new-construction permits for 46 ranked builders with permit numbers above a set threshold (100 permits). Four builders with permit counts below the threshold were excluded.
Of the ~135,000 permits the builders pulled, 107,493 (80%) carry a ZIP code that matches a ClimateCheck ZIP area. Each permit’s ZIP code was matched to a ClimateCheck ZIP Code Tabulation Area, or ZCTA, the Census Bureau’s statistical approximation of a postal ZIP code. Here’s how ClimateCheck rates their ZIP areas:
- Five hazard ratings (heat, extreme precipitation, drought, wildfire, and flood) run from 1-100.
- They describe relative exposure using historical information and climate projections.
- ClimateCheck’s ratings represent projected conditions around 2050 under SSP5-8.5, a high-emissions scenario in which emissions roughly double by mid-century.
- A rating is a score, not a percentage or a probability of damage.
- Tornado exposure is reported separately as a historical count.
- We call a ZIP area high-risk for a hazard when its rating is 75 or higher (90 or higher for heat and precipitation), or when it has six or more recorded tornadoes.
- Shovels chose the cutoffs for this analysis. ClimateCheck doesn’t publish named risk bands.
Shovels counts permits rather than homes for this analysis, and a permit covering the construction of several units still counts as one. Dates reflect the earliest date on the permit record, usually filing or issuance, rather than a confirmed construction start. We do brand-name matching for homebuilders, but we may miss activity filed through subsidiaries or project-specific LLCs.
The analysis uses hazard screening ratings and supporting data that include historical information and climate projections. These results are not loss estimates or probabilities of damage, and they do not replace a site-specific assessment.
Top-builder permits skew toward high heat and drought risk, away from flood and heavy rain
Across the US, heat is the most widespread exposure. About half of new-construction permits from the top 50 builders are in high-heat ZIP areas, even though these areas make up less than a fifth of the national dataset.
The table below compares the share of permits in high-risk ZIP areas with the share of all 33,300 ZIP areas in the contiguous US that are high-risk.
| Hazard cutoff | Share of 2025 top-builder permits* | Share of US ZIP areas | Permit share vs. national |
|---|---|---|---|
| Heat ≥ 90 | 51.3% | 17.7% | 2.9× |
| Precipitation ≥ 90 | 10.9% | 21.1% | 0.5× |
| Drought ≥ 75 | 9.7% | 4.8% | 2.0× |
| Wildfire ≥ 75 | 6.8% | 5.7% | 1.2× |
| Flood ≥ 75 | 2.1% | 3.0% | 0.7× |
| Tornado count ≥ 6 | 23.0% | 5.6% | 4.1× |
| Drought, wildfire or flood ≥ 75 | 16.9% | 12.6% | 1.3× |
| High-risk for at least one hazard | 71.9% | 46.3% | 1.6× |
*Permit shares are pooled across all 107,493 analyzed permits. Each ZIP area counts equally in the national benchmark, regardless of its population, size or housing stock.
Heat and tornado history show the biggest gaps. Flood and extreme precipitation run the other way: top builders are underrepresented in high-risk ZIP areas for both.
Regional distribution defines builder exposure for each hazard
Geographic distribution means that national builders can be highly exposed to one hazard but carry minimal exposure to another. Almost every builder in the group posts a low share on at least one hazard and a high share on another.
| Hazard | Ranked by | Highest share or rating | Lowest share or rating |
|---|---|---|---|
| Wildfire | % of permits in a wildfire ≥ 75 ZIP area | Shea Homes 44.3%, Betenbough 36.4%, Tri Pointe 30.6% | True Homes, Eastwood, Fischer (all 0.0%) |
| Flood | % of permits in a flood ≥ 75 ZIP area | Adams Homes 12.5%, DSLD 9.3%, PulteGroup 6.5% | Betenbough, Legend (0.0%), Sekisui House U.S. 0.1% |
| Drought | % of permits in a drought ≥ 75 ZIP area | Bloomfield 36.7%, Davidson 32.2%, Castlerock 31.1% | Eight builders at 0.0%, including Fischer, Maronda and Adams |
| Tornado | % of permits in a ZIP area with 6+ historical tornadoes | Betenbough 63.5%, Legend 58.3%, DSLD 53.8% | CBH, True Homes, Fischer (all 0.0%) |
| Heat | Average heat rating | Perry Homes 98.0, Highland 97.4, DSLD 97.1 | CBH 61.2, Shea 72.2, Tri Pointe 74.7 |
| Precipitation | Average precipitation rating | Eastwood 84.9, Fischer 83.7, Minto 83.0 | Betenbough 17.5, Shea 23.1, CBH 25.8 |
Fischer Homes illustrates the pattern in the Midwest. None of its analyzed permits were in high-wildfire, high-drought or high-tornado ZIP areas. Yet its average precipitation rating was 83.7, second highest among the 46 ranked builders.
Betenbough Homes presents a different combination. Its West Texas footprint had the lowest average precipitation rating and no permits in high-flood ZIP areas. But it also posts the highest average wildfire rating and the largest share of permits in high-tornado ZIP areas.
CBH Homes, concentrated in Idaho, was the only ranked builder with no analyzed permits in high-heat ZIP areas. It also had none in high-tornado ZIP areas and one of the lowest average precipitation ratings. But it had the third-highest average wildfire rating, though only 5.7% of its permits were in high-wildfire ZIP areas.
Toll Brothers had one of the lowest average heat ratings, ranking 43rd of 46. About 10% of its 2025 permits were in the Mid-Atlantic, nearly all in Virginia, roughly three times the share for the top 50 as a group. But it ranked 16th on drought, 19th on flood, and 22nd on wildfire using these measures.
A national footprint can still concentrate exposure in one metro
Concentrations of permits in high-risk ZIP areas are especially striking at the metro level. For several builders, one market accounts for most or all of a builder’s permits in high-risk ZIP areas for a particular hazard. This is true even when the builder operates across multiple regions.
- Shea Homes had 262 permits in high-wildfire ZIP areas. Of those, 204 were in Phoenix–Mesa–Chandler and another 35 were around San Luis Obispo.
- Tri Pointe had 387 permits in high-wildfire ZIP areas, all in Riverside–San Bernardino–Ontario.
- Adams Homes had 110 permits in high-flood ZIP areas, of which 106 were in Punta Gorda.
Building across many states doesn’t spread out exposure to any single hazard.
For portfolio screening, these concentrations make the metro a useful next step after the builder-level comparison. The national total identifies a potential concern. The metro breakdown is a way to investigate where exposure clusters.
Each hazard has its own geography
Each hazard is different on the ground, so we analyzed them one at a time. We rank builders separately for each hazard rather than combining the results into one score. Heat, flooding, wildfire and water stress affect projects differently, and their ratings cannot be aggregated without skewing the picture.
For wildfire, flood and drought, the rankings are based on the share of permits in ZIP areas rated 75 or above. Heat and precipitation are ranked by average rating. The heat and precipitation tables also list the share of permits in ZIP areas rated 90 or above. Tornado rankings use the share of permits in ZIP areas with at least six historical tornadoes.
Each table shows the top eight of the 46 eligible builders.
Wildfire: concentration and average exposure tell different stories
ClimateCheck’s wildfire rating is the median rating for buildings with any wildfire risk in a ZIP area. It summarizes buildings with some risk rather than every property in the area, so a high rating can reflect severe risk for a small share of buildings.
| Builder | Region | Permits analyzed | % in wildfire ≥ 75 ZIP area | Avg wildfire rating |
|---|---|---|---|---|
| Shea Homes | Southwest | 591 | 44.3% | 54.2 |
| Betenbough Homes | TX | 1,201 | 36.4% | 67.0 |
| Tri Pointe | National | 1,264 | 30.6% | 54.6 |
| Mattamy Homes | FL | 1,341 | 23.3% | 38.6 |
| Century Communities | National | 2,131 | 17.5% | 45.7 |
| Beazer Homes | National | 1,030 | 17.1% | 41.7 |
| David Weekley | National | 1,707 | 13.0% | 38.9 |
| Risewell Homes | National | 1,232 | 12.8% | 50.7 |
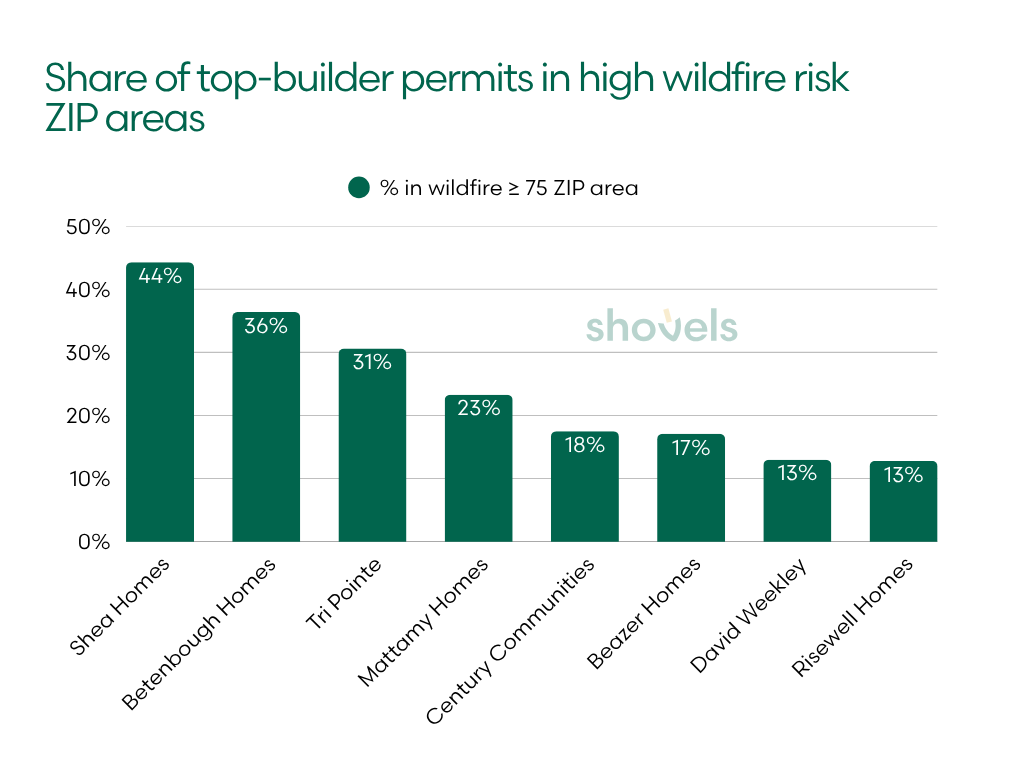
Shea Homes had the largest share of permits in high-wildfire ZIP areas, at 44.3%, followed by Betenbough Homes at 36.4% and Tri Pointe at 30.6%. Their leading positions reflect elevated activity in different markets, including the desert Southwest, West Texas, and inland Southern California.
The average rating adds a second perspective. Betenbough’s average of 67.0 was the highest in the group, suggesting higher ratings across more of its observed footprint. Mattamy’s average was much lower, at 38.6, yet nearly a quarter of its permits (23.3%) were in high-wildfire ZIP areas.
Flood exposure is a Gulf Coast story, but not one flood mechanism
ClimateCheck’s flood methodology incorporates coastal high-tide flooding, storm surge, riverine flooding and surface flooding. A similar rating in two markets can reflect different physical mechanisms and call for different site-level investigations. As with wildfire, ClimateCheck’s ZIP-area rating summarizes buildings with some risk rather than every property in the area.
| Builder | Region | Permits analyzed | % in flood ≥ 75 ZIP area | Avg flood rating |
|---|---|---|---|---|
| Adams Homes | FL | 878 | 12.5% | 48.0 |
| DSLD Homes | Southeast ex FL | 1,639 | 9.3% | 44.5 |
| PulteGroup | National | 8,305 | 6.5% | 42.1 |
| David Weekley | National | 1,707 | 4.6% | 44.4 |
| Meritage Homes | National | 4,520 | 4.1% | 42.0 |
| Taylor Morrison | National | 3,804 | 3.6% | 40.6 |
| M/I Homes | National | 2,531 | 2.8% | 38.5 |
| Lennar | National | 20,311 | 2.6% | 40.9 |
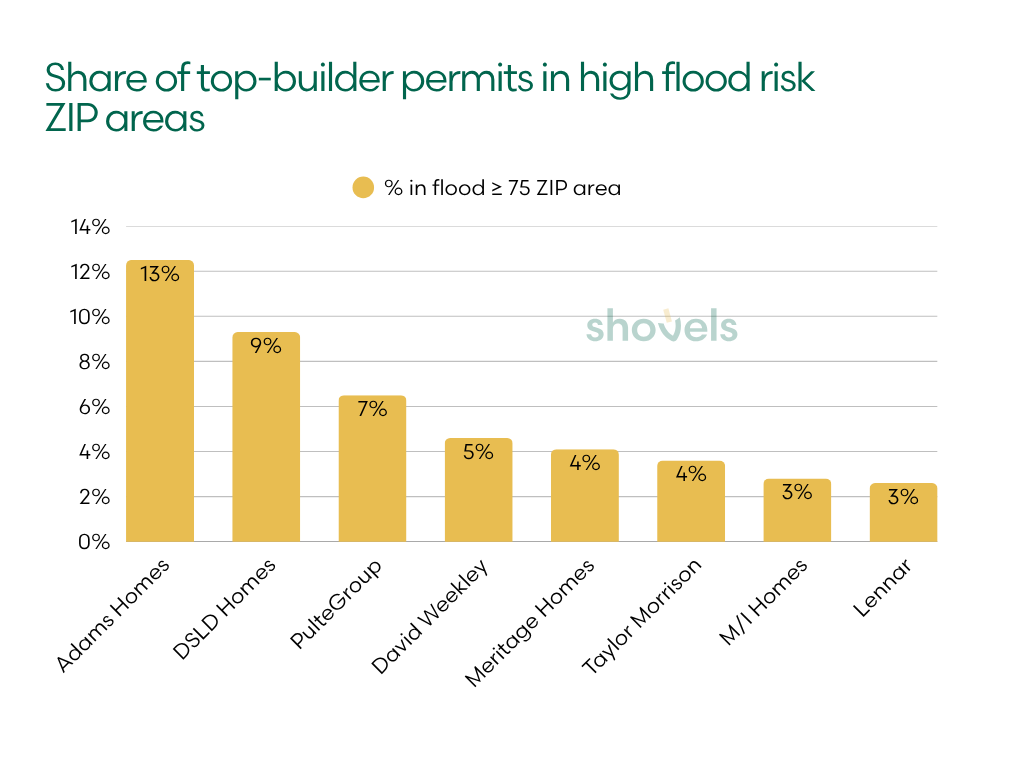
Only 2.1% of all analyzed permits were in high-flood ZIP areas, compared with 3.0% of ZIP areas nationally. For Adams Homes, however, the share was 12.5%, the highest among ranked builders. Almost all of those permits were in Punta Gorda.
DSLD Homes followed at 9.3%, while PulteGroup led the national builders in the table at 6.5%.
Texas builders are overrepresented in drought exposure
ClimateCheck’s drought rating considers baseline water stress and its projected change, linking water demand to available supply. For a development project, a high area rating is a reason to examine local water conditions and infrastructure.
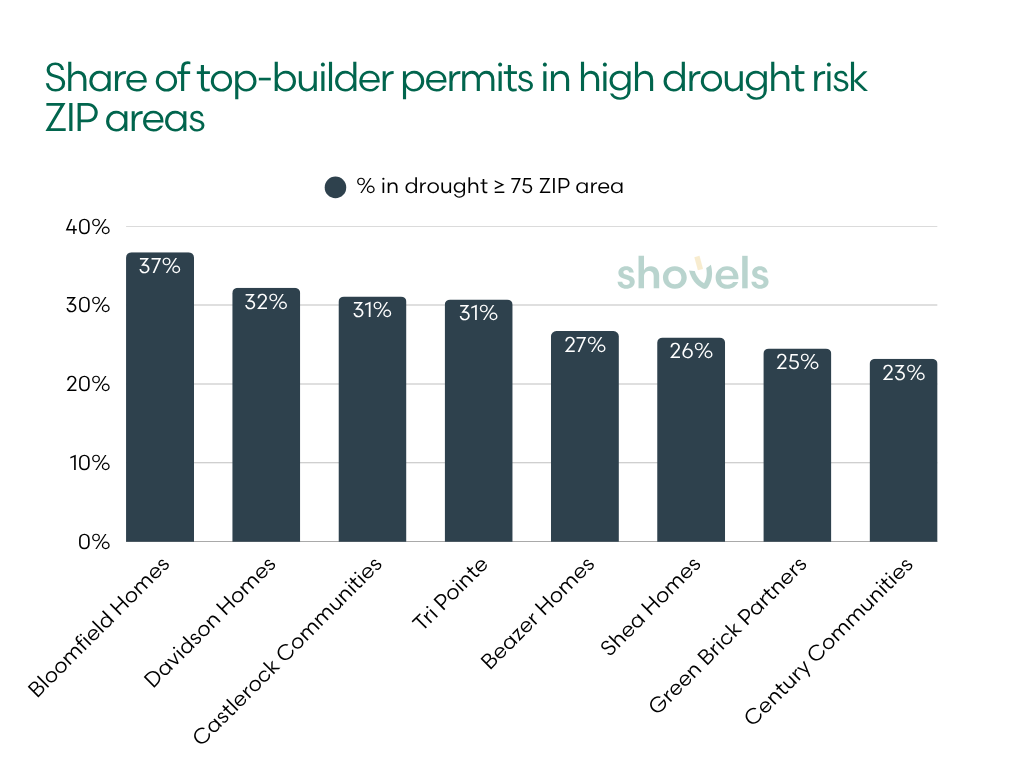
Four of the top eight builders in our drought table had permit activity concentrated in Texas. The table also includes national builders and Shea Homes in the Southwest.
| Builder | Region | Permits analyzed | % in drought ≥ 75 ZIP area | Avg drought rating |
|---|---|---|---|---|
| Bloomfield Homes | TX | 218 | 36.7% | 65.4 |
| Davidson Homes | TX | 242 | 32.2% | 58.6 |
| Castlerock Communities | TX | 486 | 31.1% | 55.7 |
| Tri Pointe | National | 1,264 | 30.7% | 53.9 |
| Beazer Homes | National | 1,030 | 26.7% | 49.9 |
| Shea Homes | Southwest | 591 | 25.9% | 59.4 |
| Green Brick Partners | TX | 605 | 24.5% | 63.7 |
| Century Communities | National | 2,131 | 23.2% | 45.9 |
Bloomfield Homes, Davidson Homes and Castlerock Communities had the largest shares of permits in high-drought ZIP areas, ranging from 31.1% to 36.7%.
Across the full sample, 9.7% of permits were in high-drought ZIP areas, compared with 4.8% of ZIP areas nationally. The share of permits in high-drought ZIP areas is about twice the national ZIP-area share, although heat and tornado history show larger proportional gaps.
Heat: widespread high-heat exposure for several Texas and Gulf builders
ClimateCheck’s heat rating considers the projected frequency and severity of extreme heat, including temperature and humidity-related heat stress. It is broader than a ranking of average summer temperatures.
We use a cutoff of 90 because a rating of 75 sits near the middle of the national ZIP-area distribution. The higher cutoff selects approximately the highest-rated fifth of ZIP areas in this extract.
| Builder | Region | Permits analyzed | Avg heat rating | % in heat ≥ 90 ZIP area |
|---|---|---|---|---|
| Perry Homes | TX | 1,336 | 98.0 | 99.9% |
| Highland Homes | TX | 717 | 97.4 | 99.7% |
| DSLD Homes | Southeast ex FL | 1,639 | 97.1 | 100.0% |
| Castlerock Communities | TX | 486 | 97.0 | 94.4% |
| Legend Homes | TX | 345 | 96.9 | 100.0% |
| Minto Communities | FL | 358 | 95.0 | 100.0% |
| Adams Homes | FL | 878 | 94.7 | 81.2% |
| Bloomfield Homes | TX | 218 | 93.8 | 100.0% |
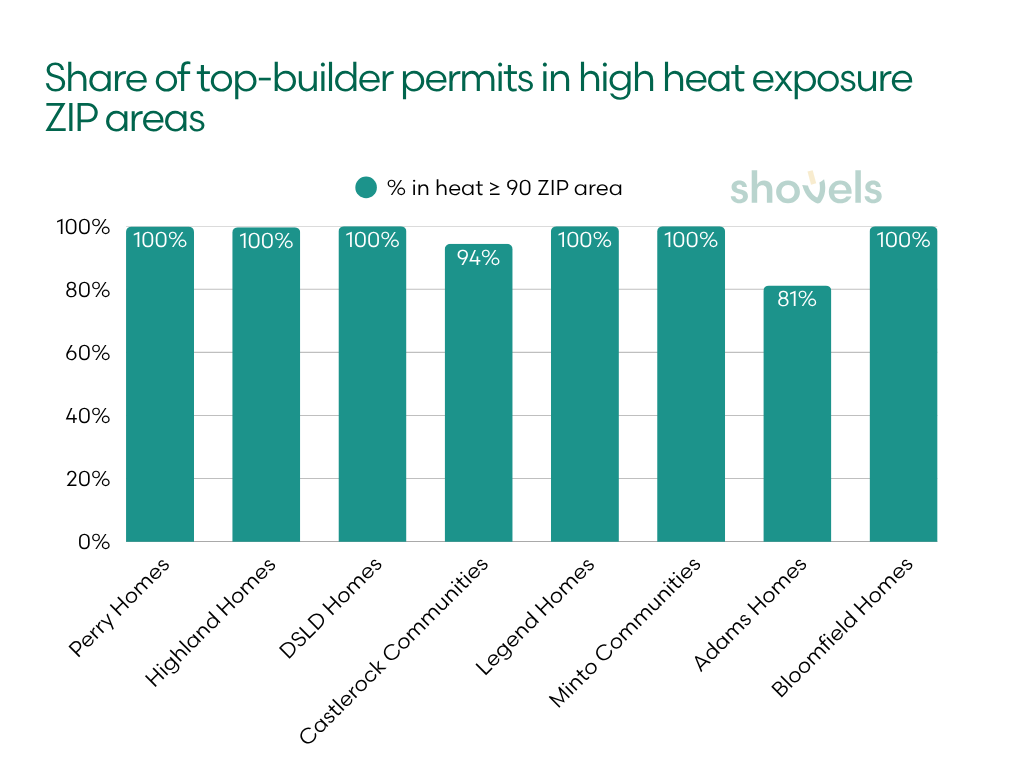
Perry Homes and Highland Homes had more than 99% of their analyzed permits in ZIP areas at or above 90. DSLD Homes, Legend Homes, Minto Communities and Bloomfield Homes had all of their analyzed permits in that band.
Heat also reaches well beyond the leaders. The pooled share of permits in high-heat ZIP areas was 51.3%, and the median builder’s share was 49.9%. This is a broad feature of the sample rather than a result driven only by a few builders.
At the other end, CBH Homes averaged 61.2 and had no permits in high-heat ZIP areas. Shea Homes averaged 72.2, with 5.6% in high-heat ZIP areas, while Tri Pointe averaged 74.7, with 32.5%. Both Shea and Tri Pointe ranked near the top for wildfire and drought, reinforcing how much the hazard profiles can differ.
Extreme precipitation: Southeast and Midwest builders lead a less-exposed pooled footprint
ClimateCheck’s precipitation rating considers the projected frequency of extreme rainfall events and the amount of rain in those events. It measures exposure to heavy precipitation rather than simply annual rainfall totals.
The cutoff of 90 selects approximately the highest-rated fifth of ZIP areas. Builders are ranked by average rating. The table also lists the share of permits in high-precipitation ZIP areas.
| Builder | Region | Permits analyzed | Avg precipitation rating | % in precipitation ≥ 90 ZIP area |
|---|---|---|---|---|
| Eastwood Homes | Southeast ex FL | 287 | 84.9 | 23.7% |
| Fischer Homes | Midwest | 492 | 83.7 | 31.3% |
| Minto Communities | FL | 358 | 83.0 | 0.0% |
| True Homes | Southeast ex FL | 328 | 82.3 | 0.0% |
| NVR | Southeast ex FL | 3,003 | 81.6 | 27.0% |
| Smith Douglas Homes | Southeast ex FL | 400 | 81.5 | 47.0% |
| Kolter Homes | Southeast ex FL | 275 | 81.4 | 40.4% |
| Stanley Martin | Southeast ex FL | 1,183 | 80.1 | 16.7% |
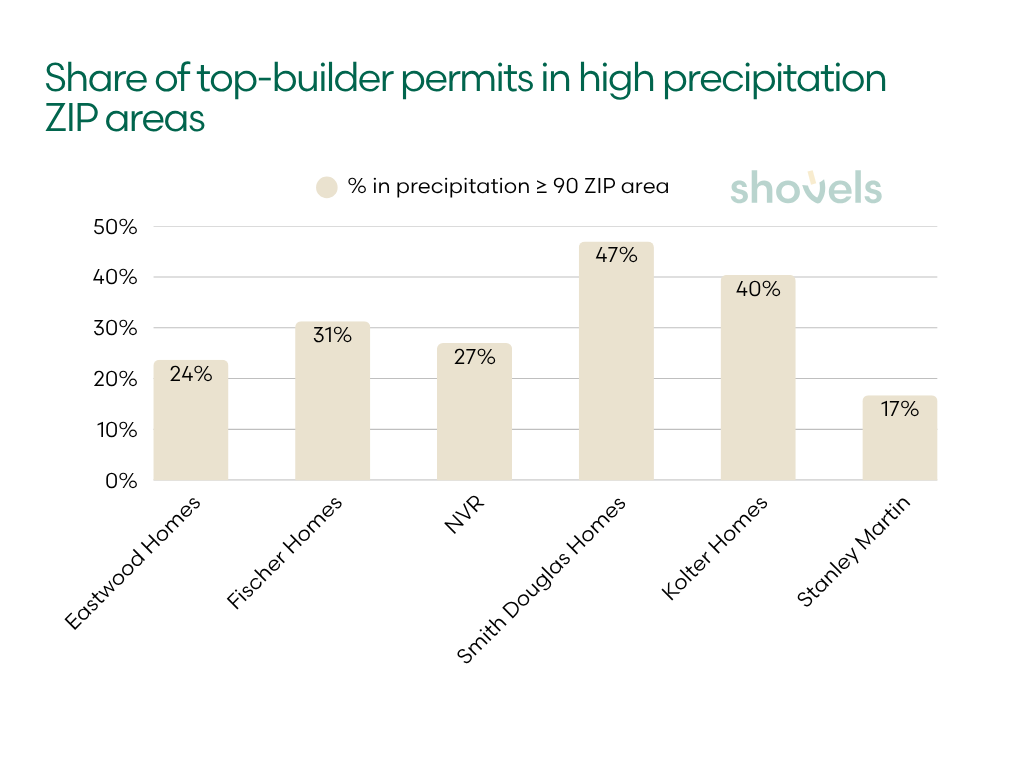
Eastwood Homes and Fischer Homes had the highest average precipitation ratings, at 84.9 and 83.7. Across all analyzed permits, however, only 10.9% were in high-precipitation ZIP areas, compared with 21.1% of ZIP areas nationally. Thirteen ranked builders had none, and the median builder’s share was 7.2%.
Average ratings and cutoff shares diverge particularly sharply here. Minto Communities and True Homes averaged above 82, but neither had a permit in a ZIP area rated 90 or above. Smith Douglas Homes had a slightly lower average of 81.5, but 47.0% of its permits were in high-precipitation ZIP areas. This was the highest share in the group.
This distinction matters because an average describes the overall rated footprint, while a cutoff share identifies concentration at the upper end. True Homes and Fischer also had no permits in high-wildfire or high-tornado ZIP areas, offering another example of how a footprint can carry elevated exposure to one hazard while rating lower on others.
Tornado history: the largest gap between permit activity and the ZIP-area benchmark
Tornado exposure is reported as a historical count for each ZIP area, not a rating from 1 to 100. A count of at least six selects 5.6% of ZIP areas in the extract. Note that this is not a projection, an annual probability or a complete measure of hurricane and wind exposure.
| Builder | Region | Permits analyzed | % in 6+ tornado ZIP area | Avg tornado count |
|---|---|---|---|---|
| Betenbough Homes | TX | 1,201 | 63.5% | 7.9 |
| Legend Homes | TX | 345 | 58.3% | 6.0 |
| DSLD Homes | Southeast ex FL | 1,639 | 53.8% | 6.0 |
| Bloomfield Homes | TX | 218 | 49.1% | 6.0 |
| AMH | FL | 766 | 46.2% | 6.1 |
| Taylor Morrison | National | 3,804 | 36.3% | 5.4 |
| Adams Homes | FL | 878 | 36.3% | 4.9 |
| David Weekley | National | 1,707 | 35.6% | 5.0 |
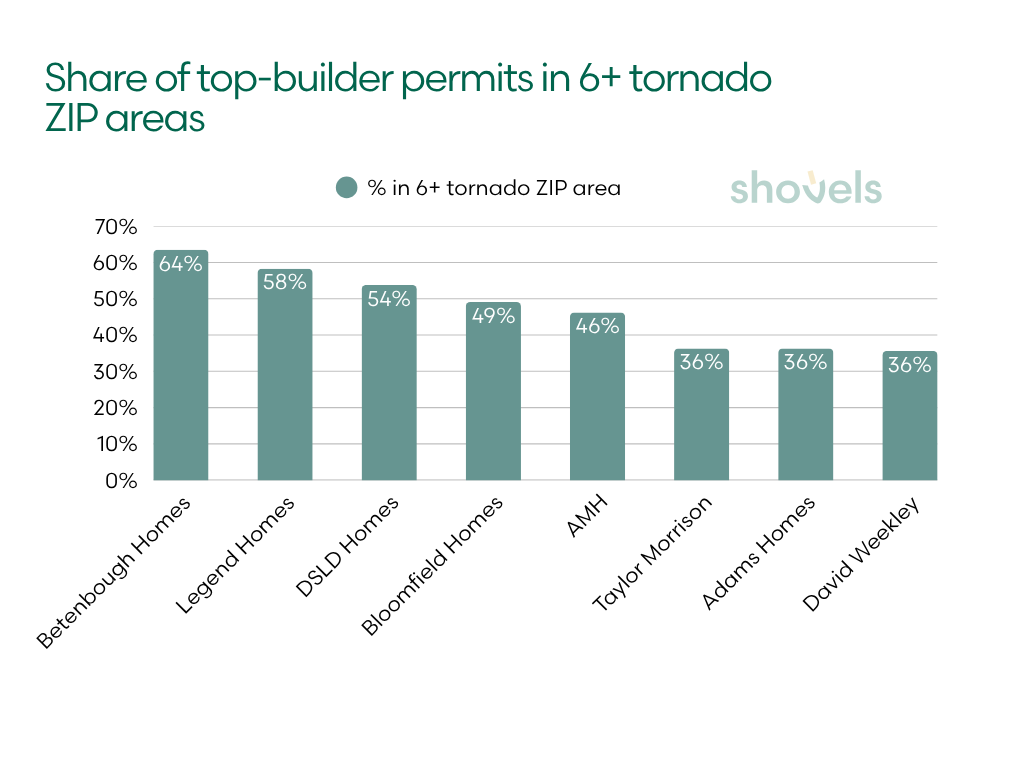
Betenbough Homes, Legend Homes and DSLD Homes each had more than half of their analyzed permits in ZIP areas meeting the tornado-history cutoff. Betenbough led at 63.5%, followed by Legend at 58.3% and DSLD at 53.8%.
Across the sample, 23.0% of permits were in high-tornado ZIP areas, more than four times the national ZIP-area share of 5.6%. That is the largest proportional difference among the six measures.
The next decisions are local
The national figures show which hazards are prominent in the construction pipeline. The regional breakdowns show where those exposures are taking shape and where builders, insurers and lenders can focus their next decisions.
For builders, the concentrated examples point toward specific land acquisition and project decisions. Tri Pointe’s wildfire profile leads directly to Riverside–San Bernardino–Ontario. Adams Homes’ flood profile leads to Punta Gorda. Evaluating sites, infrastructure and building specifications in those markets may be more useful than relying on the apparent breadth of a national footprint.
For insurers and lenders, permit activity provides an early view of potential additions to housing stock. Mattamy’s wildfire figures show why both averages and concentrations matter: a relatively low average can conceal a substantial share of permits in high-rated areas. Metro and ZIP-area screening can identify projects for closer review, followed by property-level assessment of hazards, design and mitigation.
Overall, a builder’s national reach says little about where its exposure to a particular hazard is concentrated. In the clearest cases, hundreds of permits in high-risk ZIP areas lead back to a single metro. That is where the portfolio-level finding becomes a question about the next site, the next project and the conditions it will face.
Want to see where new construction is going up in your markets? Shovels tracks new-construction permits by builder, metro and ZIP code across the US, so builders, insurers, lenders and suppliers can see where new homes are going before they close. Contact us to learn more.
Frequently Asked Questions
- Which large homebuilders had the most permits in ZIP areas with high wildfire ratings?
-
Among the 46 ranked builders, Shea Homes had the largest share at or above the wildfire rating cutoff of 75, at 44.3%. Betenbough Homes followed at 36.4% and Tri Pointe at 30.6%. All 387 of Tri Pointe’s high-wildfire permits were in Riverside–San Bernardino–Ontario.
- Does this analysis show that big builders are building in flood zones?
-
It does not establish whether individual projects are in FEMA flood zones. It shows that 2.1% of analyzed permits were in ZIP areas with a ClimateCheck flood rating of at least 75, compared with 3.0% of ZIP areas nationally. Adams Homes, DSLD Homes and PulteGroup had the highest builder-level shares.
- What does a ClimateCheck hazard rating mean?
-
It is a relative score from 1 to 100 based on historical information and projected hazard conditions. Higher ratings indicate greater exposure within the provider’s coverage area. A score of 90 does not mean a 90% probability of damage. This analysis uses area ratings for five hazards and a separate historical tornado count.
- How common is high heat exposure in the builders’ permit locations?
-
51.3% of analyzed permits were in ZIP areas with heat ratings of at least 90, compared with 17.7% of ZIP areas nationally. Perry Homes and Highland Homes had more than 99% of their analyzed permits in that band.
- Does operating in many states reduce climate exposure?
-
A broad footprint does not guarantee that exposure to a particular hazard is spread across markets. All of Tri Pointe’s permits in high-wildfire ZIP areas were in one metro, despite its national footprint. This analysis identifies concentrations; it does not estimate the financial benefit of geographic diversification.
- Which builders had the highest exposure to tornado history?
-
Betenbough Homes had 63.5% of analyzed permits in ZIP areas with at least six historical tornadoes, followed by Legend Homes at 58.3% and DSLD Homes at 53.8%. These counts describe historical activity rather than future probabilities.