

California has one of the most acute housing shortages in the country. According to the California Department of Housing and Community Development, the state needs roughly 2.5 million new homes over the next eight years to meet demand across all income levels. Prices in the state are still among the highest in the U.S. And by most measures, construction isn't keeping up.
Third-party analysts tracking Census Bureau data are sounding the alarm on declining permit volumes. Los Angeles alone saw a 23% drop in housing permits in 2024. But is the picture as dire as it seems from the headlines?
To understand what's happening in greater detail, we turned to our own data. While the pipeline has been tightening for years, and affordability and financing present significant challenges, the full story of California residential construction is more nuanced than widely reported.
Why California Building Permit Data Matters for the Housing Market
Most housing analysis relies on indicators like closed sales, days on market, and median prices. Those matter, but by the time they move, the trend has usually been in motion for months.
Permit data works differently. Once a builder pulls a permit, construction typically starts within three to six months for smaller projects and up to two years for larger developments. Sales follow another 12 to 18 months after that. In other words, permits are one of the clearest forward signals of future supply.
Methodology
We analyzed building permit data across 213 California jurisdictions where Shovels has consistent, clean data records year-over-year. While this does not include every jurisdiction in California, these markets account for roughly 75% of total permit coverage in the Shovels California dataset. They also represent a significant share of the state's construction activity.
Our figures should be treated as directional signals. The trends are consistent and meaningful. The absolute counts are not a proxy for the full market.
All permit counts are filtered by issue date, have a positive approval duration, and exclude inactive permits. County-level figures are calculated by aggregating permit data across jurisdictions within each county.
Residential permits include single-family homes, mobile and manufactured homes, multi-family housing, duplexes, townhouses, and some apartments. They exclude vacant land and large apartment buildings. Trade permits (electrical, plumbing, HVAC, and similar) are excluded from new residential construction counts unless otherwise noted.
Executive Summary
California's new construction market took a sharp hit in 2023 and has since stabilized at a lower level. The freefall has stopped, but the state is still building 21% fewer homes than at the 2022 peak, and nothing in the data suggests a near-term rebound.
The headlines:
- New construction permits fell 20% in 2023 and have been essentially flat since, down less than 1% in 2025.
- ADUs are the clearest bright spot, up 54.3% since 2021, with growth re-accelerating to 8.6% in 2025 after a post-surge cooldown.
- The January 2025 LA wildfires added a new layer to the permit data, with demolition and rebuild activity surging across select LA neighborhoods.
- EV charger permits have nearly doubled since 2021. Heat pump permits are up 195%.
- Major homebuilders have pulled back significantly. Lennar is down 40% from its 2022 peak. KB Home is down 65%.
How Many New Construction Permits Were Pulled in California in 2025?
The short answer: fewer than the 2022 peak, but the contraction has stopped accelerating.
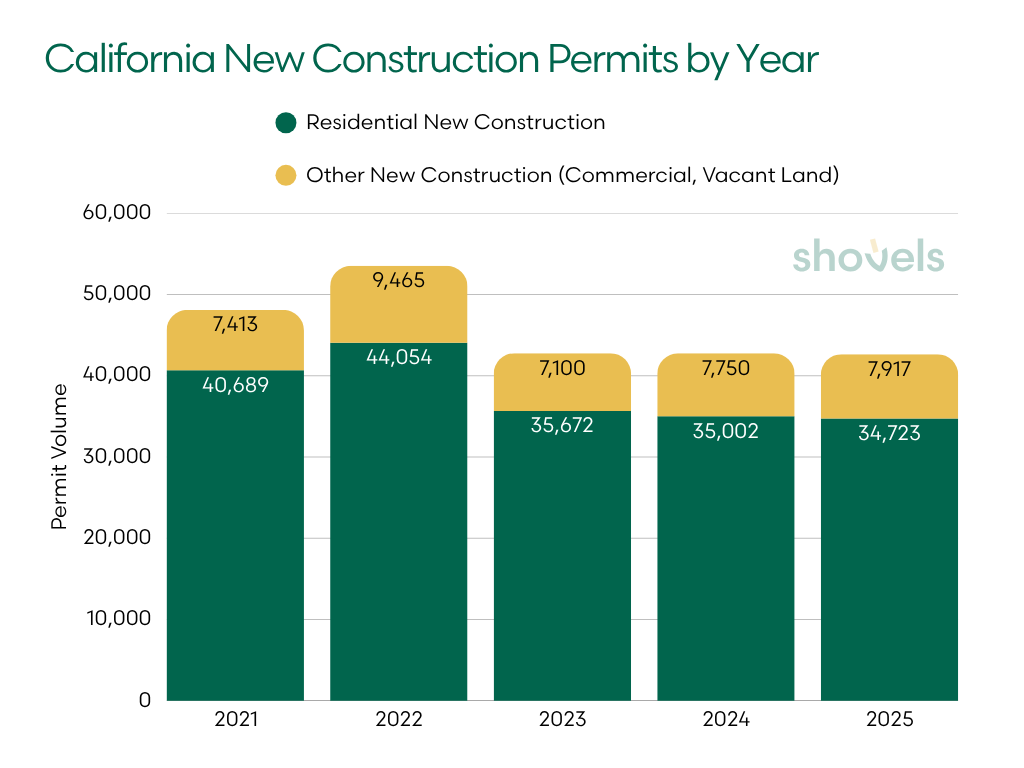
Our data shows 42,640 total new construction permits across California in 2025, down just 0.3% from the prior year. Residential permits were essentially flat at 34,723, a 0.8% decline. While these figures reflect Shovels' coverage only, the directional signal is clear.
| Year | All New Construction* | YoY % | Residential* | YoY % | Res. Share |
|---|---|---|---|---|---|
| 2021 | 48,102 | — | 40,689 | — | 84.6% |
| 2022 | 53,519 | +11.3% | 44,054 | +8.3% | 82.3% |
| 2023 | 42,772 | −20.1% | 35,672 | −19.0% | 83.4% |
| 2024 | 42,752 | −0.0% | 35,002 | −1.9% | 81.9% |
| 2025 | 42,640 | −0.3% | 34,723 | −0.8% | 81.5% |
Trade permits (electrical, plumbing, HVAC, and similar) are excluded from new construction and residential new construction counts.
2022 marked the peak for new construction. New builds surged on pandemic-era demand and ultra-low borrowing costs. Then rates jumped, and the economics of new homes shifted quickly. 2023 was the reset year. New construction dropped nearly 20%, the sharpest decline in this dataset. Projects that penciled out at 3% financing stopped making sense at 7%. Homeowners who had locked in low rates had little incentive to sell, which further cooled demand for new construction across the state.
What happened next is notable. Instead of continuing to fall, construction activity in 2024 and 2025 largely flattened, down less than 2% in 2024 and under 1% in 2025. That's not a recovery. Residential construction is still running 21% below its 2022 peak, and the state's housing shortage isn't meaningfully improving by most external measures. But after the sharp correction in 2023, builders seem to have reset to a new baseline.
Whether that floor holds is an open question. Regulatory costs for new homes in California can run twice the national average, approvals remain slow, and financing conditions set a high barrier to entry. Building in California is difficult, and nothing in this data suggests that's about to change.
The Takeaway: The trend is straightforward. California took a sharp 20% hit in 2023, then stabilized. The state isn't building its way out of a housing shortage, but the slide has, at least for now, stopped.
Where Is California Building? A Regional Permit Breakdown
Statewide averages can hide a lot. While residential construction is down overall, the regional picture is more uneven. Some markets are holding up well. Others look like they're in structural, not cyclical decline. Los Angeles City, shaped by wildfire recovery, requires a separate look.
Bay Area Real Estate Market: A County-by-County Divergence
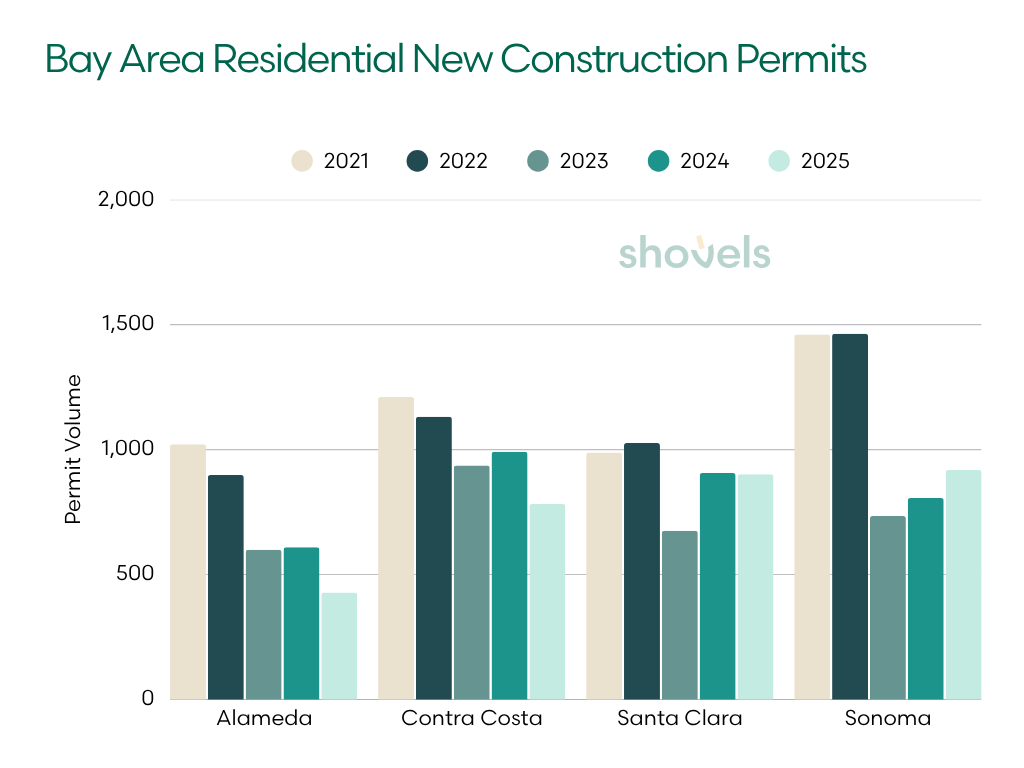
The Bay Area gets a reputation as California's most dysfunctional housing market, and the residential construction data largely earns it. Across the nine-county region, cities and counties permitted just 9,100 new housing units in 2024, one of the lowest totals in 15 years, and 75% below the 32,500 units permitted in 2018. A closer look at four counties in the Shovels dataset tells the same story with more granularity.
| County | 2021 | 2022 | 2023 | 2024 | 2025 |
|---|---|---|---|---|---|
| Alameda | 1,021 | 898 | 599 | 609 | 428 |
| Contra Costa | 1,210 | 1,131 | 936 | 991 | 782 |
| Santa Clara | 988 | 1,026 | 675 | 906 | 901 |
| Sonoma | 1,461 | 1,464 | 734 | 806 | 918 |
Alameda County is down 52% from its 2022 peak in residential new construction and the worst performer. Oakland sits at the center of that decline. The city's permitting process has been widely described as a significant obstacle to housing production, with high construction costs and interest rates compounding what were already structural barriers. In 2023, Oakland permitted fewer new residential units than in any year since 2015.
Santa Clara County tells a different story. Down only 12% from its 2022 peak in residential permits and essentially flat between 2024 and 2025, it's the most resilient county in our Bay Area dataset. Tech-sector demand appears to be keeping residential builder activity in Santa Clara County active. That said, city fees in Silicon Valley can run $50,000 to $120,000 per market-rate home. This is a structural constraint that doesn't respond to rate movements.
Sonoma County saw a sharper drop in 2023, likely reflecting the final phase of North Bay wildfire rebuild activity normalizing. Since then, residential permitting has partially recovered, trending back toward 2022 levels through 2024 and 2025. Contra Costa falls in between: a steady, moderate decline in residential construction that largely mirrors the broader statewide pattern.
Southern California Housing Market: Los Angeles Building Permits and the Wildfire Effect
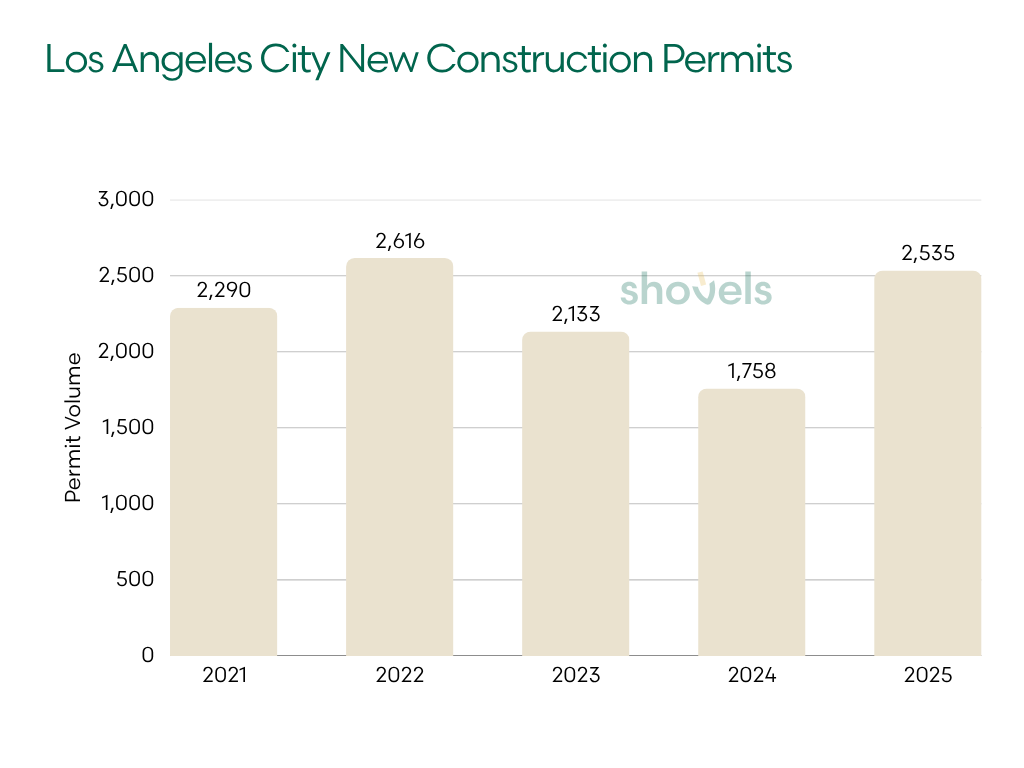
The City of LA historically permitted more than 13,000 new residential units per year between 2015 and 2022. That era is over. Following a 23% drop in residential housing permits in 2024, our data shows 2025 residential permit counts recovering, but that number needs context.
| Year | Los Angeles (City) |
|---|---|
| 2021 | 2,290 |
| 2022 | 2,616 |
| 2023 | 2,133 |
| 2024 | 1,758 |
| 2025 | 2,535 |
No discussion of California's 2025 construction data is complete without a close look at fire recovery. Together, the Eaton Fire and Palisades Fire destroyed more than 16,000 structures across Los Angeles County. The rebuild will be one of the largest concentrated construction efforts California has seen in decades.
Analysts at Hilgard Economics noted that Palisades Fire rebuild permits provided a noticeable boost to citywide Q3 2025 figures but that underlying residential construction activity remains well below the pre-2022 baseline. If you exclude wildfire rebuild activity, the trend is much softer.
We published a full breakdown of the rebuild story, including contractor activity, permit status by zone, the economic scale of reconstruction, and why Altadena and Pacific Palisades are on such different timelines. You can read the full LA wildfire rebuild report here.
Coastal Southern California: Newport Beach and Manhattan Beach
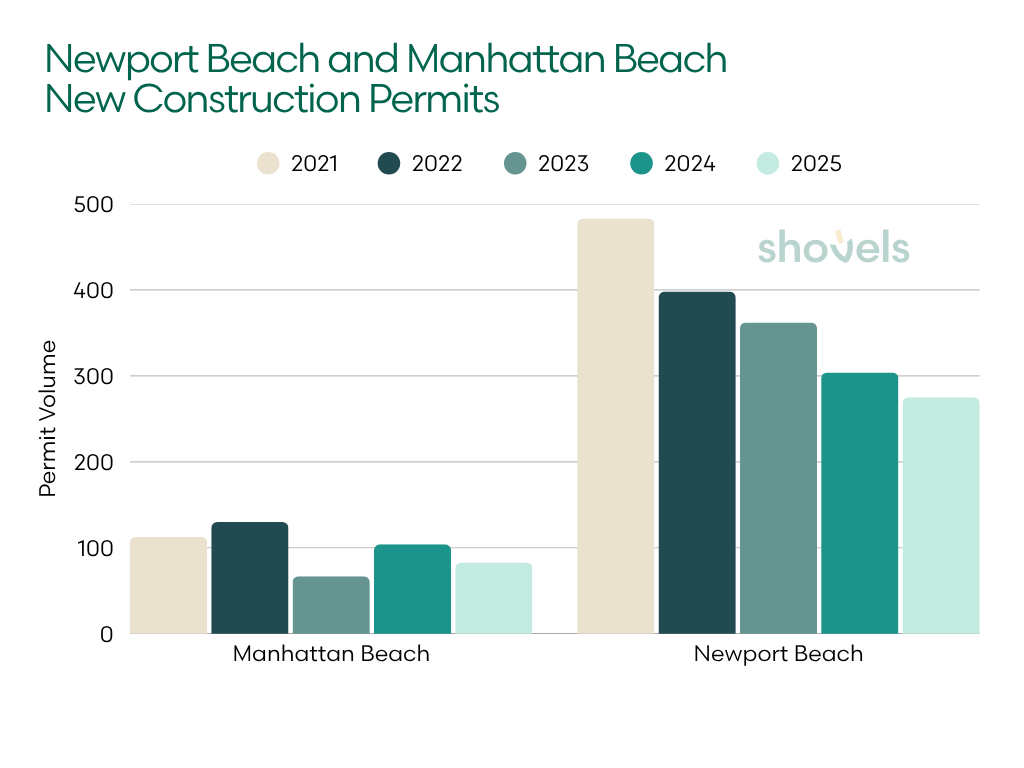
Manhattan Beach and Newport Beach tell a story of coastal constraints. Newport Beach has declined every single year since 2021, now down 43% from peak. Manhattan Beach is more volatile year to year but tracks the same underlying trend.
| Jurisdiction | 2021 | 2022 | 2023 | 2024 | 2025 |
|---|---|---|---|---|---|
| Manhattan Beach (LA County) | 113 | 130 | 67 | 104 | 83 |
| Newport Beach (Orange County) | 483 | 398 | 362 | 304 | 275 |
Limited land, strict zoning, and community resistance to density make these jurisdictions less responsive to Federal Reserve policy and statewide housing mandates. Sixty miles east, the supply constraints that define coastal Southern California largely disappear.
Inland Empire: Fontana
Fontana, in San Bernardino County, shows what a market with steady inventory looks like. After stable activity in 2021 and 2022 (753 and 728 permits, respectively), permits surged 63% to 1,185 in 2023 before pulling back sharply to 522 in 2024 and partially recovering to 700 in 2025.
The 2023 spike traces directly to Narra Hills, a 489-home master-planned community by Landsea Homes in northwestern Fontana that broke ground in March 2022 and began selling homes by mid-2023. The groundbreaking covered site infrastructure, grading, roads, and utilities, while residential building permits for individual homes were pulled in batches throughout 2023 as pads became ready to build.
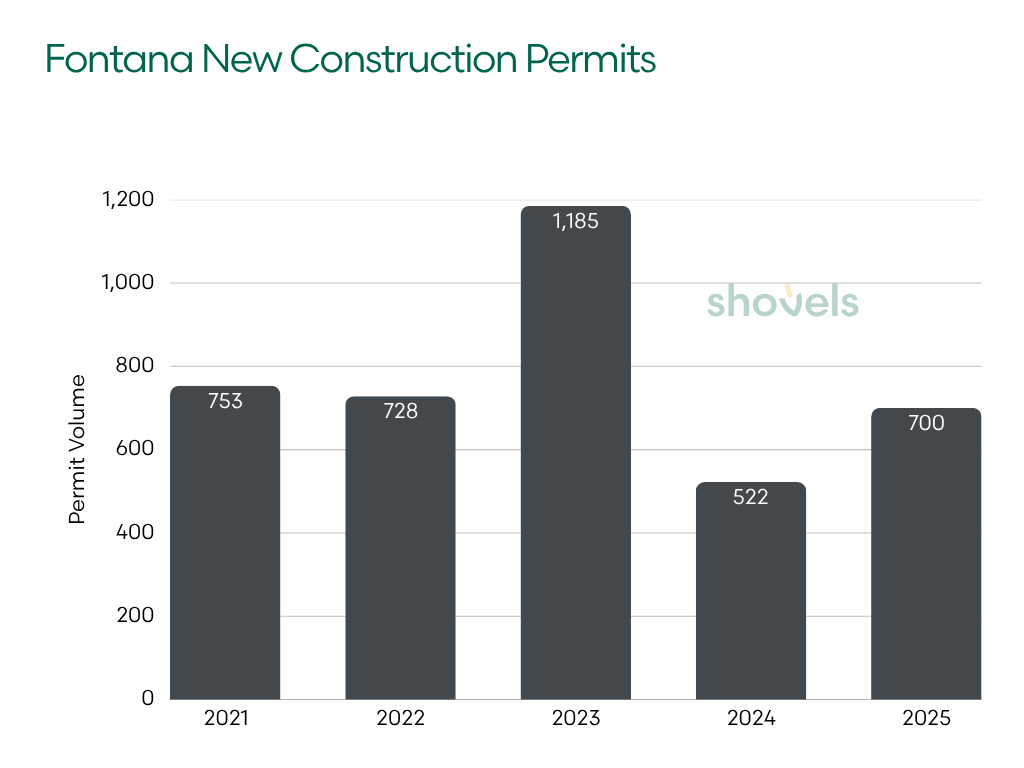
| Jurisdiction | 2021 | 2022 | 2023 | 2024 | 2025 |
|---|---|---|---|---|---|
| Fontana (San Bernardino County) | 753 | 728 | 1,185 | 522 | 700 |
San Bernardino County as a whole followed the same arc, with permits falling roughly 25% from 2023 to 2024. A surge when a large project enters the construction pipeline, then a pullback as building catches up with entitlements: that's what Inland Empire growth actually looks like.
Statewide Signals From Other California Counties
Kings County in California's Central Valley is one of the few places to break the post-2022 trend. Residential construction grew from 2021 through 2024 before pulling back in 2025. The region's relative affordability and stable employment base, anchored in part by Naval Air Station Lemoore, appear to have supported builder activity longer than in coastal markets. The 2025 dip likely reflects the broader statewide recalibration catching up.
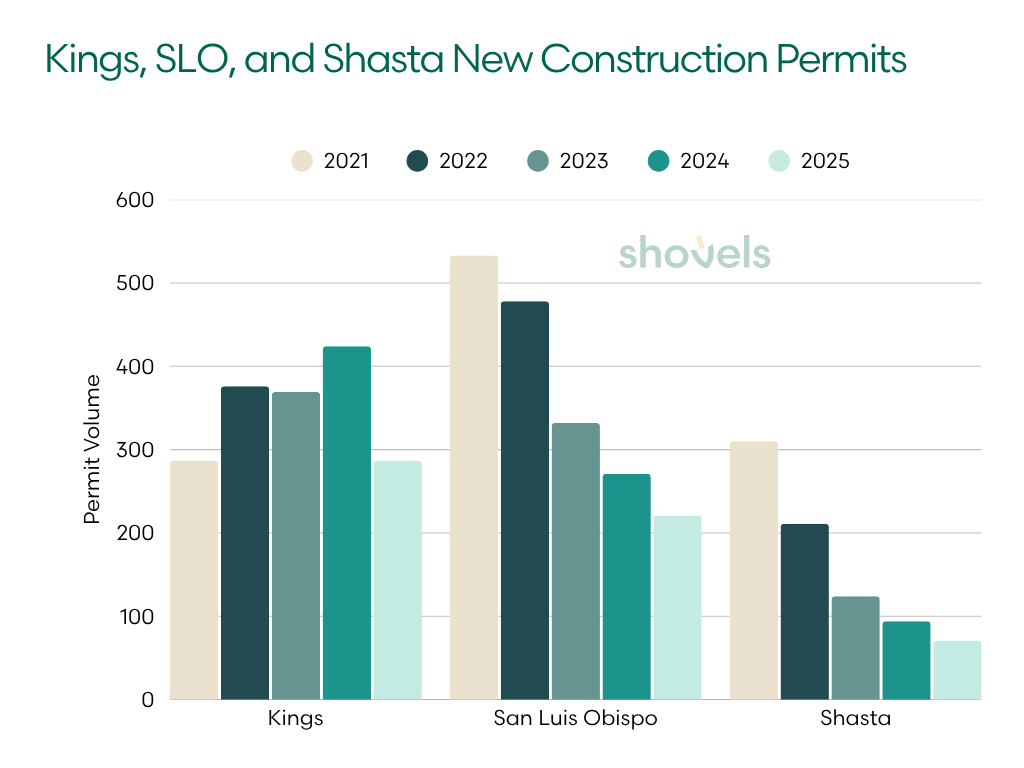
| County | 2021 | 2022 | 2023 | 2024 | 2025 |
|---|---|---|---|---|---|
| Kings | 287 | 376 | 369 | 424 | 287 |
| San Luis Obispo | 533 | 478 | 332 | 271 | 221 |
| Shasta | 310 | 211 | 124 | 94 | 71 |
San Luis Obispo tells a more familiar story, down 59% in residential permits from 2021, declining every year. SLO County's population has been essentially flat since 2019, and its economy is anchored primarily by Cal Poly, a public university with ~23K students. With a median home price above $870,000, the county carries some of coastal California's cost structure without the income base to support new construction.
Shasta County shows the steepest decline. Residential permits are down 77% from 2021, with just 71 issued in 2025. The Redding area has a smaller population base. It also faces wildfire risk that raises insurance costs and dampens development with limited economic drivers to attract new residents. City-level data does show some early signs of recovery in 2025, permit volumes in Redding itself have ticked up from 2024 lows, but at these volumes, the broader county trend remains one of sustained contraction.
The Takeaway: California's residential construction contraction plays out differently depending on where you look. Alameda and the coastal markets face structural constraints that rate cuts alone won't fix. Santa Clara County is the Bay Area's quiet outlier, even as the broader metro struggles. LA's 2025 residential permit rebound can be traced to wildfire rebuilding.
News From California's ADU Boom
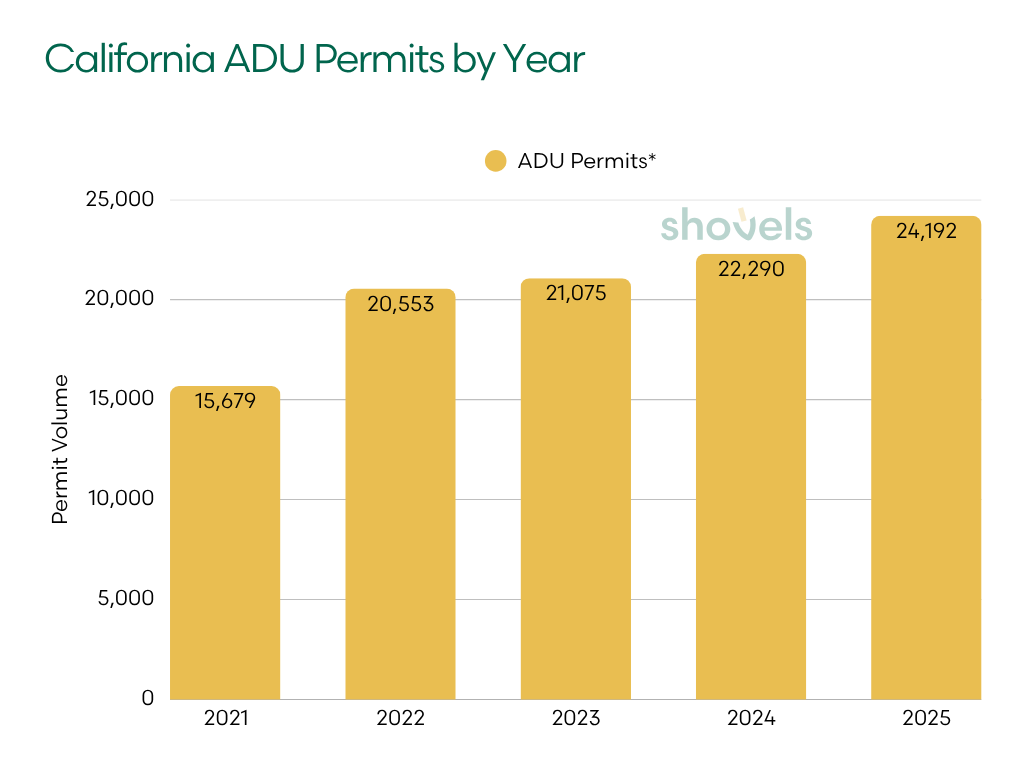
While new construction has been in sustained decline, ADUs tell a very different story. Accessory dwelling units, including backyard cottages, garage conversions, and basement apartments, are one category in our dataset that has grown every year without exception.
Distinct addresses where ADU = True, filtered by issue date with keyword matching on description, type, and subtype. Shovels jurisdictions with consistent YoY data only.
| Year | ADU Addresses* | YoY % |
|---|---|---|
| 2021 | 15,679 | — |
| 2022 | 20,553 | +31.1% |
| 2023 | 21,075 | +2.5% |
| 2024 | 22,290 | +5.8% |
| 2025 | 24,192 | +8.6% |
Up 54.3% over five years, ADU permitting in California has grown steadily — but the pace has cooled considerably since the initial surge. After a 31.1% jump in 2022, year-over-year growth plateaued in the low single digits before re-accelerating to 8.6% in 2025. The boom isn't over, but it has matured into something more measured.
The driver is policy. California passed a sweeping set of ADU reform laws in 2019 and 2020 that eliminated most local barriers to ADU construction. Owner-occupancy requirements were eliminated, setback rules were relaxed, and cities lost the ability to impose many discretionary design constraints.
The impact showed up quickly in permit data. After the initial policy-driven surge, growth cooled to low single digits — but ticked back up to 8.6% in 2025, likely reflecting downstream effects from SB 684 (effective July 2024) and broader legislation like AB 130 and SB 79, which further streamline approvals for attached ADUs and small-lot multifamily projects. The policy pipeline is still adding fuel.
For a more in-depth analysis of ADUs, see: America's ADU Boom: What 2.8 Million Permits Reveal About the Housing Solution
Where Are ADUs Being Built?
Los Angeles is the headliner. At 8,315 ADU addresses in 2025, the city dwarfs every other jurisdiction in the state. That number still needs context: a portion of the 2025 activity is tied to wildfire recovery, with homeowners in the Eaton and Palisades burn zones turning to ADUs as a faster path back to their land while full rebuilds work through permitting. State-level action in early 2025 like fee waivers and expedited approvals for fire survivors also impacted volumes. Some of LA's ADU growth is structural, but some of it is clearly tied to rebuild activity.
| Jurisdiction | 2023 | 2024 | 2025 |
|---|---|---|---|
| Los Angeles (City) | 7,661 | 7,488 | 8,315 |
| Sacramento | 639 | 878 | 997 |
| Oakland | 669 | 632 | 612 |
| Santa Maria | 395 | 525 | 713 |
| Placer County | 306 | 369 | 565 |
Elsewhere, Sacramento stands out with consistent year-over-year growth, up 56% from 2023 to 2025, with momentum building each year. Santa Maria is a quieter story worth watching: it jumped 80% over the same period, driven largely by backyard cottage and multifamily activity in a market starved of new supply.
Oakland is broadly flat year-over-year, which likely reflects permitting pace rather than lack of demand. Placer County shows steady incremental growth consistent with the broader inland Northern California trend.
 Image: Example of an ADU.
ADUs won't solve California's housing shortage on their own. But they are adding supply in places and at price points where traditional construction isn't. Unlike new construction, the trend is moving in the right direction.
The Takeaway: California's ADU growth remains the clearest policy success story in this dataset. The 2019 and 2020 reform laws unlocked a steady stream of new housing units that has compounded every year since. The 2025 re-acceleration to 8.6% growth, after two years of modest gains, suggests newer legislation like SB 684 and AB 130 is beginning to show up in the data.
How Are California's Top Homebuilders Faring?
California's statewide construction slowdown isn't hitting all builders equally. Some have pulled back sharply, while a few are holding steady. Pulte is one that stands out. Their permits have been growing consistently from 2021 through 2024 in a dataset otherwise defined by decline.
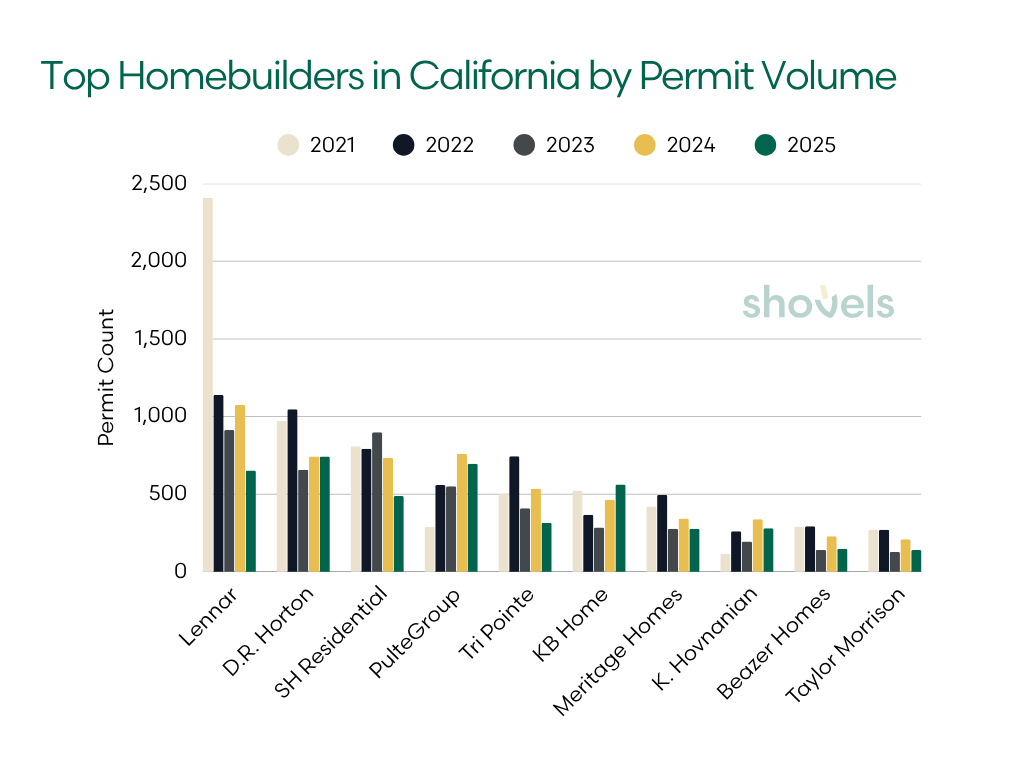
| Builder | 2021 | 2022 | 2023 | 2024 | 2025 | Total |
|---|---|---|---|---|---|---|
| Lennar | 2,408 | 1,139 | 913 | 1,075 | 652 | 6,187 |
| D.R. Horton | 971 | 1,047 | 658 | 743 | 742 | 4,161 |
| SH Residential | 808 | 792 | 899 | 734 | 488 | 3,721 |
| PulteGroup | 291 | 559 | 551 | 761 | 696 | 2,858 |
| Tri Pointe | 505 | 744 | 410 | 535 | 315 | 2,509 |
| KB Home | 523 | 368 | 285 | 464 | 562 | 2,202 |
| Meritage Homes | 421 | 495 | 277 | 344 | 278 | 1,815 |
| K. Hovnanian | 116 | 261 | 195 | 339 | 281 | 1,192 |
| Beazer Homes | 292 | 294 | 141 | 229 | 149 | 1,105 |
| Taylor Morrison | 273 | 271 | 128 | 210 | 140 | 1,022 |
A note on methodology: We group builder entities at the brand level using contractor group IDs, but actual construction activity may be higher. Large national builders frequently file permits through project-specific subsidiaries and LLCs that are not consistently linked to the parent company in permit records. This is particularly the case for Lennar, which operates extensively through master-planned community entities.
Lennar: California's Largest Homebuilder
Lennar operates at a different scale than anyone else on this list. With 6,187 permits over five years, it's nearly 50% more than the next-largest builder. Even after pulling back from its 2022 peak, Lennar still recorded 652 permits in 2025, more than the entire five-year totals of some competitors.
Nationally, Lennar delivered over 82,000 homes in fiscal 2025 and grew year over year. Notably, California is declining while the national business expands. That gap likely reflects a broader geographic rebalancing. Capital and land investment have been shifting toward Sun Belt markets, where lower construction costs and faster entitlement timelines make projects more viable.
KB Home and D.R. Horton: Dip and Recovery
KB Home's California story is a dip-and-recover arc. From 523 permits in 2021, volumes fell sharply to a low of 285 in 2023 before rebounding to 562 in 2025 to a near five-year high. KB Home is historically concentrated in entry-level and move-up housing, the segment most exposed to affordability pressure as rates rose.
Their fiscal 2025 earnings showed the toll of that pressure: diluted EPS fell 27%, even as California permit volumes were recovering. The permit rebound suggests KB is finding ways back into the market despite the affordability headwind.
D.R. Horton's trajectory looks slightly different. Volume held into 2022, then collapsed to a 379-permit low point in 2023 before a modest recovery. The dip coincides with the wind-down of one of their California entities after 2022. This is a structural withdrawal from certain markets, not just a rate-driven pause.
Nationally, D.R. Horton remains the highest-volume homebuilder in the US, sustaining absorption through mortgage buydowns and smaller home formats. That playbook requires accessible price points, which California's cost structure makes difficult, but not impossible.
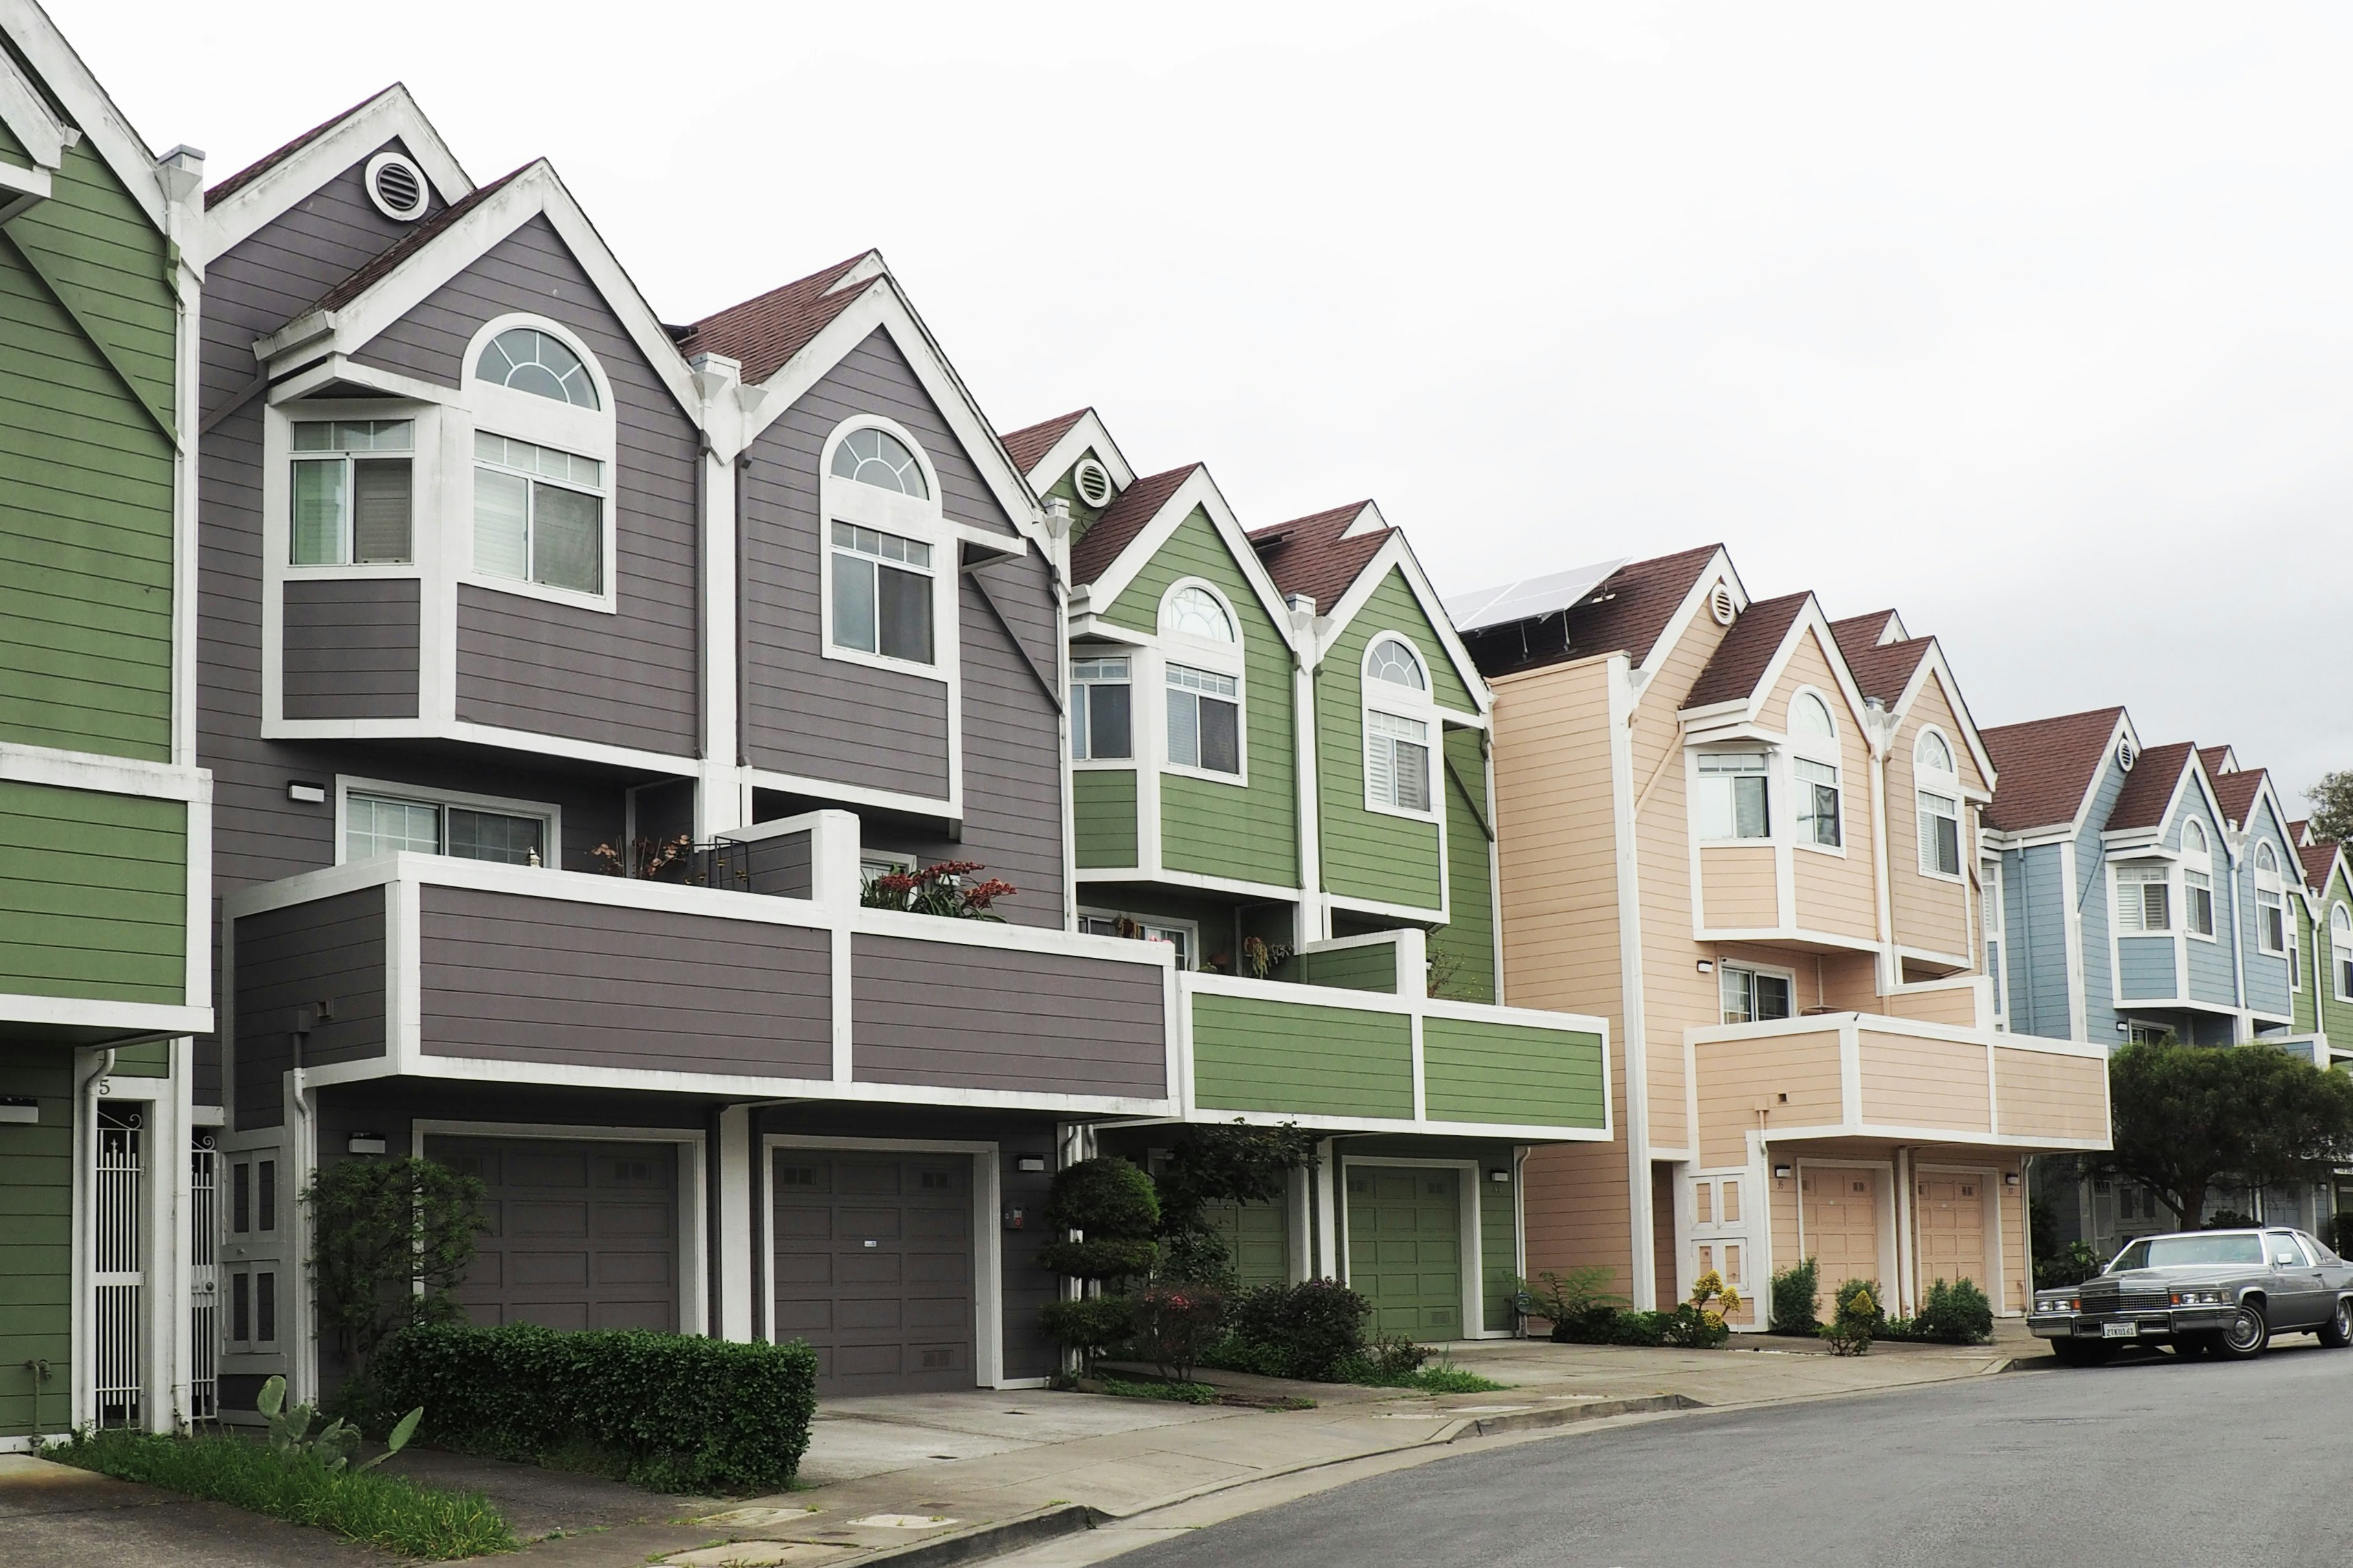 Image: Row of houses in San Francisco.
Taylor Morrison and Tri Pointe: Decline and Retreat
Taylor Morrison and Tri Pointe round out the broad retreat. Taylor Morrison held near 900 permits annually from 2021 through 2024 before collapsing to 372 in 2025. This is the sharpest single-year proportional drop in this dataset.
Tri Pointe, which has a heavier California and West Coast concentration than most national builders, peaked at 945 permits in 2022 before settling into a lower range. The permit data actually called Tri Pointe's delivery slowdown in advance: their 2023–2024 permit decline can be seen in a 22% delivery and revenue drop in mid-2025 roughly 12 to 18 months later.
Pulte: The Move-Up Buyer Exception
Pulte is the exception. From a low base in 2021, permit volumes more than doubled by 2024 and held near that level in 2025. Pulte posted record national results in 2024, driven by move-up and active adult buyers who are less sensitive to rate pressure than entry-level buyers. SH Residential, another mid-tier builder now appearing in the top ten, showed relative stability through 2023 before beginning to pull back, a later inflection than most builders in this dataset.
The Takeaway: Builder divergence mirrors the broader trend. Lennar still leads by scale but has pulled back steadily since 2021 as capital shifts toward more favorable markets. D.R. Horton and KB Home both dipped in 2023 and have since recovered. Pulte is the standout grower, more than doubling permits from 2021 to 2024 on the strength of its move-up buyer base.
Solar Panels, EV Chargers, and Heat Pumps: How the California Home Is Changing
A California home today looks different than it did five years ago, not in layout or price, but what powers it. Three permit categories make that clear. Solar installations dropped sharply after a policy shift rewrote the economics, EV chargers have become standard through code, and heat pumps are steadily replacing gas. The three trends demonstrate how rate policy, building codes, and efficiency standards are reshaping the California home.
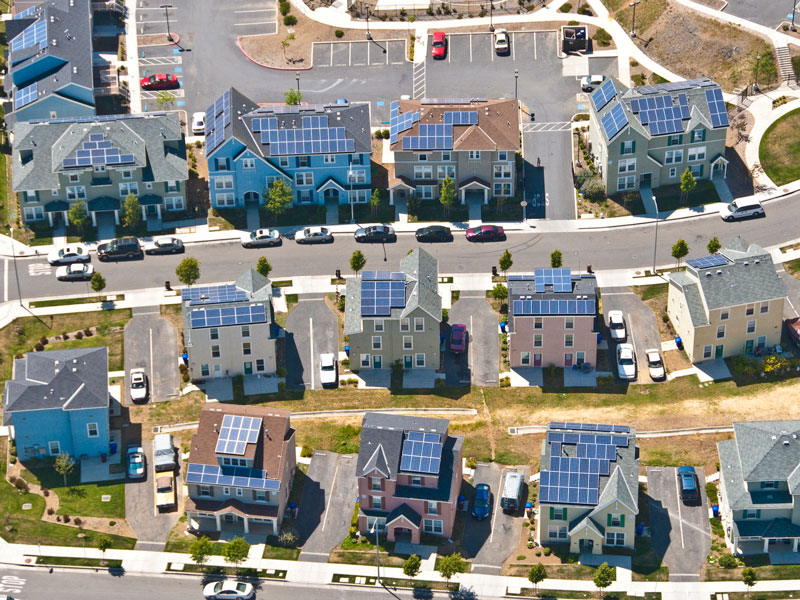 Image: California homes with solar panels. Source: theneweconomy.com
The NEM 3.0 Effect on California Solar Permits
Solar was the defining feature of a new California home for years, and a strong economic decision. Historically, the state's Net Energy Metering policy let homeowners sell excess solar power back to the grid at near-retail rates, bringing payback periods down to six years or less in many cases.
Policy, however, shifted in the last five years. The California Public Utilities Commission replaced that structure with Net Energy Metering (NEM) 3.0 in April 2023, cutting export rates by roughly 75%. Payback periods effectively doubled overnight. The policy was designed to make the grid more efficient. Its side effect was gutting rooftop solar's value proposition for the typical homeowner.
The permit data shows what happened next.
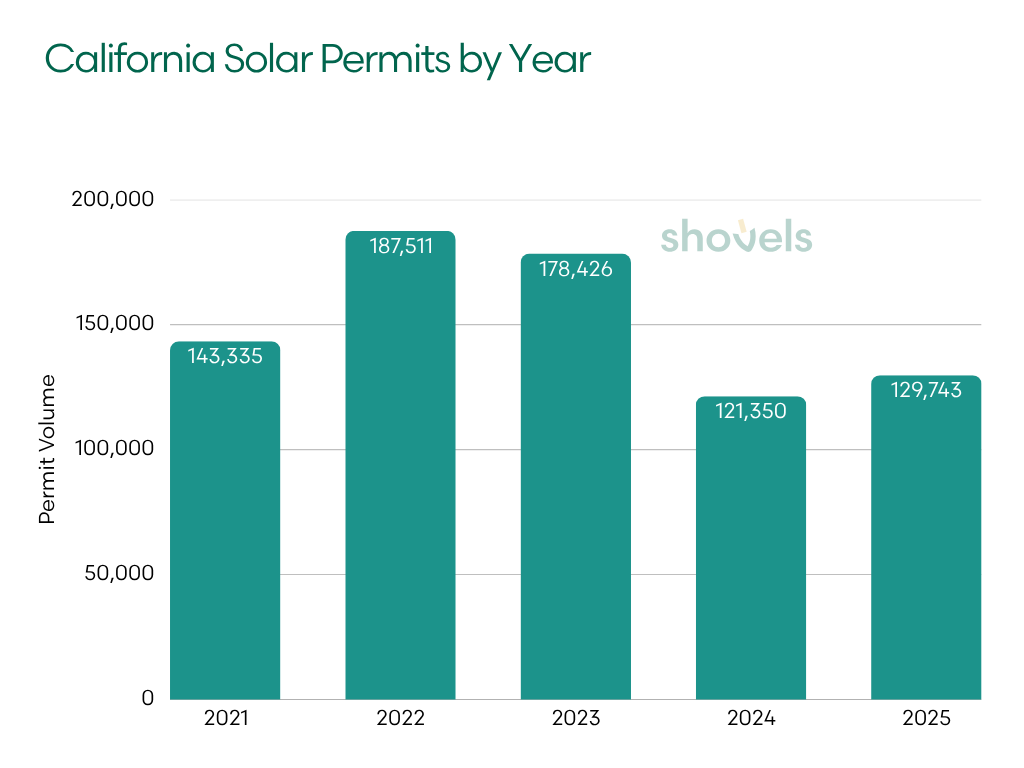
| Year | Solar Permits | YoY % |
|---|---|---|
| 2021 | 143,335 | — |
| 2022 | 187,511 | +30.8% |
| 2023 | 178,426 | −4.8% |
| 2024 | 121,350 | −32.0% |
| 2025 | 129,743 | +6.9% |
The annual numbers spotlight a steep drop-off in 2023. The monthly data is even more revealing. March 2023 hit 24,155 permits, indicating a rush to grandfather in installations before the new rates took effect. Once NEM 3.0 went live in April 2023, volumes fell by nearly half and stayed there.
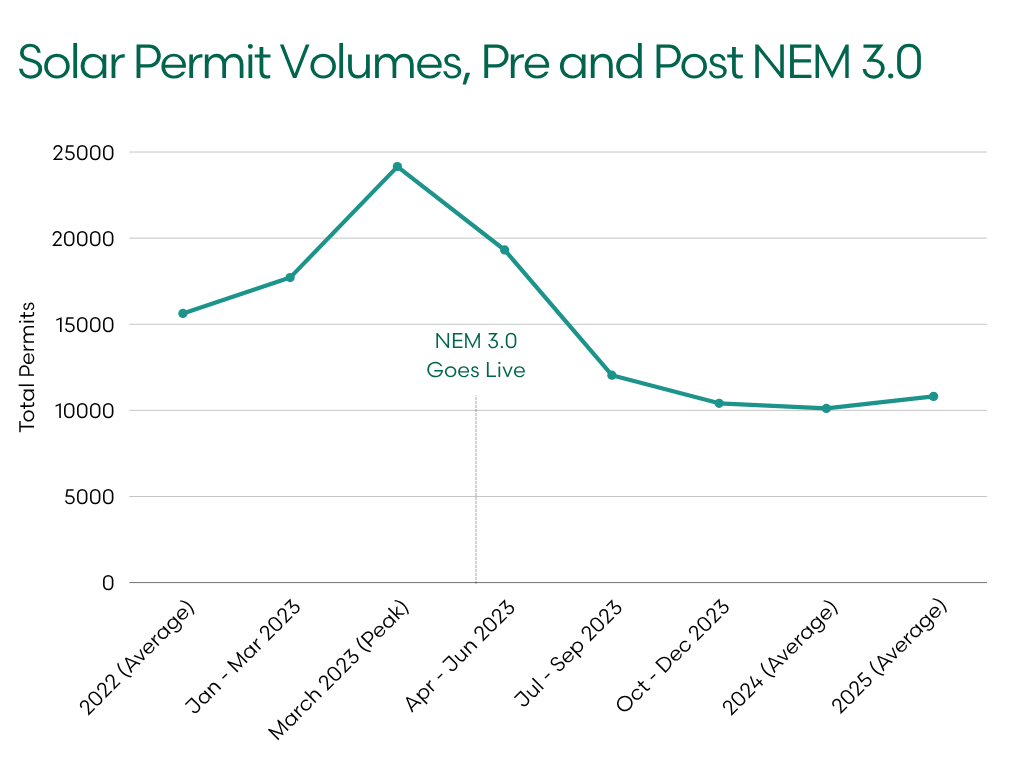
| Period | Avg Monthly Permits | Note |
|---|---|---|
| 2022 full year | ~15,626 | Baseline boom |
| 2023 Jan–Mar | ~17,710 | Pre-deadline rush |
| 2023 Mar (peak) | 24,155 | Highest single month in dataset |
| 2023 Apr–Jun | ~19,312 | Still elevated, permits filed before cutoff |
| 2023 Jul–Sep | ~12,044 | Cliff begins |
| 2023 Oct–Dec | ~10,410 | New normal emerges |
| 2024 full year | ~10,113 | Stabilized floor |
| 2025 full year | ~10,812 | Slight recovery |
Solar has found a floor around 10,100–10,800 permits per month, roughly 31% below the 2022 run rate, with a slight uptick in 2025. Some homes being built today still embrace solar, but the calculation has changed. Batteries and self-consumption now matter more than grid export.
California EV Charger Permits: A Code-Driven Surge
While policy curbed solar adoption, EV infrastructure benefited from California's building codes. The state's 2022 Building Code mandated EV-ready infrastructure at all new residential and non-residential construction starting January 1, 2023. From that point on, every new home permit had to include charger capacity, no exceptions.
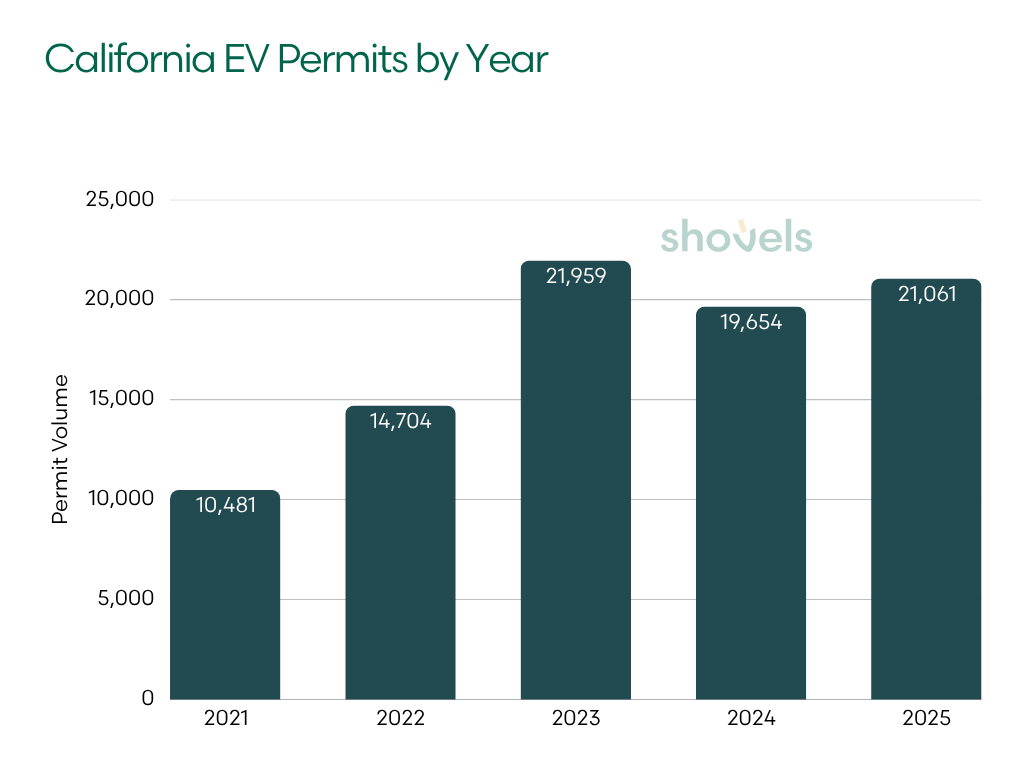
| Year | EV Charger Permits | YoY % |
|---|---|---|
| 2021 | 10,481 | — |
| 2022 | 14,704 | +40.3% |
| 2023 | 21,959 | +49.3% |
| 2024 | 19,654 | −10.5% |
| 2025 | 21,061 | +7.2% |
The 2023 spike lines up almost exactly with the code's effective date. The 2024 dip likely represents a normalization period after the mandate-driven surge. By 2025, growth returns, spurred by ongoing code requirements and the rising number of EV owners.
California still leads the country in EV adoption, and at this point, EV infrastructure is standard equipment in new housing. The 2025 CalGreen code taking effect January 1, 2026 also expands requirements further. If the 2023 pattern holds, growth will continue.
Heat Pump Permits: California's Quiet Electrification Story
The third piece of the puzzle is the one that gets the least coverage. Heat pump permits, covering both space heating and water heating, have grown every single year since 2021.
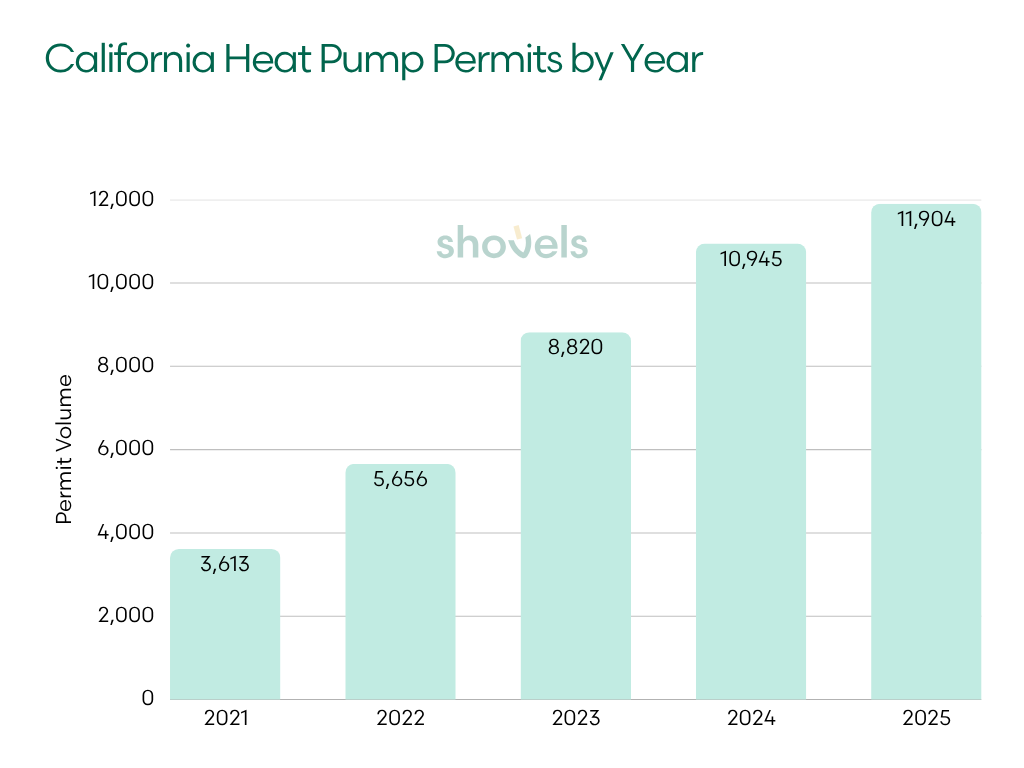
| Year | Heat Pump Permits | YoY % |
|---|---|---|
| 2021 | 3,613 | — |
| 2022 | 5,656 | +56.5% |
| 2023 | 8,820 | +55.9% |
| 2024 | 10,945 | +24.1% |
| 2025 | 11,904 | +8.8% |
In the last three years, the rate of increase has been slowing. This is typical of a market maturing from early adoption into mainstream deployment. But the absolute numbers are still rising.
The driver of this increase is California's building codes. Title 24 mandates electrification for new construction, and the 2025 California Energy Commission standards now require heat pumps as the default for space and water heating in most new residential builds. Nationally, heat pumps surpassed gas furnace shipments for the first time in 2024, and the state has set a target of six million heat pump installations by 2030.
As with solar, heat pump growth demonstrates the impact of policy. Solar permits fell in response to a policy that changed the economics. Heat pump permits have more than tripled over the same period, boosted by a policy that tightened requirements.
The Takeaway: These three trends describe the same home: one that's less likely to rely on solar energy, more likely to have an EV in the garage, and heats entirely by electricity. California is building fewer homes than it needs, but the new homes meet a fundamentally different standard than they did five years ago.
How Long Does It Take to Get a Building Permit in California?
Getting a building permit approved in California can take anywhere from a few weeks to nearly two years, and the difference has less to do with your project than with your zip code.
To arrive at the figures below, we measured the median number of days from permit filing to issuance, across 213 California jurisdictions with sufficient permit volume (at least 50 residential new construction permits issued in a given year). We use the median rather than the average because a small number of extreme cases, permits stuck in review for 500 days or more, would otherwise distort the picture. Same-day approvals are also excluded, as these typically reflect administrative processing rather than a genuine review cycle.
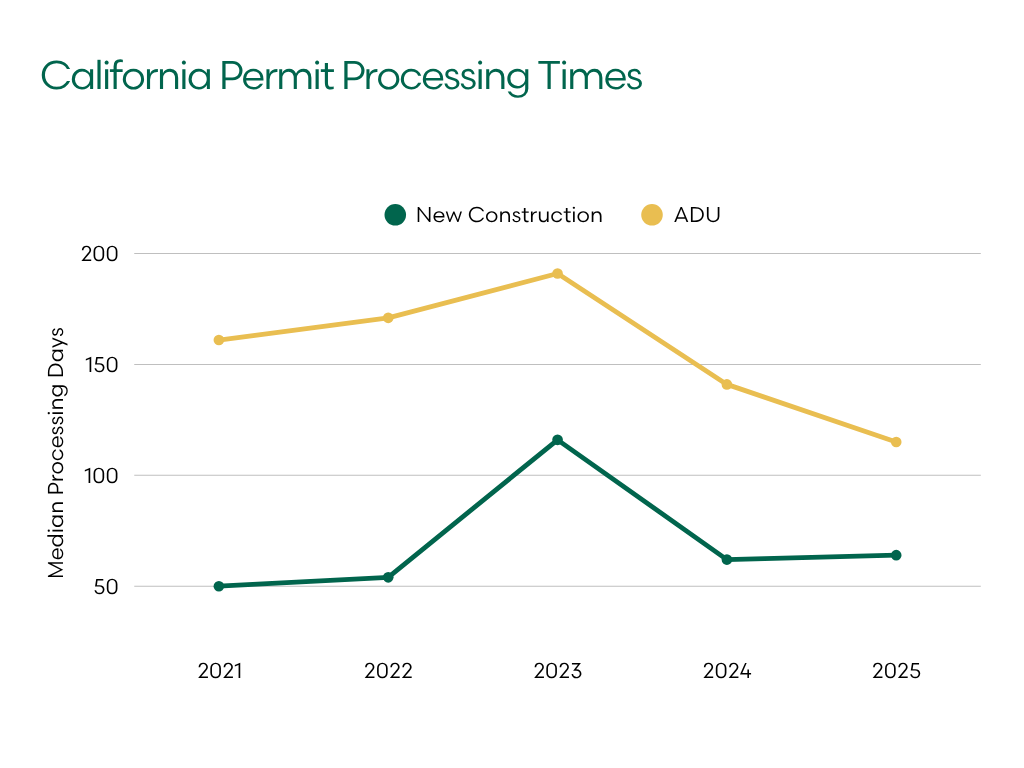
| Year | Residential New Construction | ADU |
|---|---|---|
| 2021 | 50 days | 161 days |
| 2022 | 54 days | 171 days |
| 2023 | 116 days | 191 days |
| 2024 | 62 days | 147 days |
| 2025 | 64 days | 115 days |
2023 represents the outlier. Pandemic-era staffing backlogs peaked across multiple major metros in 2023, pushing statewide medians sharply higher. By 2025, most had recovered significantly.
In LA specifically, the January 2025 wildfires added some pressure on the permitting system, but also triggered emergency streamlining measures that have allowed the city to process rebuild permits at nearly three times the normal pace, a reminder that when the political will exists, approval timelines can move fast.
ADUs Mean Longer Timelines
One finding is also clear: ADU permits take significantly longer than standard residential construction. In 2025, the typical ADU took 115 days to get approved. This is nearly twice the 64-day median for a standard residential permit. California state law technically requires local agencies to approve or deny ADU applications within 60 days, but that clock only starts once an application is deemed complete. In practice, most homeowners report the full process taking four to six months, accounting for back-and-forth on revisions.
The gap here is structural, not incidental. ADU applications involve a broader set of reviews that don't apply to standard new construction: lot coverage calculations, setback restrictions, utility connection requirements, owner-occupancy determinations, and in many jurisdictions, additional environmental review. That complexity adds time at every step.
Where You Build Matters
The inland-versus-coastal divide is one of the most consistent patterns in California permitting data. Inland jurisdictions in the Inland Empire and Central Valley tend to process permits fastest. Coastal metros, particularly in the Bay Area, South Bay, and Southern California coast, run slowest.
Our data confirms the pattern at scale. Here are the fastest and slowest jurisdictions in California for residential new construction permits issued in 2025:
Fastest California Jurisdictions in 2025
| Jurisdiction | Median Days (Residential + ADUs) |
|---|---|
| Chino Hills | 9 |
| Clovis | 15 |
| Daly City | 19 |
| Lake Elsinore | 19 |
| Corona | 21 |
Slowest California Jurisdictions in 2025
| Jurisdiction | Median Days (Residential + ADUs) |
|---|---|
| Pasadena | 305 |
| Poway | 338 |
| El Monte | 388 |
| Santa Maria | 574 |
| Milpitas | 600 |
The spread between the fastest and slowest is 67x. Every jurisdiction in the fastest table is inland. Every jurisdiction in the slowest is coastal or near-coastal.
For ADUs, this gap is even more pronounced. A 2024 study by UC Berkeley's Terner Center found that ADU applications in Los Angeles's Coastal Zone took an average of 260 days to be permitted, compared to 147 days for properties outside the zone.
The Takeaway: ADUs take nearly twice as long as standard residential permits. Coastal jurisdictions operate on timelines that are years longer than their inland counterparts.
What California Building Permit Data Indicates for Builders, Buyers, and Sellers
For builders, California has found a floor, but a low one. New construction is running 21% below the 2022 peak and has been essentially flat for two straight years. The markets still worth entering are increasingly specific. Permit timelines are as material as land costs. Nine days in Chino Hills versus 600 in Milpitas represents an entirely different project economics. The homes being built today require EV infrastructure and heat pumps by code. ADU volumes, not just new construction, are where the forward signal is clearest right now.
For sellers, the lock-in effect dominates. Homeowners who refinanced at 2021 rates have had little incentive to sell into a 7% market, and that compression in existing inventory has been a structural feature of the California market for two years. Permit data signals what's coming on the supply side: builder pullbacks in coastal markets are limiting new construction pressure. Wildfire rebuilds are moving through permitting in LA and will add supply in specific corridors over the next two to three years.
For buyers, the most useful thing this data tells you is where supply is, and isn't, coming. Coastal California markets have seen builder pullbacks across the board, which means fewer new homes competing with existing inventory, but also fewer options. The markets where supply is still moving include the Inland Empire and Central Valley. Here, construction activity has held up better and permit timelines are shorter. If you're open to those markets, the pipeline is meaningfully better. The rate lock-in for sellers continues to present a problem. Most of those homeowners aren't moving until rates come down.
For service providers and vendors, the electrification shift is the most actionable signal in this dataset. Heat pump permits are up 195% over five years. EV charger permits have nearly doubled. A new CalGreen cycle takes effect January 1, 2026. If your business touches HVAC, electrical, or solar installation, the demand signals are already in the permit data, and they're moving fast enough.
Frequently Asked Questions
How many new construction permits were issued in California in 2025?
California issued 42,640 total new construction permits in 2025 across the jurisdictions tracked by Shovels, down just 0.3% from the prior year. Residential permits were essentially flat at 34,723, representing a 0.8% decline. While this reflects Shovels' coverage of 213 California jurisdictions (roughly 75% of total state permit activity), the directional signal is consistent: the sharp 20% contraction of 2023 has stabilized into a new, lower baseline.
Why did California solar permits drop so sharply after 2023?
California solar permits fell 32% in 2024 after the California Public Utilities Commission replaced Net Energy Metering (NEM 2.0) with NEM 3.0 in April 2023, cutting export rates by roughly 75%. This effectively doubled payback periods for rooftop solar, gutting its value proposition for the typical homeowner. A pre-deadline rush in March 2023 pushed monthly permits to 24,155, the highest single month in the dataset, before volumes dropped by nearly half once the new rates took effect.
How long does it take to get a building permit in California?
Permit processing times vary significantly by jurisdiction. The statewide median for residential new construction was 64 days in 2025, but inland jurisdictions like Chino Hills process permits in as few as 9 days while coastal cities like Milpitas take up to 600 days. ADUs take nearly twice as long as standard residential permits, with a statewide median of 115 days in 2025, due to additional reviews around lot coverage, setbacks, and utility connections.
What is driving ADU growth in California?
California ADU permits grew 54.3% from 2021 to 2025, reaching 24,192 ADU addresses in 2025. The primary driver is policy: the 2019 and 2020 ADU reform laws eliminated owner-occupancy requirements, relaxed setback rules, and removed most local discretionary design constraints. The 2025 re-acceleration to 8.6% growth, after two years of slower gains, suggests newer legislation like SB 684 and AB 130 is beginning to show up in the data.
Which California homebuilder has the most building permits?
Lennar is California's largest homebuilder by permit volume, with 6,187 permits across the five-year dataset, nearly 50% more than the next-largest builder. However, Lennar has pulled back significantly, down 73% from its 2021 peak to 652 permits in 2025, as capital and land investment shift toward lower-cost Sun Belt markets. PulteGroup is the standout grower in the dataset, more than doubling permits from 2021 to 2024 by focusing on move-up and active adult buyers who are less sensitive to interest rate pressure.
Want to explore California's permit data? We offer permit data across hundreds of California jurisdictions. Contact our team to learn how Shovels can power your market analysis.