
Since 2022, hyperscale developers have filed building permits for 214 data center projects across 21 states and 43 metro areas. Northern Virginia and Silicon Valley still dominate the map, but permit data shows the geography of AI infrastructure widening beyond the industry’s traditional hubs.
New markets are popping up before projects are formally announced. Existing markets are beginning to push back. Across the country, local governments are making deliberate decisions about whether to attract, slow, or halt hyperscale development.
That shift is turning AI infrastructure into a local governance story as much as a land and power story. Some jurisdictions are clearing the path with pre-zoned industrial corridors, expedited permitting systems, overlay districts, and utility coordination efforts. Others are introducing new restrictions, delaying approvals, or rejecting projects outright as concerns around power demand, water use, and land consumption grow.
By pairing building permit data with municipal decisions data from Shovels Decisions, our new report looks at where data centers are being built, which markets are actively competing for AI infrastructure, and which ones are pushing back against development.
Key Takeaways
- Virginia still dominates: The DC Metro accounts for 31% of all data center projects tracked since 2022, with 67 of 214 total. The region has also bred a specialized contractor ecosystem: top firms like HITT Contracting and Holder Construction Group pull the vast majority of their data center permits there.
- Speed is becoming a competitive advantage: Jurisdictions that pre-clear land use and invest in developer-friendly infrastructure can issue building permits the same day they're filed.
- New markets are emerging fast: Cedar Rapids jumped from zero to 7 permits and more than $3 billion in declared project value in under two years.
- Local politics increasingly shape growth: Cities are adopting expedited pathways, overlay zones, moratoriums, and zoning rewrites specifically targeting data center development.
- Power is still the central constraint: Grid interconnection timelines now stretch years beyond the permit process itself.
Methodology
This analysis is based on building permits related to data center projects filed between January 2022 and May 2026 within Shovels' coverage area:
How we define data center projects:
- Permits are connected to data center projects through keyword matching against permit description text: phrases like "data center," "data hall," and "server vault."
- Counts throughout this report represent distinct construction projects, not individual permit filings. Permits are deduplicated by address to avoid counting multiple sub-permits filed for the same construction project.
- Only permits classified as new construction are counted. Most remodels are excluded. Supporting permits, such as electrical and demolition filings, are considered sub-permits for one data center project and not counted separately.
How we define approval times:
- Approval time is measured as the number of days between a permit's filing date and issue date.
- We use the median rather than the average to reduce skew from outliers.
Municipal decisions data is sourced from Shovels Decisions, a separate dataset tracking zoning votes, planning commission rulings, moratoriums, and land use decisions across US jurisdictions.
The Buildout Is Concentrated, but the State Map Is Starting to Shift
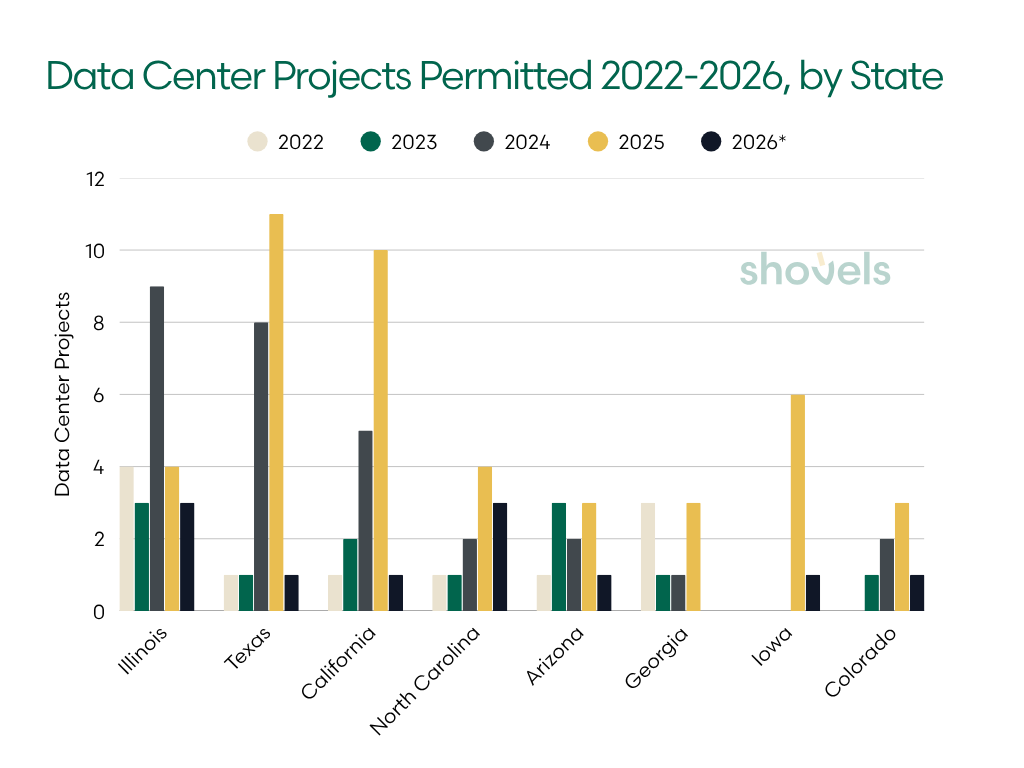
For the past few years, Northern Virginia has dominated the American data center boom. Virginia has recorded permits for 67 data center projects since 2022, nearly three times the next closest state. Illinois ranked second, followed by Texas and California. Together, those four states accounted for the majority of large-scale data center construction activity in the Shovels dataset.
This map shows data center projects permitted between 2020 and May 2026.
But the state rankings only tell part of the story. The more important shift is where new growth is beginning to surface. The year-by-year breakdown shows how recently some of these markets emerged and accelerated.
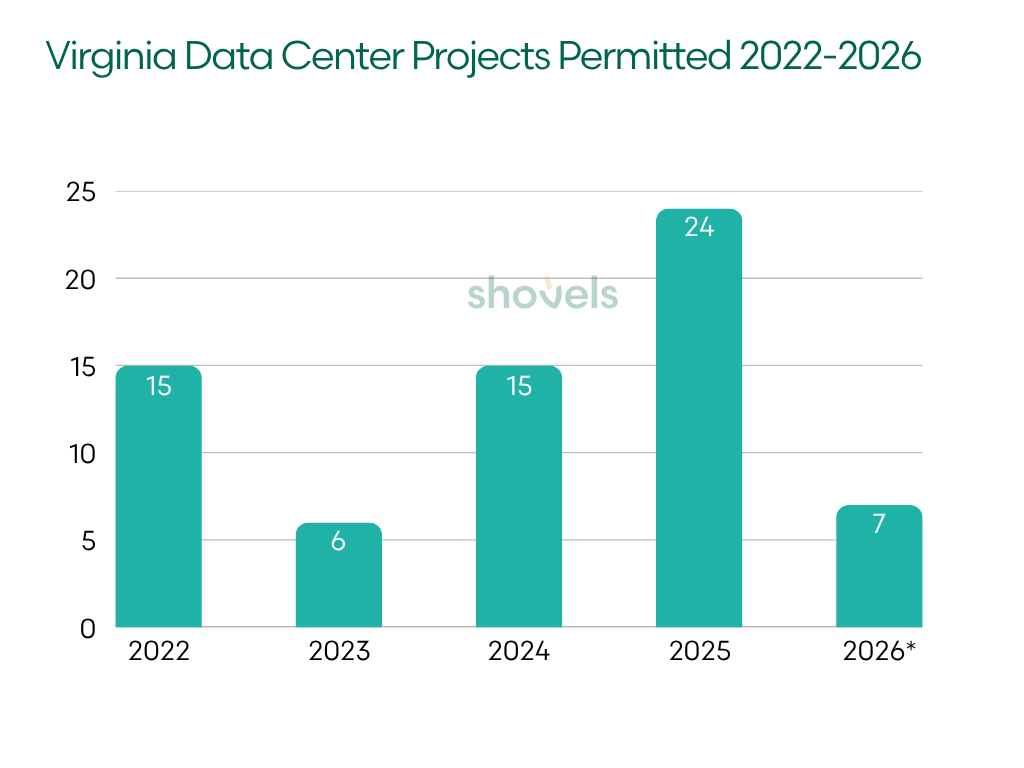
Virginia is still dominating growth. The state added 24 data center projects in 2025. Most of that activity concentrated in Loudoun, Prince William, and Fairfax counties at the heart of "Data Center Alley."
 2026 is a partial year, includes permits in our database issued before May 2026 only.
 2026 is a partial year, includes permits in our database issued before May 2026 only.
| State | 2022 | 2023 | 2024 | 2025 | 2026* | Total |
|---|---|---|---|---|---|---|
| Virginia | 15 | 6 | 15 | 24 | 7 | 67 |
| Illinois | 4 | 3 | 9 | 4 | 3 | 23 |
| Texas | 1 | 1 | 8 | 11 | 1 | 22 |
| California | 1 | 2 | 5 | 10 | 1 | 19 |
| North Carolina | 1 | 1 | 2 | 4 | 3 | 11 |
| Arizona | 1 | 3 | 2 | 3 | 1 | 10 |
| Georgia | 3 | 1 | 1 | 3 | — | 8 |
| Iowa | — | — | — | 6 | 1 | 7 |
| Colorado | — | 1 | 2 | 3 | 1 | 7 |
North Carolina recorded just one project in all of 2023, then rose steadily to two in 2024 and four in 2025, with the Hickory-Forest City corridor driving most of the growth. The acceleration has continued into 2026. It's a corridor seeing broader growth, too: the top 25 US homebuilders pulled the second-most permits per capita here of any metro.
Iowa recorded zero permitted projects in 2022, 2023, and 2024. Then the state suddenly added 6 projects and more than $3 billion in declared project value in a single year. Texas followed a similar pattern, logging just one project in all of 2023 before jumping to 8 in 2024 and 11 in 2025. And while California generated fewer projects overall, its count grew tenfold between 2022 and 2025.
Illinois is moving the other direction. Permit activity peaked in 2024 and has declined since, dropping to 4 projects in 2025. It is the only top-five state showing a downward trend. As we will see, this is due to a combination of several factors, including a decision to focus on a few large-scale projects and growing political resistance in some Chicago suburbs.
At the same time, several states remained relatively quiet despite available land and surging national demand for AI infrastructure. In many cases, the limiting factor was not developer interest itself, but utility constraints, political resistance, or extended review processes that slowed projects before permits were ever filed.
The Metro Race Is About Speed and Friction
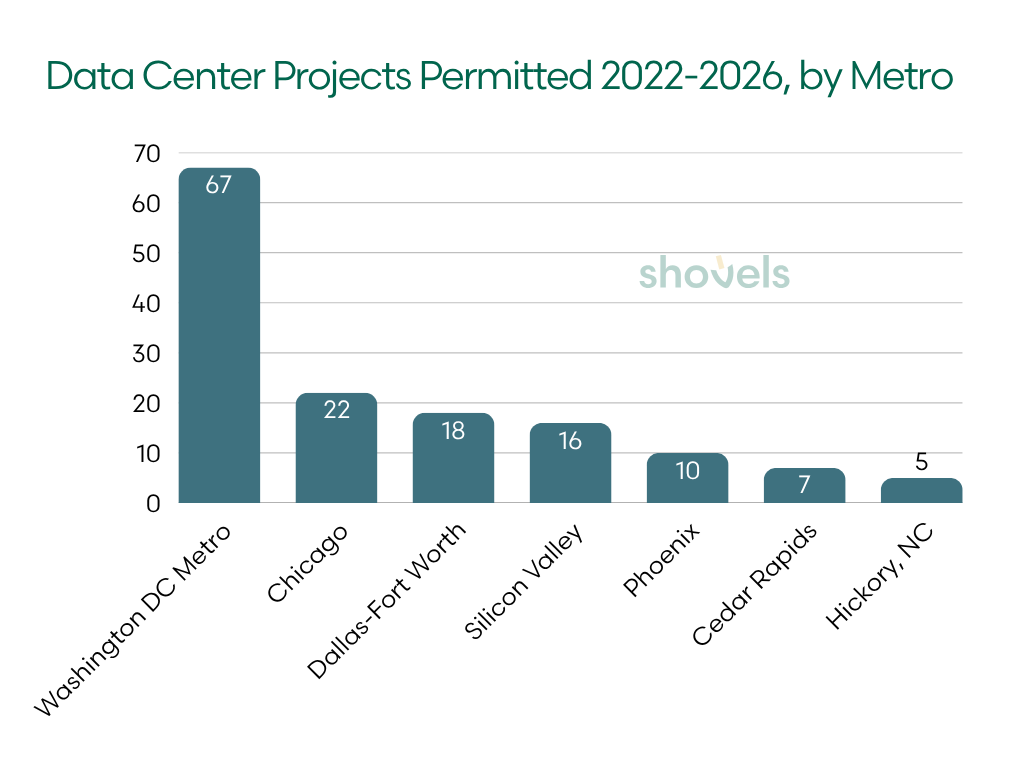
The seven metros below account for about two-thirds of all data center projects in the dataset, with the DC Metro alone accounting for nearly a third.
As hyperscale developers scout for new sites, speed is a clear competitive advantage. Median approval times range from same-day to 106 days, a gap led primarily by upstream policy decisions.
| Metro | Permits | Median approval (days) | % Same-day |
|---|---|---|---|
| Washington DC Metro | 67 | 106 days | 16% |
| Chicago | 22 | same-day | 57% |
| Dallas-Fort Worth | 18 | same-day | 80% |
| Silicon Valley | 16 | same-day | 67% |
| Phoenix | 10 | same-day | 100% |
| Cedar Rapids | 7 | 42 days | 0% |
| Hickory, NC | 5 | 6 days | 20% |
For projects at this scale, fast permit approvals usually reflect years of upstream municipal planning decisions: pre-zoned industrial land, utility coordination, environmental review frameworks, and political alignment around infrastructure growth.
As we’ve found, permit approval speeds increasingly reflect favorability and local support for large-scale AI infrastructure. Speedier approvals indicate local governments actively removing obstacles, while lengthier reviews usually indicate pushback from the community and more oversight.
What Same-Day Approvals Actually Mean
Often, same-day approvals indicate that a project has already cleared all upstream hurdles. By the time a permit reaches the building department, most major policy questions have already been resolved.
Chicago's same-day median approvals are a prime example. When we looked at individual approval times, we traced the same-day permits exclusively to Elk Grove Village.
The suburb has spent years assembling land, pre-zoning industrial corridors, and positioning itself as a data center hub around O’Hare. Today it hosts more than 20 data centers, supported by a same-day online permitting system designed for large commercial projects. The village describes its approach as "Beyond Business Friendly", streamlining permitting and plan review so companies can build immediately.
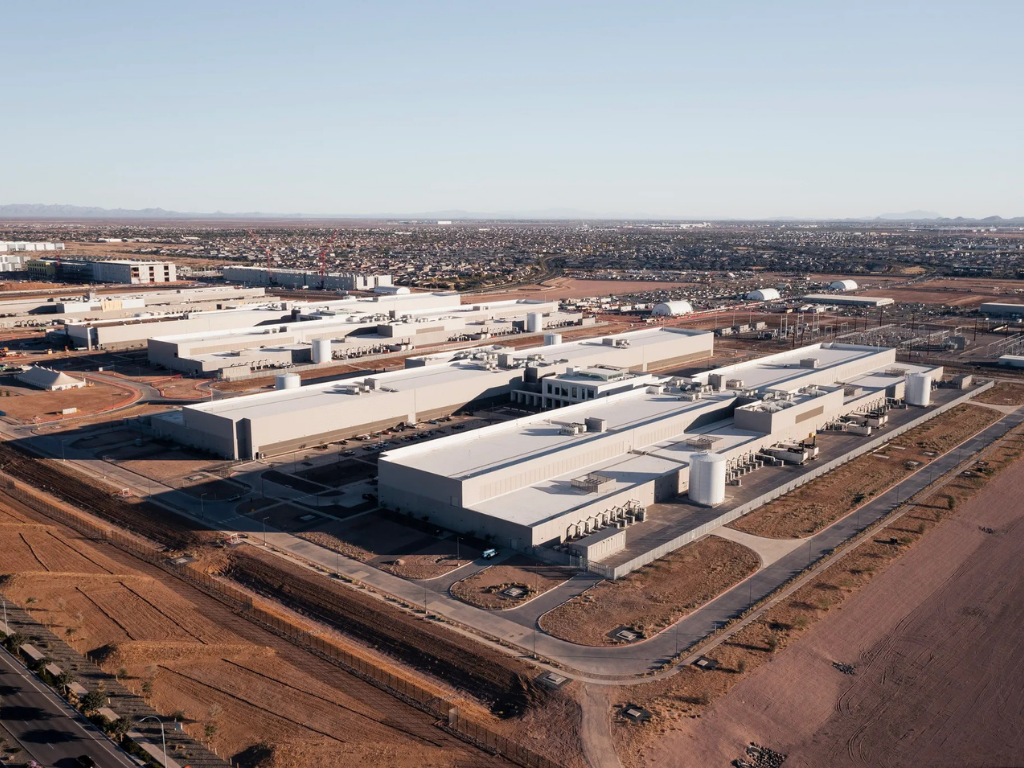 Meta’s data center in Mesa, Arizona. Credit: Meta.
Fort Worth has also adopted a similar approach. Through the city’s X Team expedited review program, large commercial projects can pay for a dedicated coordinator who resolves plan issues in real time instead of through long review cycles. Projects that have already cleared zoning can receive same-day building permits.
Phoenix follows a different model but reaches a similar outcome. Developers often secure approvals at the campus level first, allowing later construction phases to move rapidly through permitting. NTT's 102-acre Mesa campus is a good example: once the master plan was approved, subsequent phase permits were fast-tracked because the major policy decisions had already been made upstream.
The lesson is clear. Municipalities that can complete utilities, zoning, and infrastructure planning earlier can accelerate hyperscale projects through construction.
Northern Virginia Shows What Mature Friction Looks Like
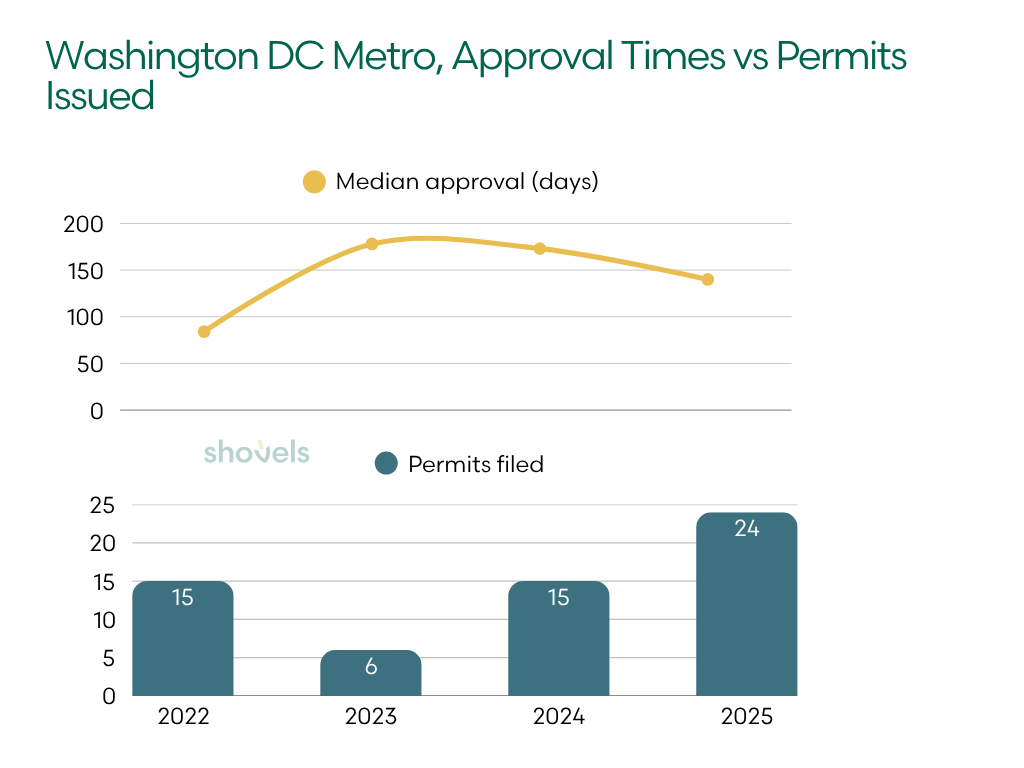
The DC Metro reveals what happens when governments implement a more complex review process. The area's median building permit approval stretched to 173 days in 2024, up from 84 days in 2022. Fairfax County added mandatory design reviews and larger diesel generator buffers, while Loudoun County removed by-right approval for most data center projects.
| Year | Median Approval (days) | Permits filed |
|---|---|---|
| 2022 | 84 | 15 |
| 2023 | 178 | 6 |
| 2024 | 173 | 15 |
| 2025 | 140 | 24 |
The permit data reflected those policy changes almost immediately. Median approval timelines more than doubled between 2022 and 2024 as utility coordination requirements expanded and local review layers multiplied.
But the data also showed how quickly developers adapted. By 2025, approval timelines fell again as operators increasingly front-loaded entitlement work, utility negotiations, and infrastructure coordination before permits were filed.
Importantly, more friction only temporarily slowed overall construction activity. Northern Virginia still recorded 24 projects in 2025, the highest single-year total in the dataset.
The region’s scale might explain why. Mature infrastructure ecosystems can absorb more regulatory complexity because developers, utilities, contractors, and municipalities already understand how to work within them.
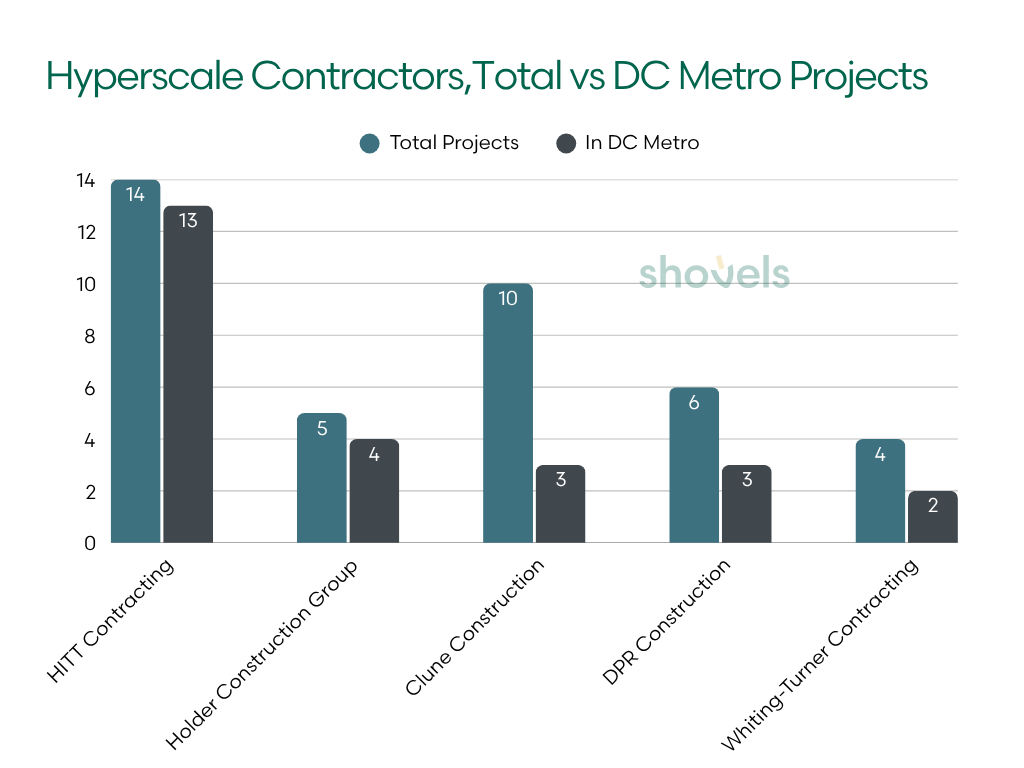
The contractor data makes this clear: HITT Contracting pulled 13 of its 14 data center permits in the DC Metro, and Holder Construction Group pulled 4 of its 5 there, firms that have built their practices almost entirely around Northern Virginia's hyperscale ecosystem.
| Contractor | Total Projects | In DC Metro |
|---|---|---|
| HITT Contracting | 14 | 13 |
| Holder Construction Group | 5 | 4 |
| Clune Construction | 10 | 3 |
| DPR Construction | 6 | 3 |
| Whiting-Turner Contracting | 4 | 2 |
In newer markets, similar friction might redirect projects elsewhere entirely, in part because those markets haven't yet built the same contractor depth. The distinction matters more as developers evaluate where future expansion remains politically and operationally viable.
Even within the country’s dominant AI infrastructure corridor, local governments are becoming more selective about how and where hyperscale growth happens.
Local Politics Is Becoming Infrastructure Policy
As AI infrastructure expands, municipalities are increasingly responding in three ways:
| Municipal Approach | Typical Strategy |
|---|---|
| Acceleration | Overlay zones, expedited reviews, utility coordination |
| Managed growth | Additional review layers, phased approvals, design requirements |
| Restriction | Moratoriums, zoning freezes, project denials |
The first two are visible in permit data. The third, however, is only visible in zoning votes and planning commission decisions that block data center development. Here’s what we found when we dug into municipal zoning and land use decisions.
Project-Level Resistance Is Widespread
The most obvious conflicts happen at the project level. They indicate concentrated pushback against single projects, not all data center proposals.
For example, in January 2026, the Naperville City Council (also a Chicago suburb) voted 6-1 against a proposed 36-megawatt data center on the former Nokia campus after residents raised concerns about diesel generators, electricity demand, noise, and development pace.
In Caroline County, Virginia, officials rejected several large-scale proposals, including a 1.6 million-square-foot Avaio Digital proposal, even as neighboring campuses, like CleanArc’s $3 billion Hyperscale Campus, continued moving forward.
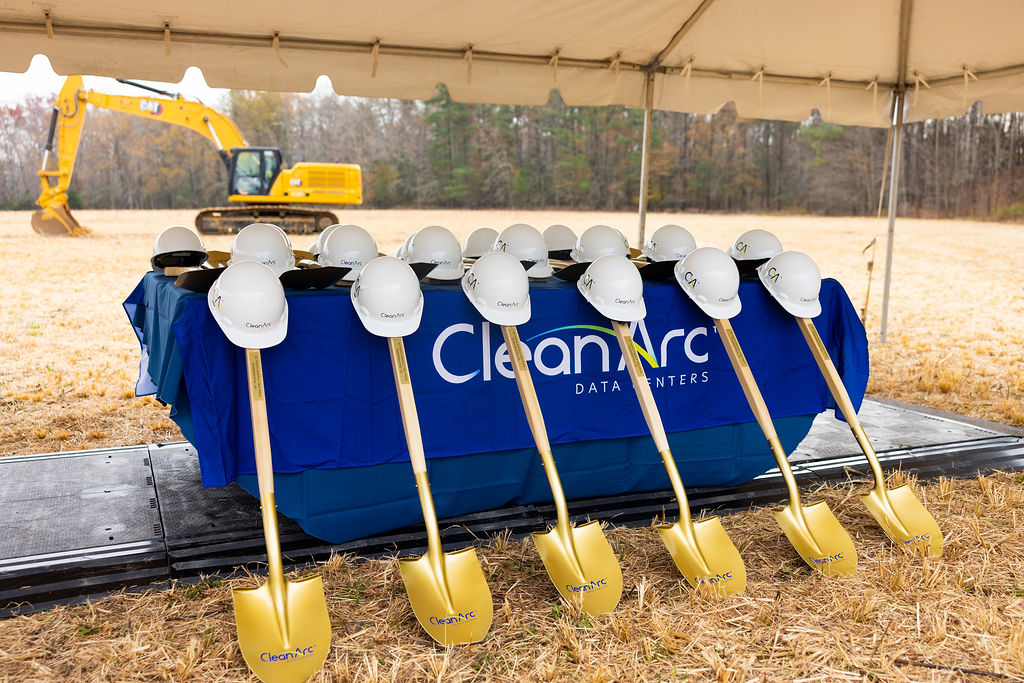 CleanArc broke ground on its 900MW Flagship Hyperscale Campus in Caroline County. Credit: CleanArc
Developers are building some of the largest AI infrastructure projects in the country there, but they’re evaluated on a project-by-project basis. Concerns around transmission infrastructure, water usage, and agricultural land conversion repeatedly surfaced in hearings and planning discussions.
These debates capture a broader shift: local governments are beginning to treat hyperscale infrastructure as a long-term land use and utility planning issue rather than simply another industrial project category.
Moratoriums and Class-Wide Pauses Are on the Rise
Some municipalities are taking a broader approach by temporarily freezing the entire asset class while rules catch up.
Cities and counties including Tulsa, Madison, Lowell, Birmingham, Tallmadge, Malden, and Caledonia Township all enacted moratoriums, temporary suspensions, or zoning freezes tied specifically to data center development.
| Municipality | Action | Primary Concern |
|---|---|---|
| Tulsa, OK | 365-day moratorium | Power and water demand |
| Madison, WI | Temporary moratorium | Energy and water consumption |
| Lowell, MA | 360-day moratorium | Noise and environmental impacts |
| Birmingham, AL | Temporary suspension | High energy and water use |
| Tallmadge, OH | 6-month moratorium | Long-term land use impacts |
| Malden, MA | 1-year moratorium | Infrastructure and public health |
| Caledonia Township, MI | Zoning freeze | Power and acreage requirements |
Across the board, the same concerns appeared repeatedly: electricity demand, water consumption, diesel generator noise, and infrastructure strain.
What began as isolated project disputes is increasingly turning into policy trends. Cities in multiple states are now rewriting zoning codes specifically around data center growth. Data Center Watch tracked $64 billion in US data center projects that have been blocked or delayed by local opposition.
Some Municipalities Are Competing for Buildouts
That said, not every municipality is reacting defensively.
As noted earlier, Elk Grove Village spent years building infrastructure and permitting systems specifically designed to attract large-scale operators. Provo, Utah also established a Data Center Overlay Zone that channels development into pre-approved infrastructure corridors with defined utility and water requirements.
These decisions create compounding effects over time. Utilities plan around expected demand. Contractors specialize in hyperscale construction. Planning departments become familiar with complex infrastructure review.
As ecosystems mature, approval timelines often shorten because municipalities intentionally designed them to shorten. Political alignment is increasingly becoming part of infrastructure strategy itself.
Want to track data center decisions in your target markets? Shovels Decisions covers zoning votes, planning commission rulings, moratoriums, and land use decisions across US jurisdictions. Contact us to learn more or access decisions data.
The Real Bottleneck Is the Grid
Underneath many of these local political debates sits the same issue: power access.
In 2026, PJM Interconnection, the largest Regional Transmission Organization (RTO) in North America, reported interconnection wait times averaging roughly eight years for new energy projects entering operation within its territory. Grid access has quietly become one of the slowest-moving parts of the infrastructure pipeline.
Northern Virginia remains the clearest example. A state-commissioned analysis projects that electricity demand from data centers could double statewide within the next decade. Parts of Loudoun County’s grid are already constrained for high-energy users, forcing developers to secure utility commitments earlier in the development cycle.
PJM has already proposed emergency procurement measures tied directly to accelerating hyperscale demand.
New Markets Are Emerging Around Power Sources
Inland states like Texas and Iowa benefit from different grid structures. As friction rises in mature corridors, developers are increasingly testing secondary markets that can still offer better power access.
Cedar Rapids is a strong example. The market recorded almost no meaningful data center activity before 2025. Then the area suddenly added 7 projects, more than $3 billion in declared project value, and multiple projects exceeding $100 million individually.
Later in 2025, Google confirmed a major campus at the Big Cedar Industrial Center in Cedar Rapids, backed by $56 million in state incentives. QTS separately announced a $750 million campus at the same site. Google later expanded those plans into a broader $7 billion statewide infrastructure investment centered on cloud and AI capacity.
The incentive is clear. Cedar Rapids offers several advantages: lower construction costs, available land, and most importantly, access to the MISO grid, which currently retains more available interconnection capacity than PJM, the territory serving Northern Virginia.
The Next Wave of Data Centers is Visible in Decisions and Permit Data
Permit and decisions data point toward a broader shift in how AI infrastructure markets are forming. Permit filings point to where construction activity is accelerating. Decisions data reveal whether local governments are likely to continue supporting that growth, slow it, or resist it altogether.
Together, the two datasets show that the next generation of AI infrastructure markets will be shaped less by demand alone and more by which governments can coordinate power delivery, utility expansion, zoning, and long-term infrastructure planning.
For hyperscalers, vendors, contractors, utilities, and investors, that makes permit and decisions data a directional tool as much as a construction signal. Fast approvals, overlay zones, utility coordination, and repeated campus expansions can indicate markets actively competing for long-term infrastructure investment. Moratoriums, zoning rewrites, repeated denials, and extended review timelines can signal markets where future expansion may become slower, riskier, or politically constrained.
Increasingly, the earliest signs of the next AI infrastructure corridor will not appear first in a hyperscaler press release. They will appear earlier in planning commission agendas, zoning rewrites, utility studies, and permit filings months or even years before the campuses themselves fully arrive.
Interested in the underlying data? Shovels tracks building permits and municipal decisions across the US, updated twice monthly. Whether you're monitoring data center construction or local zoning decisions, we can help. Contact us to learn more.
Frequently Asked Questions
- How many data center projects has Shovels tracked since 2022?
-
Shovels has tracked 214 data center projects across 21 states and 43 metro areas through building permits filed since January 2022. The count represents distinct construction projects, deduplicated by address so sub-permits filed for the same site aren't double-counted.
- Which states lead in data center construction?
-
Virginia leads with 67 projects since 2022 — nearly three times the next state. Illinois follows with 23, then Texas (22), California (19), and North Carolina (11). Together, the top four account for the majority of large-scale data center construction in the Shovels dataset.
- Why do some metros approve data center permits the same day?
-
Same-day approvals usually mean a project has already cleared upstream hurdles — pre-zoned industrial land, utility coordination, and political alignment. Elk Grove Village (Chicago suburb) hosts 20+ data centers under a "Beyond Business Friendly" online permitting system, and Fort Worth's X Team expedited review program assigns dedicated coordinators to large commercial projects.
- Which cities have placed moratoriums on data center development?
-
Cities and counties including Tulsa, Madison, Lowell, Birmingham, Tallmadge, Malden, and Caledonia Township have enacted moratoriums, temporary suspensions, or zoning freezes specifically targeting data center development. Common concerns include electricity demand, water consumption, diesel generator noise, and infrastructure strain.
- Why is Cedar Rapids emerging as a major data center market?
-
Cedar Rapids recorded almost no data center activity before 2025, then added 7 projects and over $3 billion in declared project value in under two years. The market offers lower construction costs, available land, and access to the MISO grid, which retains more available interconnection capacity than PJM — the territory serving Northern Virginia.