
When we published our Florida housing market report, the Tampa Bay region stood out. Statewide, new construction rose 3.8% in 2025, but county-level permit trends diverged sharply. Some areas surged while adjacent counties pulled back, which warranted a closer look.
By the headlines, the Tampa Bay housing market has been in correction mode for two years. Prices are down, inventory is up, and homes are sitting longer than they were a year ago. But county-level permit data suggests the next phase may not be uniform across the region.
This article looks at new construction and residential building permit activity across six Tampa Bay jurisdictions: Hillsborough, Tampa (metro), Pinellas, Manatee, Polk, and Sarasota, to gauge where new housing supply is expanding, slowing, or beginning to stabilize.
💡 Key takeaways
- Manatee County leads the region with 8,324 residential permits in 2025, up 40.5% year-over-year
- Tampa city residential permits surged 50% year-over-year, nearly returning to 2021 levels
- Polk County saw the steepest drop, down 17.6% in 2025, still working through excess supply
- Pinellas is geographically constrained but permit activity jumped 44.5% on a small baseline
Tampa Bay Housing Market: Two Years of Correction
The Tampa Bay region refers to an eight-county metropolitan that includes Hillsborough, Pinellas, Pasco, Polk, Manatee, Sarasota, Citrus, and Hernando.
For this article, we focus on six jurisdictions where we have consistent, clean YoY data: Hillsborough, Tampa (metro), Pinellas, Polk, Manatee, and Sarasota.
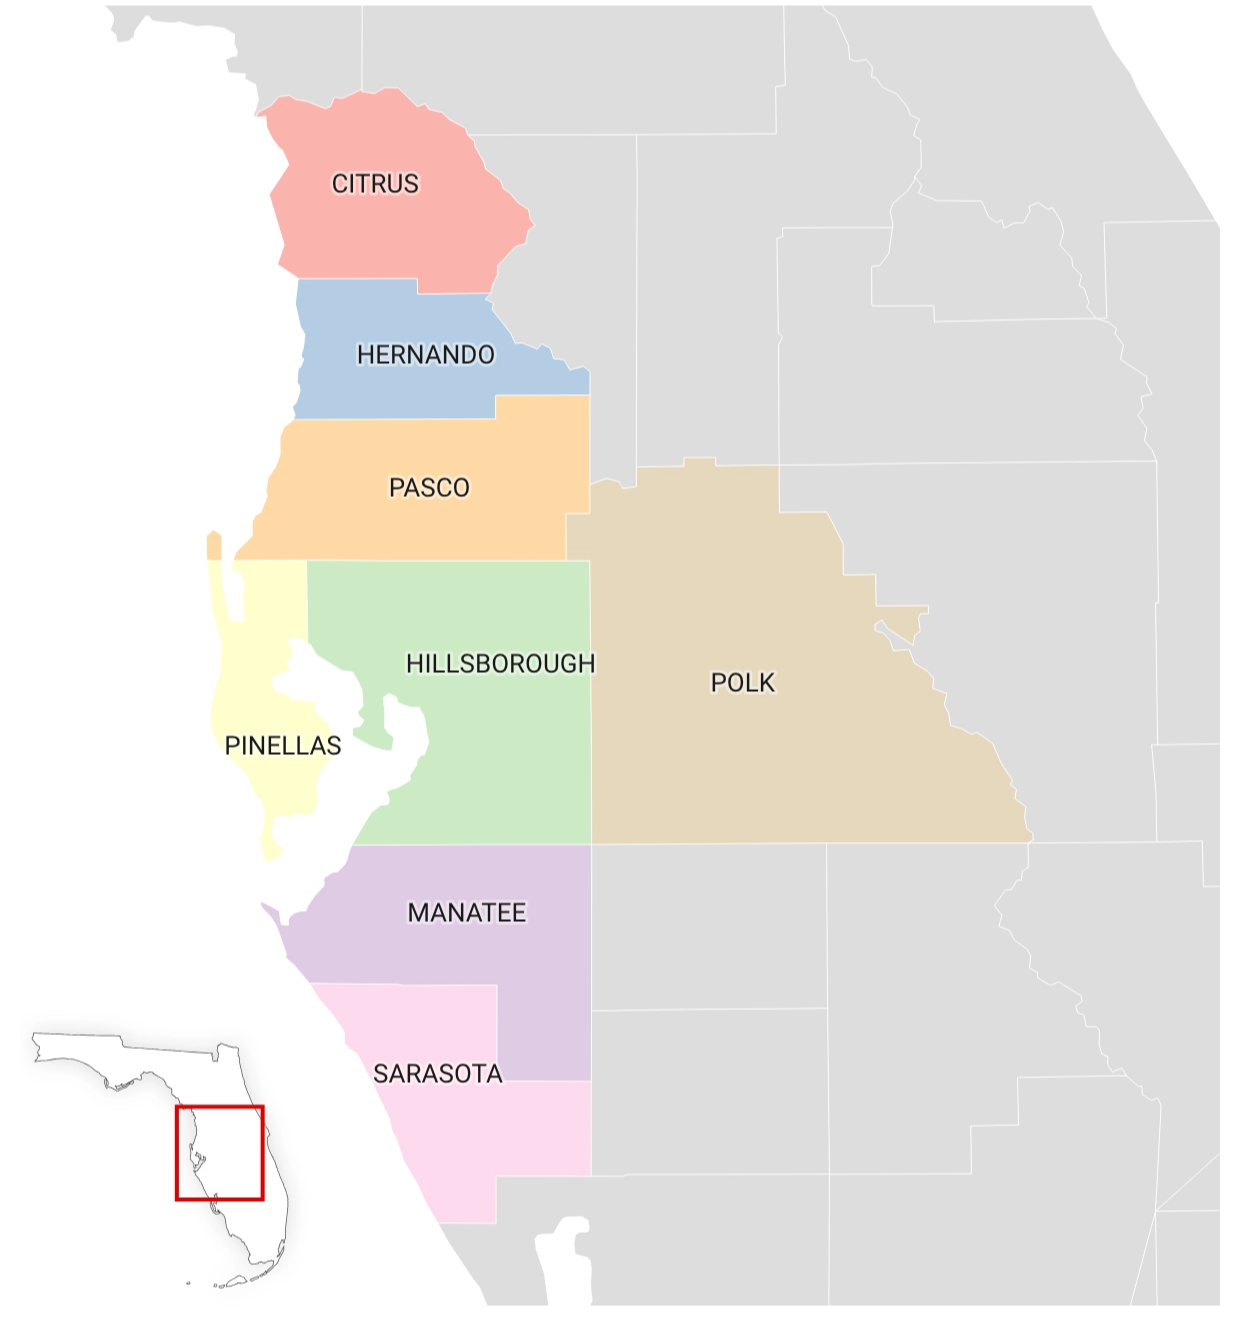
Map of the Tampa Bay region counties
Across most markets in the region, housing prices have fallen since 2023, but not at the same pace. Year-to-date through November 2025, single-family median prices were down 3.1% in the Tampa metro, 1.8% in Polk County, and 5.1% in Manatee and Sarasota counties. Condo and townhouse prices have fallen more sharply, as high as 11.1% across those same markets.
High insurance costs have also put pressure on the market, although providers are actively responding. Citizens Property Insurance recommended rate decreases for many policyholders, and Florida Peninsula Insurance proposed reductions for homeowners and condo owners. But even with cuts, premiums remain far higher than they were before 2021.
These indicators clearly signal a contracting market with uneven pockets. The open question is whether the market is still cooling or whether the recovery is already under way in some counties.
How Is New Housing Supply Shifting Across Tampa Bay?
Since building permits are typically issued 12–18 months before a home reaches the market, they're one of the earliest indicators of where builders are adding supply and where they're pulling back.
Nationally, permit activity slowed in early 2025 versus the prior year, according to Shovels data. Florida partially bucked that trend, with statewide new construction up 3.8% in 2025 after a steep decline in 2024.
Within the Tampa Bay region, however, permit activity is moving in different directions. Some jurisdictions are seeing construction continue to grow while others are pulling back, a split that helps explain why the housing market can feel uneven across the region.
📋 A Note on Methodology
All permit counts are filtered by issue date. They exclude inactive permits and require a recorded approval duration.
Residential new construction includes single-family homes, mobile/manufactured homes, multi-family housing, duplexes, and townhouses. Vacant land, condominiums, and large apartment buildings are excluded.
Hillsborough County Building Permits: Recovery Underway, But Far From Peak
Hillsborough County (excluding Tampa metro) is showing early signs of recovery after a steep decline from 2021 highs. Even so, 2025 residential permit volume remains roughly 58% below the 2021 peak.
| Property Type | 2021 | 2022 | 2023 | 2024 | 2025 |
|---|---|---|---|---|---|
| All New Construction | 8,645 | 5,851 | 4,918 | 3,084 | 3,657 |
| Residential New Construction | 8,076 | 5,407 | 4,556 | 2,836 | 3,345 |
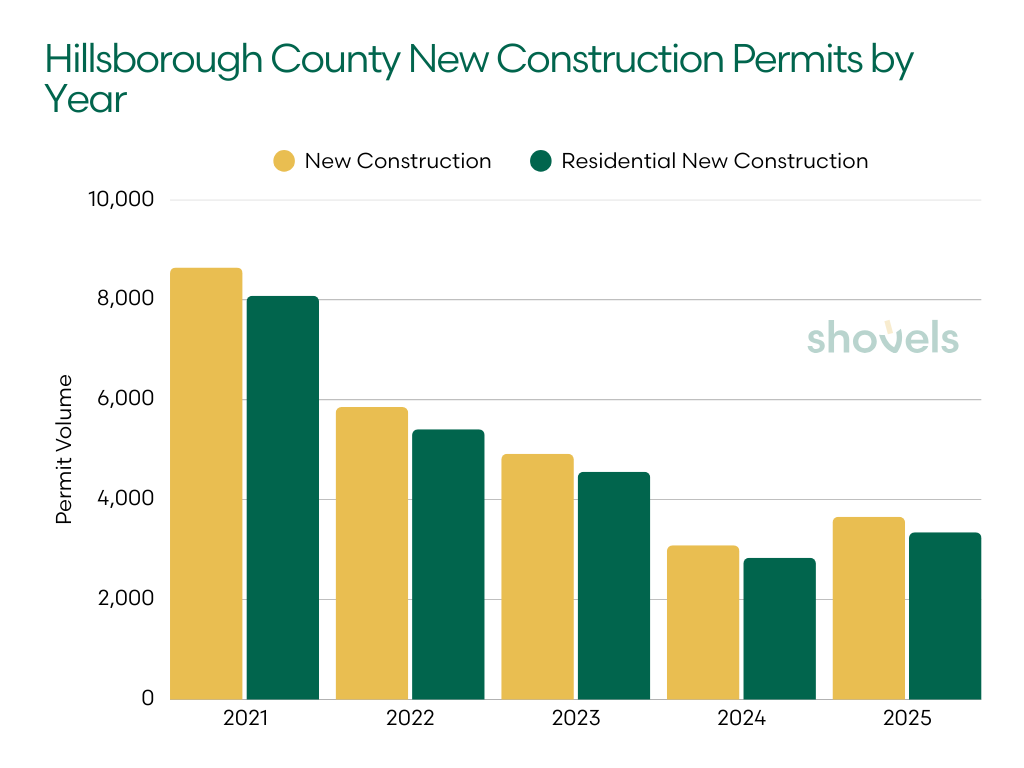
Hillsborough County (not including Tampa) new construction and residential new construction
Tampa Building Permits: Construction Activity Rebounding
The city of Tampa is recovering much faster. After seeing declines over 3 years, residential permits there jumped 50% year-over-year in 2025, nearly reaching 2021 levels. This points to a shift toward urban, higher-density development relative to suburban construction across the broader county.
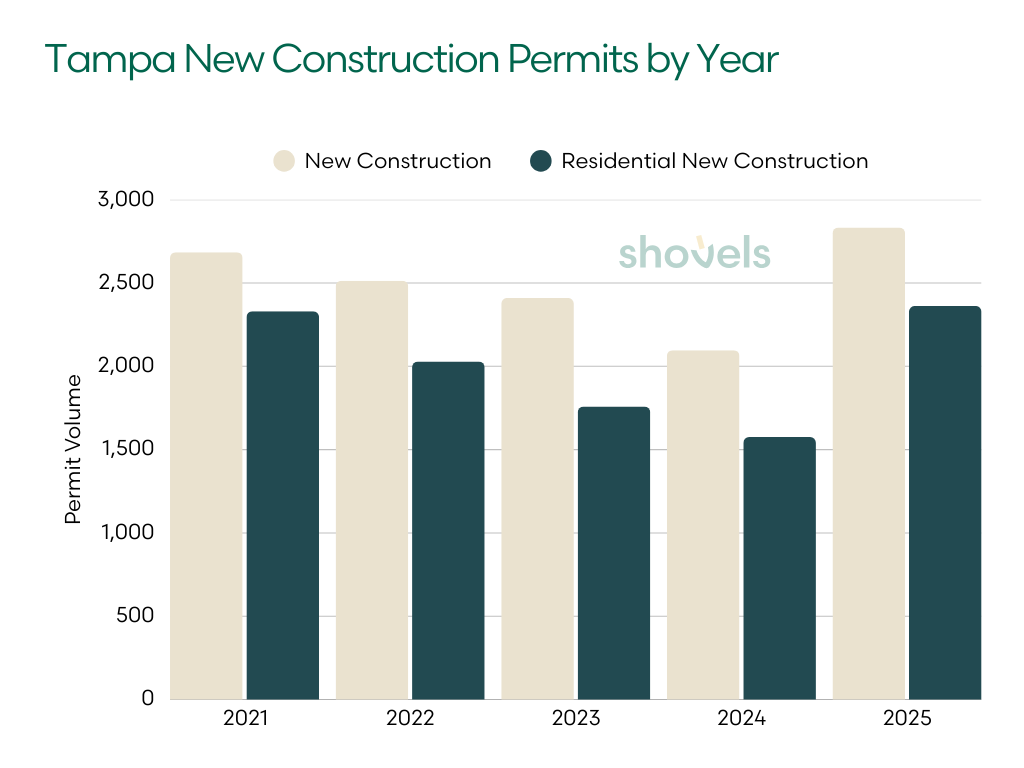
Tampa new construction and residential new construction
| Property Type | 2021 | 2022 | 2023 | 2024 | 2025 |
|---|---|---|---|---|---|
| All New Construction | 2,685 | 2,514 | 2,410 | 2,097 | 2,833 |
| Residential New Construction | 2,330 | 2,029 | 1,759 | 1,575 | 2,362 |
City policy is helping to drive that trend. Programs like the Tampa Infill Housing Initiative and large mixed-use developments like Gasworx are adding new housing in the urban core.
Manatee County Building Permits: Construction Surging in 2025
Manatee County is the standout in the region. Where other areas pulled back in 2023, Manatee new construction increased and saw only small declines in 2024. This jurisdiction issued 8,324 residential construction permits in 2025, a 40.5% increase from 2024 and well above its previous peak in 2023.
| Type | 2021 | 2022 | 2023 | 2024 | 2025 |
|---|---|---|---|---|---|
| All New Construction | 6,183 | 6,286 | 7,273 | 6,489 | 9,238 |
| Residential New Construction | 5,939 | 5,977 | 6,927 | 5,926 | 8,324 |
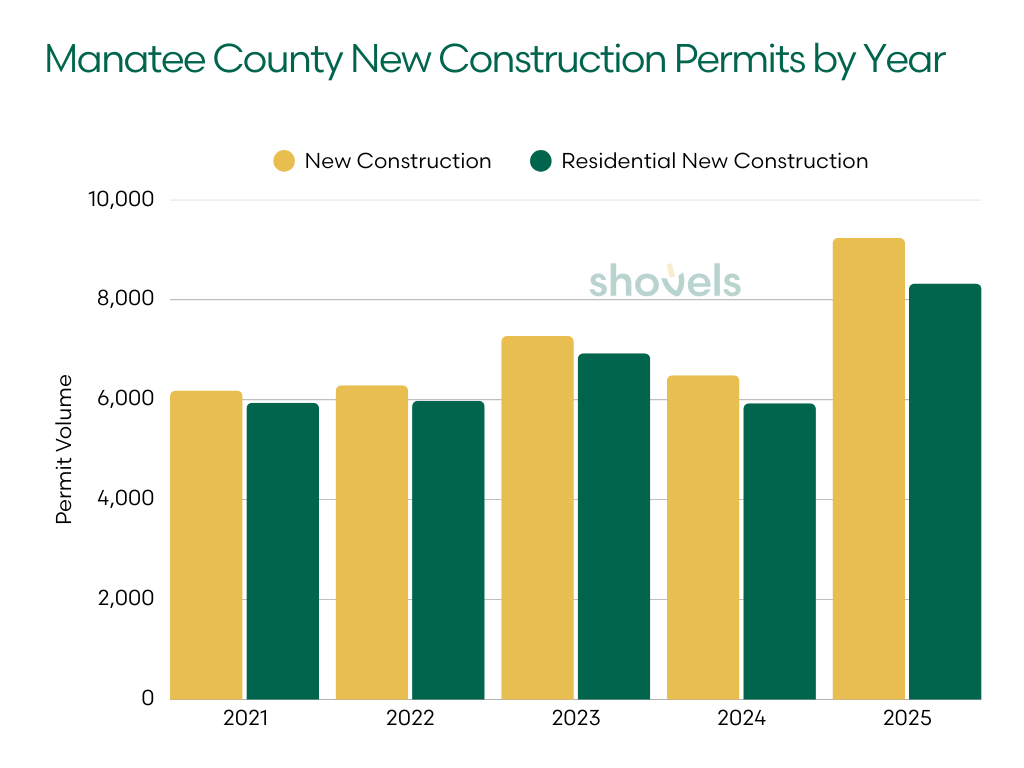
Manatee County new construction and residential new construction
Affordability pressures in Hillsborough and Tampa are likely the key driver of this growth. Buyers priced out of urban areas are landing in Bradenton and surrounding communities, and builders are following that demand.
Large master-planned communities are actively pulling permits. SeaFlower, for example, is a 4,000-home master-planned community that broke ground in west Bradenton in 2025. This was the first development of that scale in the area in more than two decades.
Price data shows the same dynamic. Bradenton's median home price reached $347,000 in early 2026, making it an affordable market and an attractive target for new construction. The question remains whether the market will continue to absorb new residential construction at this rate.
Pinellas County Building Permits: Small Volume, Significant Momentum
Pinellas County operates on a much smaller construction scale than its neighbors. Surrounded by Tampa Bay and the Gulf of Mexico, the county has limited land available for large new subdivisions. That constraint makes its 2025 increase to 458 residential permits notable. The jump is more than double its 2021 level.
| Type | 2021 | 2022 | 2023 | 2024 | 2025 |
|---|---|---|---|---|---|
| All New Construction | 356 | 306 | 369 | 377 | 539 |
| Residential New Construction | 226 | 179 | 299 | 317 | 458 |
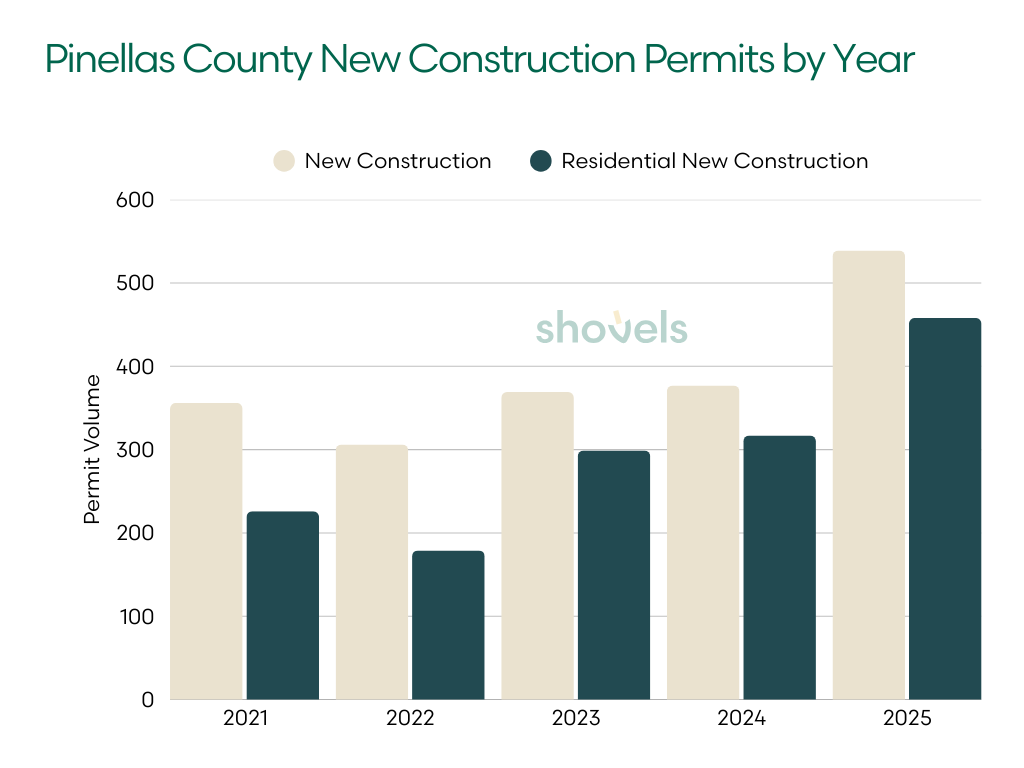
Pinellas County new construction and residential new construction
Most of this activity comes from infill redevelopment and higher-density construction, not suburban expansion. But even with permit growth, Pinellas remains structurally insulated from large supply increases.
Polk County Building Permits: The Sharpest Correction in the Region
Polk County shows the sharpest construction pullback in the region. The county issued 2,306 residential permits in 2025, down 17.6% from the year before and far below its 2021 peak of 5,458 permits.
| Type | 2021 | 2022 | 2023 | 2024 | 2025 |
|---|---|---|---|---|---|
| All New Construction | 5,834 | 5,754 | 5,045 | 3,189 | 2,802 |
| Residential New Construction | 5,458 | 5,276 | 4,583 | 2,797 | 2,306 |
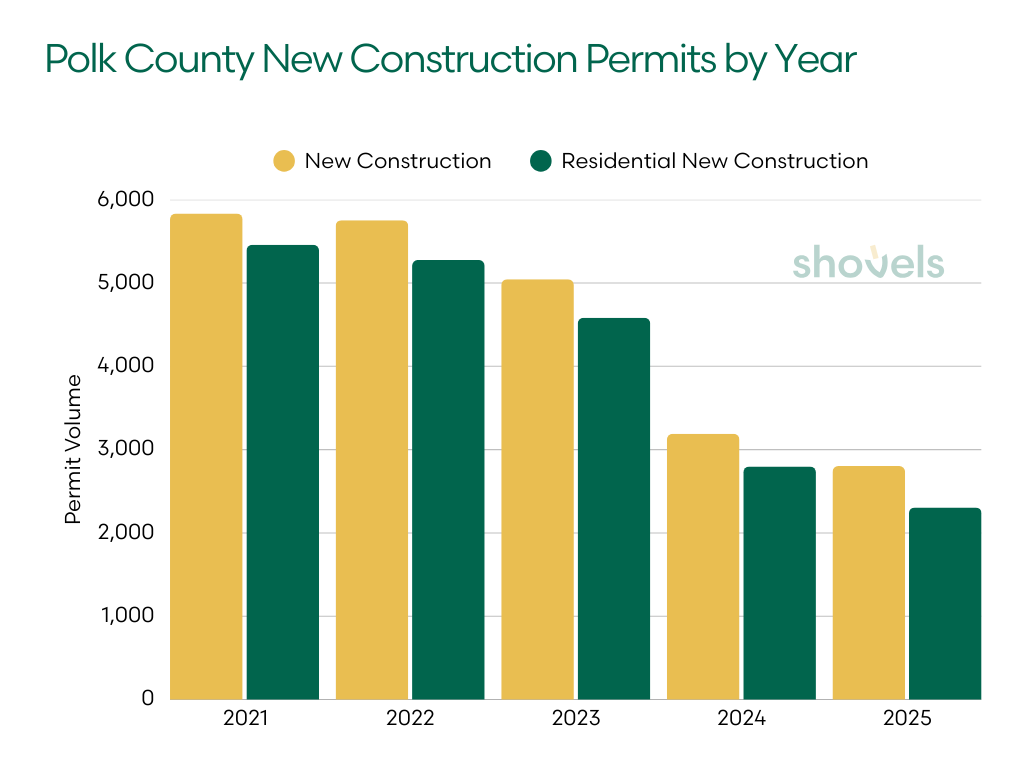
Polk County new construction and residential new construction
Builders pulled permits aggressively through 2022 in anticipation of continued population growth. When that demand failed to materialize at the expected scale, the region was left absorbing excess inventory.
The result has been a notable correction. Polk County recorded the highest foreclosure rate in the United States in 2024 as sellers faced mortgage increases and excess supply. Although conditions improved somewhat in 2025, fewer permits are less a signal of recovery and more a sign of a supply adjustment.
Sarasota County Building Permits: Growth Still Soft as Resale Market Stabilizes
Sarasota's permit decline has been slower than Polk's but points in the same direction. The county issued 2,219 residential permits in 2025, about 55% below its 2021 peak.
| Type | 2021 | 2022 | 2023 | 2024 | 2025 |
|---|---|---|---|---|---|
| All New Construction | 5,386 | 4,210 | 3,205 | 2,602 | 2,412 |
| Residential New Construction | 4,982 | 3,764 | 2,869 | 2,428 | 2,219 |
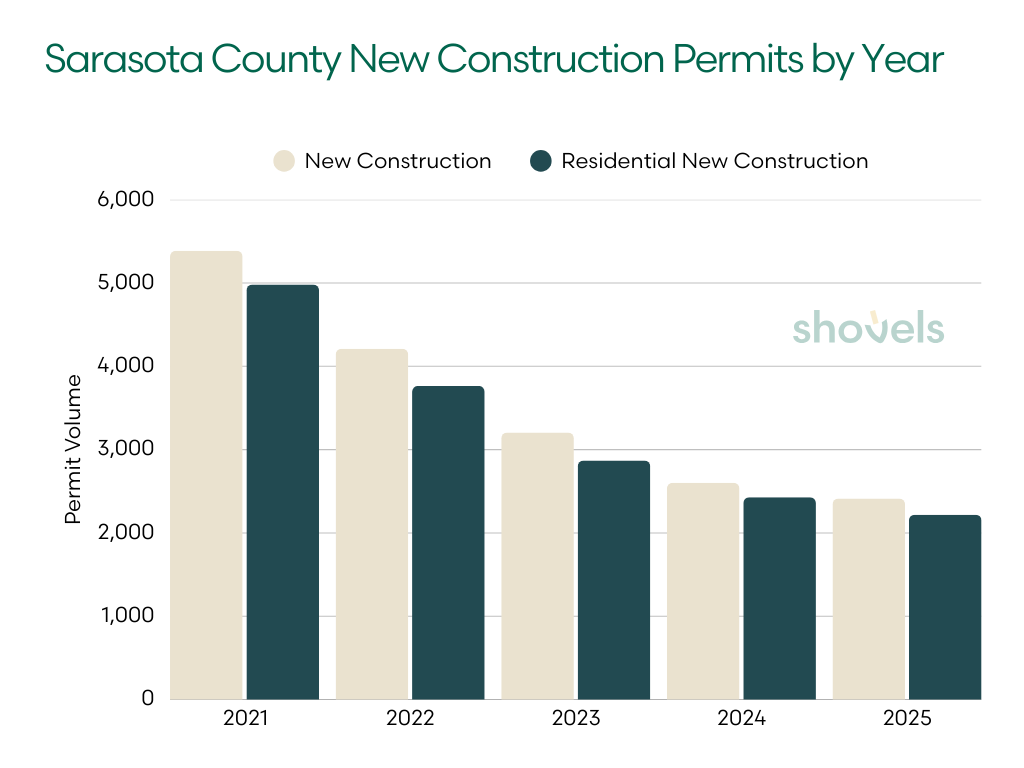
Sarasota County new construction and residential new construction
Sales are increasing for single-family homes, but inventory fell to 3,211 listings in 2025. Major master-planned communities such as Lakewood Ranch and Wellen Park continue delivering homes, but other builders may be staying cautious while they watch how absorption improves.
Buyers now have more options than at any point since before the pandemic, but the additional inventory from 2021 and 2022 may still be weighing on new permit activity.
What Factors Will Determine the Tampa Housing Market in 2026?
Multiple forces are pulling the Tampa housing market in different directions.
Migration provides a demand floor, but it's not a guarantee. More than 497,000 people have moved to the Tampa Bay region since 2020, creating a strong long-term demand base. But migration also responds to affordability, and sustained cost pressures could slow that flow.
Builder activity reflects two sides of developer confidence. Construction growth in Manatee and parts of Hillsborough signals confidence from developers willing to commit land and financing. Polk County illustrates the opposite risk, overbuilding ahead of demand.
Mortgage lock-in limits both supply and recovery. Many homeowners still hold 3–4% mortgages and are reluctant to sell. That keeps resale inventory tight but also suppresses transaction volume, slowing price recovery. This is true nationally and in Florida.
Insurance remains the hardest variable to model. Recent rate cuts from Citizens and Florida Peninsula are meaningful but still leave premiums high.
What This Means If You're Buying, Selling, or Building in Tampa Bay
The permit data points in different directions depending on where you sit in the market.
If you're buying: The jurisdictions with the most new inventory coming, Manatee and outer Hillsborough, are where buyers are likely to have the most options and negotiating room through 2026. New construction pipelines in these areas are active.
If you're selling: The competitive environment in Manatee is likely to get more challenging as new inventory arrives. In Polk, price normalization and distressed inventory remain real headwinds. Sarasota tells a different story. Prices are still adjusting, but closed sales are rising, suggesting buyers are engaging with the corrected pricing.
Suburban development in Florida. Credit: Ward Mercer on Unsplash.
If you're building or contracting: Manatee is the highest-volume growth jurisdiction in the region right now. Tampa city is recovering faster than Hillsborough County. Pinellas is small-volume but active in infill and density work. Polk and Sarasota are both quiet on new construction, but for different reasons. Polk is still working through overbuilt supply with weaker demand. In Sarasota, buyer activity is recovering, and builders are watching to see if that translates into sustained absorption before committing new supply.
Tampa Bay Housing Market Predictions and Outlook for 2026
At a high level, Tampa Bay looks like one story: two years of correction, prices down, inventory up. The permit data tells six different stories depending on which jurisdiction you're watching.
Manatee, Hillsborough, and Tampa (metro) have construction momentum building. Pinellas is constrained by geography but quietly active. Polk is still working through the consequences of overbuilding. Sarasota's housing market is showing early signs of recovery, but new construction remains cautious pending further absorption.
If you'd like to go deeper, Shovels includes Tampa Bay permit data by county, contractor, and permit type. Sign up to browse or get in touch.
Permit counts in this article may differ slightly from figures in our Florida Housing Market Outlook due to a database update. The Florida report used an earlier version of our data pipeline. This article reflects updated numbers from our internal database. Differences are minor per jurisdiction and don't impact conclusions.