

In all of 2024, the Pacific Palisades and Altadena neighborhoods in the Los Angeles region generated 6,877 building permits combined. In the year following the Palisades and Eaton fires, that number nearly tripled, jumping to 20,069. The surge traces back to two fires that ignited on January 7, 2025, during powerful Santa Ana winds.
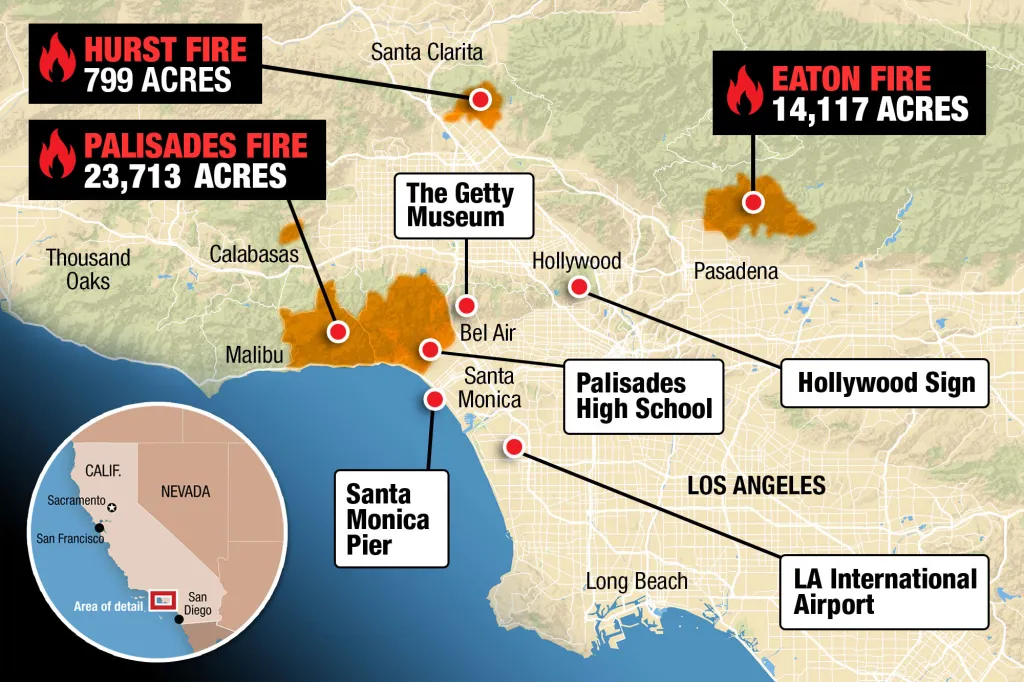
The Eaton Fire began in Eaton Canyon, spreading rapidly through Altadena and Pasadena, destroying more than 9,000 buildings and killing 19 people. It was the second most destructive wildfire in California history, burning for 24 days before it was contained on January 31.
The Palisades Fire started the same day in the Santa Monica Mountains, tearing across Pacific Palisades, Topanga, and parts of Malibu. It destroyed 6,837 structures and killed 12 people.
Together, the two fires destroyed over 16,000 structures across Los Angeles County. The physical damage was visible within hours. The data trail took a little longer to emerge, but it now shows up clearly in building permit records.
 CA wildfire map
Building permits are the first hard record of recovery. Before a foundation gets poured, before a frame goes up, a permit gets filed. Shovels tracks that activity at the address level across the United States. In the neighborhoods hardest hit by these fires, the permit record provides a ground-level view of recovery: who is working, what projects are being approved, and how quickly rebuilding is taking shape.
What follows is a snapshot of rebuilding efforts from the perspective of building permits. We look at trends in permit volume, the pace and sequence of rebuilding, the backlog forming in the approval pipeline, and the investment flowing into reconstruction.
Executive Summary
- Permit volume nearly tripled in one year, 20,069 permits across Pacific Palisades and Altadena, up from 6,877 the year before.
- Altadena moved fast. Demolition and new construction rose simultaneously, peaking at 1,954 permits in September 2025. New construction is still running at 374/month.
- Pacific Palisades is still building toward its peak. Rapid demolition gave way to site prep, and grading permits in December 2025 were running at 73% of new construction volume.
- The economic scale is significant. Altadena logged $2.78B in permitted job value in 13 months, 18× its pre-fire baseline. The full Eaton Fire corridor has crossed $3.15B.
- The homes being rebuilt were million-dollar properties. Median pre-fire sale price: $1.04M in Altadena, $2.93M in Pacific Palisades.
- Everything going up is being built to a new standard: California's updated Wildland-Urban Interface Code (Title 24) took effect January 1, 2026.
Palisades Fire Rebuild and Eaton Fire Recovery by the Numbers
Two months after the fire, Pacific Palisades already generated 574 total permits, more than three times its pre-fire monthly average of 186. Altadena followed a different, steadier trajectory, creating 405 permits in the first month, 562 in the second, 750 in the third month. Activity continued climbing through the year, peaking in October 2025 with 1,954 permits, more than five times its pre-fire baseline of 382 per month.
Combined, the year following the fires produced 20,069 permits across both zones, nearly three times the volume of the previous year (6,877).
Permit activity began to normalize in late 2025, but levels remain elevated. Altadena peaked in fall at 1,954 permits in October 2025 before tapering to 1,114 by December 2025, still more than double its historical monthly level. Pacific Palisades held at an elevated plateau through most of 2025, then hit a high of 688 permits in October 2025.
Altadena is deep into the rebuild cycle. Palisades is still building toward it.
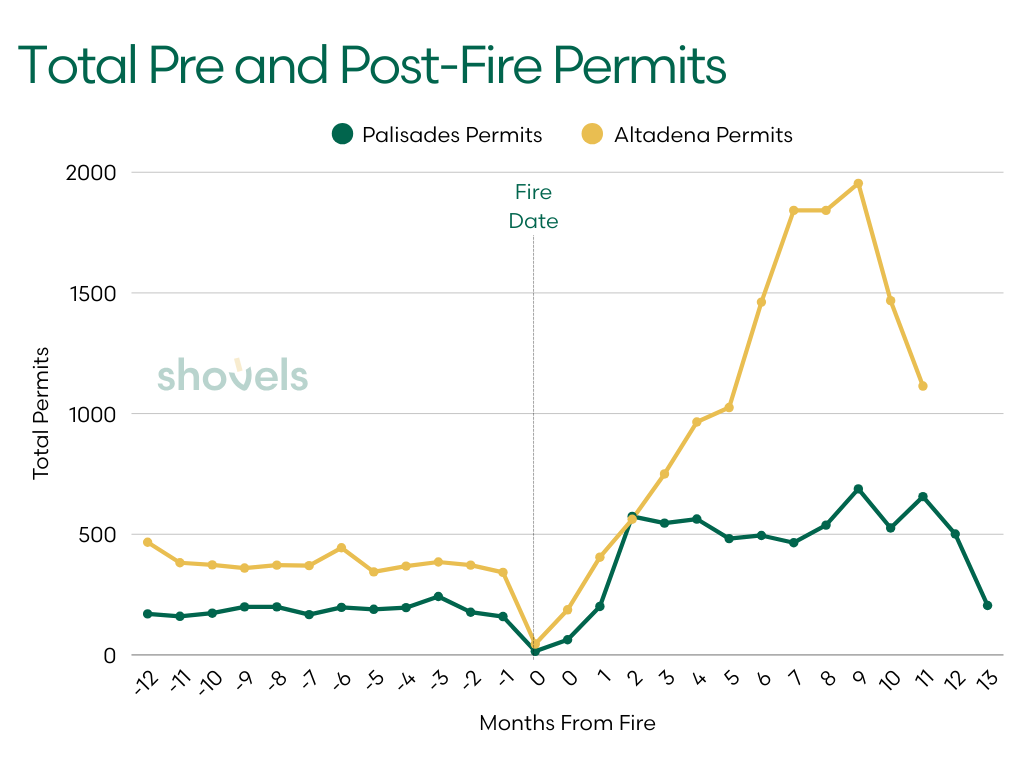
Chart note: Month 0 is split at the January 7, 2025 fire date. The first Month 0 data point covers January 1–6 (pre-fire); the second covers January 7–31 (post-fire). Altadena data runs through December 2025; Pacific Palisades data runs through February 2026.
Total monthly permits by fire zone:
| Month from fire | Palisades | Altadena |
|---|---|---|
| -12 | 170 | 467 |
| -11 | 160 | 382 |
| -10 | 173 | 373 |
| -9 | 199 | 360 |
| -8 | 199 | 372 |
| -7 | 167 | 370 |
| -6 | 197 | 444 |
| -5 | 189 | 344 |
| -4 | 196 | 368 |
| -3 | 242 | 385 |
| -2 | 177 | 372 |
| -1 | 159 | 342 |
| 0 (pre-fire, Jan 1-6) | 15 | 45 |
| 0 (post-fire, Jan 7-31) | 63 | 187 |
| 1 | 201 | 405 |
| 2 | 574 | 562 |
| 3 | 546 | 750 |
| 4 | 563 | 965 |
| 5 | 482 | 1025 |
| 6 | 495 | 1462 |
| 7 | 465 | 1842 |
| 8 | 538 | 1842 |
| 9 | 688 | 1954 |
| 10 | 526 | 1468 |
| 11 | 656 | 1114 |
| 12 | 501 | — |
| 13 | 205 | — |
Monthly totals only show the scale of the surge. To understand what that recovery looks like on the ground, property by property, we mapped permit activity over time.
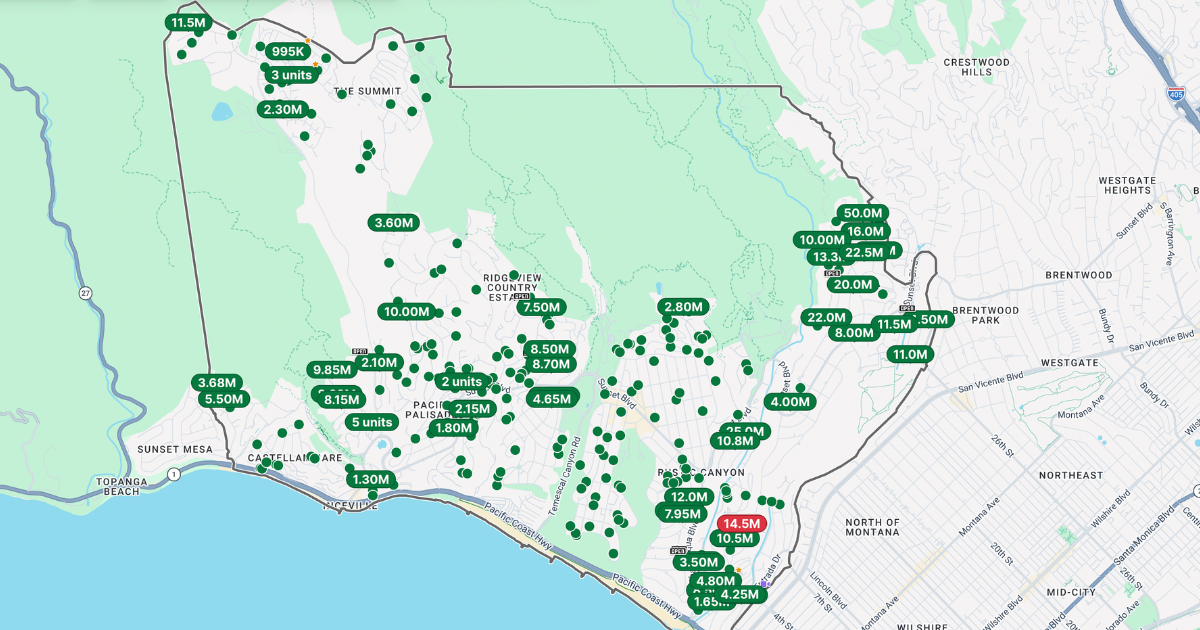
The interactive map below tracks reconstruction progress. It visualizes building permit activity across Altadena, Malibu, and Pacific Palisades from January 2025 through January 2026, showing how properties move through the rebuilding process, from demolition and grading to new construction.
Interactive map: LA Wildfire Reconstruction Progress
Use the timeline feature to watch reconstruction unfold day by day, or apply filters to focus on specific cities, contractors, or permit types. Each property includes job value, permit fees, contractor information, and permit history, offering a ground-level view of how recovery is progressing.
What Permit Categories Reveal About the LA Wildfire Rebuild
The total permit counts show the scale of the rebuilding effort while permit categories reveal how that rebuilding unfolded.
The first wave was demolition. As fire-damaged homes were cleared, demolition permits across the two fire zones surged to 14 times their combined pre-fire monthly average. Lots that had held homes just weeks earlier were quickly cleared.
New construction permits followed almost immediately. Across both areas, new residential permits jumped from just 194 in all of 2024 to 6,932 in the year after the fires, a 35× increase that marks the beginning of full-scale reconstruction.
Looking at the permit categories, we saw two communities that began rebuilding in very different ways.
Altadena: Demolition and Rebuilding Happening Side by Side
In Altadena, demolition and rebuilding happened almost simultaneously. Demolition permits climbed steadily and peaked eight months after the fire, in September 2025, with 265 permits. New construction was already running at scale by then, peaking one month earlier at 1,024 permits. Instead of clearing and rebuilding in sequence, the neighborhood was tearing down and rebuilding at the same time.
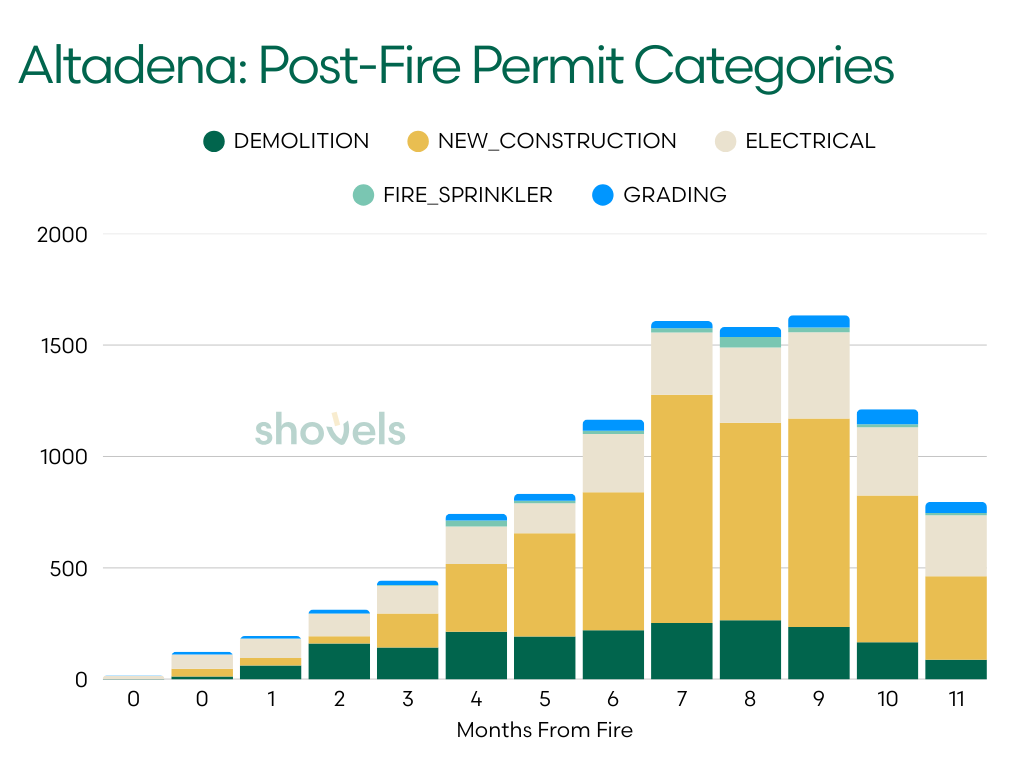
We can see this pattern clearly as Altadena permits are issued day-to-day. Below, the red dots represent demolition permits, and the green dots represent new construction. Altadena appears to have moved from demo to new builds on a streamlined timeline after the disaster:
Map: Altadena Demolition and New Construction Permits
Here are the Altadena permit categories by month:
| Month from fire | Demolition | Grading | New Construction | Electrical | Fire Sprinkler |
|---|---|---|---|---|---|
| 0 (pre-fire) | 1 | 2 | 0 | 14 | 0 |
| 0 (post-fire) | 13 | 13 | 35 | 63 | 0 |
| 1 | 62 | 11 | 34 | 86 | 1 |
| 2 | 161 | 18 | 32 | 101 | 1 |
| 3 | 143 | 21 | 152 | 125 | 3 |
| 4 | 213 | 30 | 304 | 169 | 27 |
| 5 | 192 | 32 | 463 | 135 | 11 |
| 6 | 220 | 50 | 619 | 262 | 15 |
| 7 | 253 | 33 | 1024 | 279 | 19 |
| 8 | 265 | 45 | 886 | 338 | 47 |
| 9 | 235 | 55 | 935 | 388 | 21 |
| 10 | 166 | 67 | 659 | 306 | 14 |
| 11 | 88 | 50 | 374 | 274 | 10 |
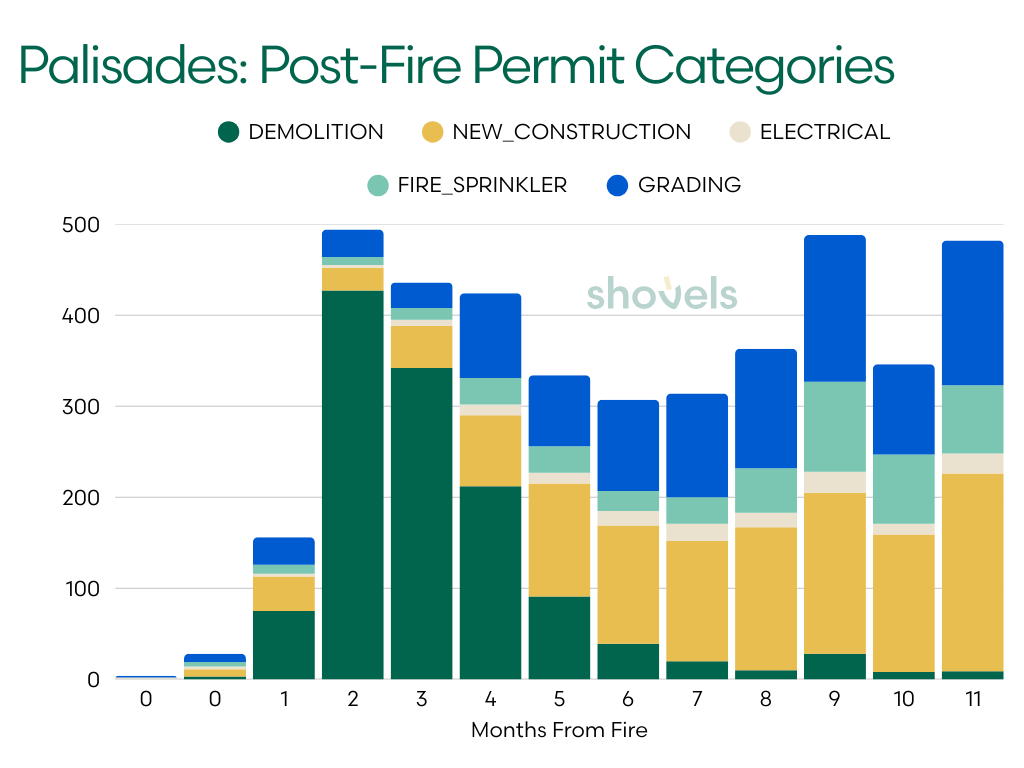
Pacific Palisades: A Staged Rebuild Sequence
Pacific Palisades followed a different pattern. The first wave was rapid demolition. Just two months after the fire, demolition permits peaked at 427 in March 2025. Activity then dropped sharply once the initial teardown phase was complete.
The next phase was preparation. As lots were cleared, grading permits began to rise, reflecting the work required to stabilize land, prepare foundations, and ready sites for new homes.
By October 2025, grading permits had reached 161, nearly matching 177 new construction permits that month. The pattern suggests a rebuild pipeline still forming: sites are being prepared, foundations are being set, and construction is beginning to move forward.
Unlike Altadena, where demolition and rebuilding happened almost simultaneously, Pacific Palisades appears to be moving through a more staged recovery, progressing from teardown to site preparation before full-scale construction accelerates.
Pacific Palisades permit categories by month:
| Month from fire | Demolition | Grading | New Construction | Electrical | Fire Sprinkler |
|---|---|---|---|---|---|
| 0 (pre-fire) | 0 | 2 | 0 | 2 | 0 |
| 0 (post-fire) | 3 | 9 | 8 | 3 | 5 |
| 1 | 75 | 30 | 38 | 3 | 10 |
| 2 | 427 | 30 | 25 | 3 | 9 |
| 3 | 342 | 28 | 46 | 7 | 13 |
| 4 | 212 | 93 | 78 | 12 | 29 |
| 5 | 91 | 78 | 124 | 12 | 29 |
| 6 | 39 | 100 | 130 | 16 | 22 |
| 7 | 20 | 114 | 132 | 19 | 29 |
| 8 | 10 | 131 | 157 | 16 | 49 |
| 9 | 28 | 161 | 177 | 23 | 99 |
| 10 | 8 | 99 | 151 | 12 | 76 |
| 11 | 9 | 159 | 217 | 22 | 75 |
We can see this staggered build sequence on the timeline for Palisades below. The red demolition dots dominate the early months, while new construction picks up 5 months after the fire. The volumes are holding steady, suggesting builders have yet to hit a new construction peak.
Map: Palisades Demolition and New Construction Permits
Fire Sprinkler and Electrical Permits: Two Signals Worth Watching
We decided to track a few other proxy permit categories that shed light on how the rebuilding process is unfolding.
Fire sprinkler permits in particular highlight what's happening in the Pacific Palisades neighborhood. These permits were nearly absent through the spring, then began climbing sharply as reconstruction plans moved forward, reaching 99 permits in October 2025. Every structure going up in Pacific Palisades falls under California's updated Wildland-Urban Interface Code (Title 24, Part 7), effective January 1, 2026. In practical terms, the neighborhood that burned down is being rebuilt to a different, newly-updated safety standard.
Electrical permits tell a different story in Altadena. In the first three months after the fire, electrical permits rose quickly to 63, 86, then 101, before the surge in new construction permits began to spike. That early growth shows power restoration and repairs to surviving structures. By the summer, electrical permits began moving in step with new construction activity.
Why Altadena and Pacific Palisades Are Rebuilding on Different Timelines
So far, the permit patterns suggest a familiar reconstruction cycle: demolition first, grading next, construction after. Altadena is already deep into rebuilding, but Pacific Palisades, by contrast, is still moving through site preparation and regulatory transition. The permit patterns are clear, but to figure out why this divergence appeared, we have to look at differences between the two LA communities.
Property complexity may be a factor. Rebuilding in Pacific Palisades means larger, higher-value homes, properties that tend to require more detailed plans, longer design cycles, and more complex financing and insurance resolution before a permit gets filed. By contrast, many Altadena homes have simpler profiles that may accelerate timelines.
 Image: Pacific Palisades mansion for sale - $37M asking price. Source: zillow.com
Geography also plays a role. Altadena sits in the foothills of unincorporated LA County, where many lots are sloped and unstable. Post-fire soil destabilization typically requires more extensive grading and geotechnical work before foundations can be poured. The permit record suggests this didn't slow Altadena down. That could point to homeowner urgency, simpler project profiles, or both.
Jurisdiction also impacts timelines. Altadena falls under LA County, which had an average permitting timeline of 131 days before the fires, compared to 79 days for the City of LA, which covers Pacific Palisades. But the sheer volume of post-fire applications in both areas has complicated any simple comparison of processing speeds.
All these factors offer a plausible explanation for the divergence the data shows. But the permit record alone can't confirm any single cause. What it can say with confidence is that two neighborhoods hit on the same day are rebuilding on very different timelines, and the gap between them is still widening.
Recovery Across Disasters
Wildfires aren't the only events that leave distinct, trackable signatures in permit activity. In our hurricane recovery analysis, we saw two different post-disaster timelines. Hurricane Harvey's flood damage led to a slower recovery that took nearly a year to peak, while Hurricane Ian's wind damage triggered an immediate surge in roofing permits.
Active, In Review, Final: Reading the Rebuild Through Permit Status
To understand how rebuilding is progressing, not just how much activity exists, we tracked the status of every permit filed across both fire zones in 2024 and 2025. Each permit falls into one of four states: Active (filed and underway), In Review (awaiting approval), Final (completed and closed), or Inactive (stalled or abandoned).
Altadena: From Finished to Work-In-Progress
In 2024, 73% of Altadena's 4,581 permits were Final, the signature of a neighborhood operating in a steady state. Routine projects move through the system and close out. Only 5% of permits were Active, reflecting relatively little work underway at any given time.
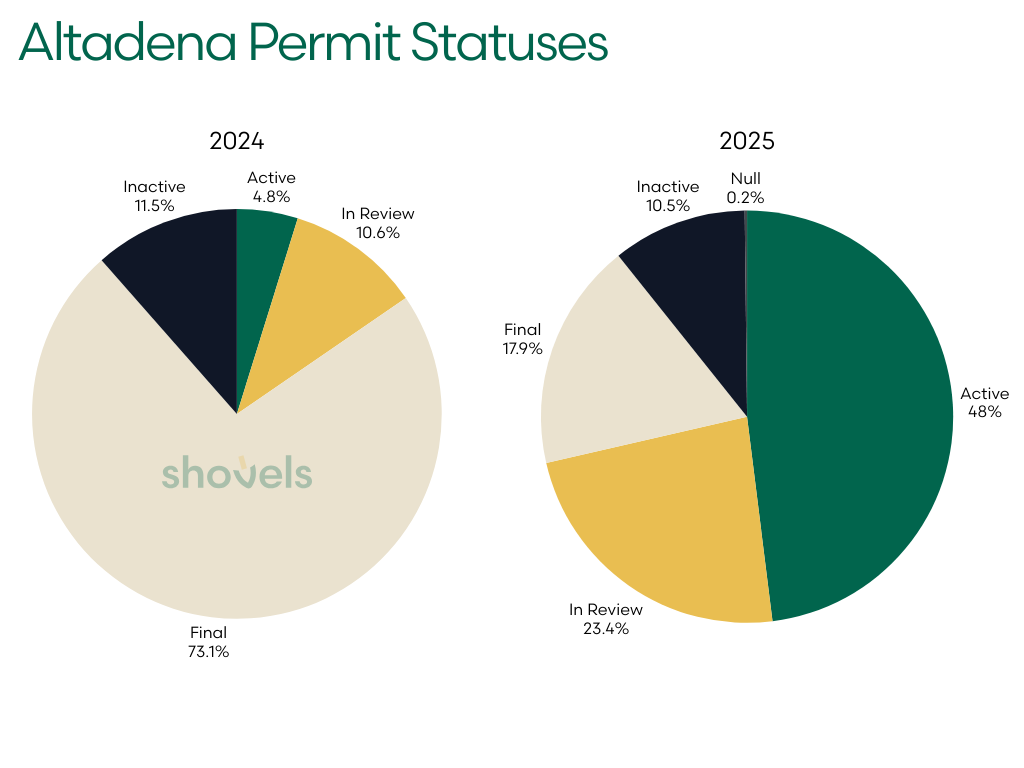
2025 looks very different. Of the 13,621 permits filed in 2025, 48% were Active and 23% remained In Review. Nearly three-quarters of all permits were still live in the system. Meanwhile, Final permits, the marker of completed work, fell from 73% of the mix to just 18%.
Altadena is no longer a neighborhood where projects are finishing. It's one where the rebuilding process has only just begun.
Pacific Palisades: More Activity, and a Growing Queue
Pacific Palisades entered 2024 with a more active construction market. In ZIP code 90272, 59% of the 970 permits filed in 2024 were Active, reflecting steady ongoing development even before the fires.
That share remained high in 2025 at 50%, but the scale changed dramatically. Permit volume increased 4.4×, turning what once looked like a busy year into something closer to a single month of post-fire activity.
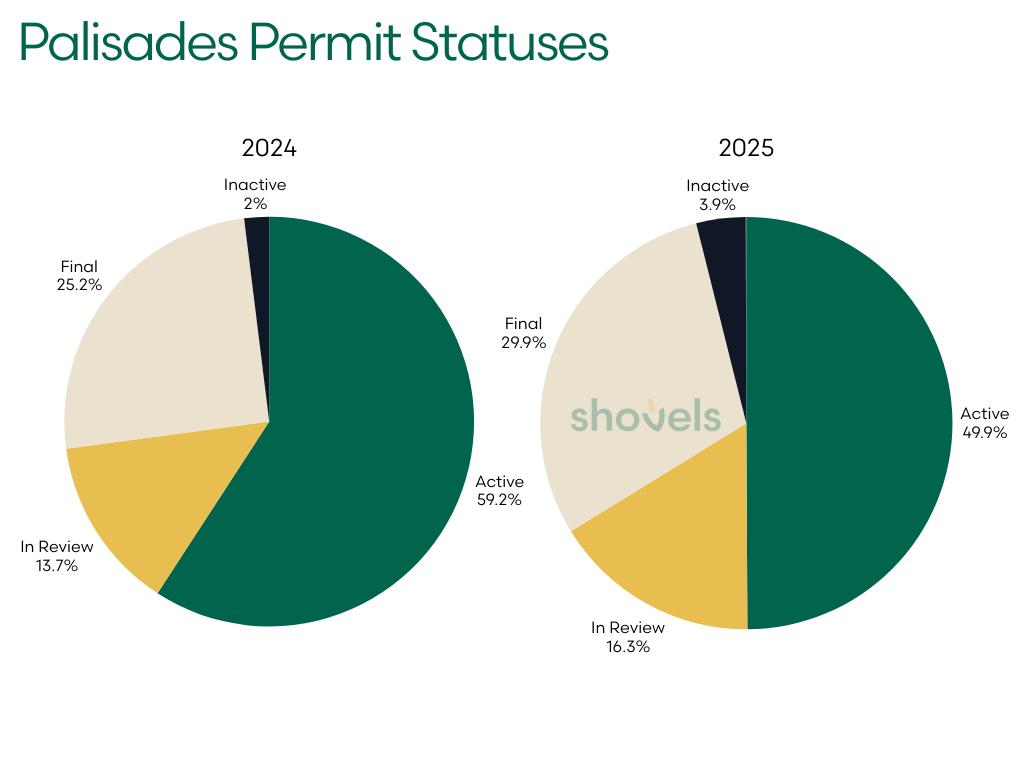
In Review permits rose only slightly as a share, from 14% in 2024 to 16% in 2025, but the absolute numbers tell a different story. The queue expanded from 133 permits awaiting approval to 695, meaning the pipeline is filling faster than it's clearing.
Final permits remained relatively stable as a share (25% in 2024, 30% in 2025). That stability likely reflects early-stage work: demolition assessments, hazmat clearance, and site preparation. They are cycling through to completion while the larger reconstruction queue builds.
Overall, the status data reinforces what the permit categories already suggest: Altadena is deep into the rebuilding cycle, while Pacific Palisades is still assembling its pipeline.
Permit counts show the scale of activity. Permit status shows where that work sits in the process. The next question is the financial one: how much value has actually moved through the permit system so far?
The Economic Scale of Palisades and Eaton Fire Damage
The rebuild is measured in billions. Altadena has logged over $2.78 billion in permitted job value in the 13 months since the fire. For comparison, the same ZIP codes accrued just $156 million in job value the 12 months before the fire. That is an 18x increase. The average permitted job value per permit rose from $67,000 to $275,000. Over roughly a year, the baseline shifted significantly.
Pasadena, over the past year, also added roughly $373 million in job value. Together, the Eaton Fire corridor crossed $3.15 billion in permitted reconstruction value, and the work is still underway.
Note: Shovels treats permitted job values as directional. Not every permit includes a job value, and when it does, it can be inaccurate. Even so, we find use in comparing documented job values before and after the fire as a signal.
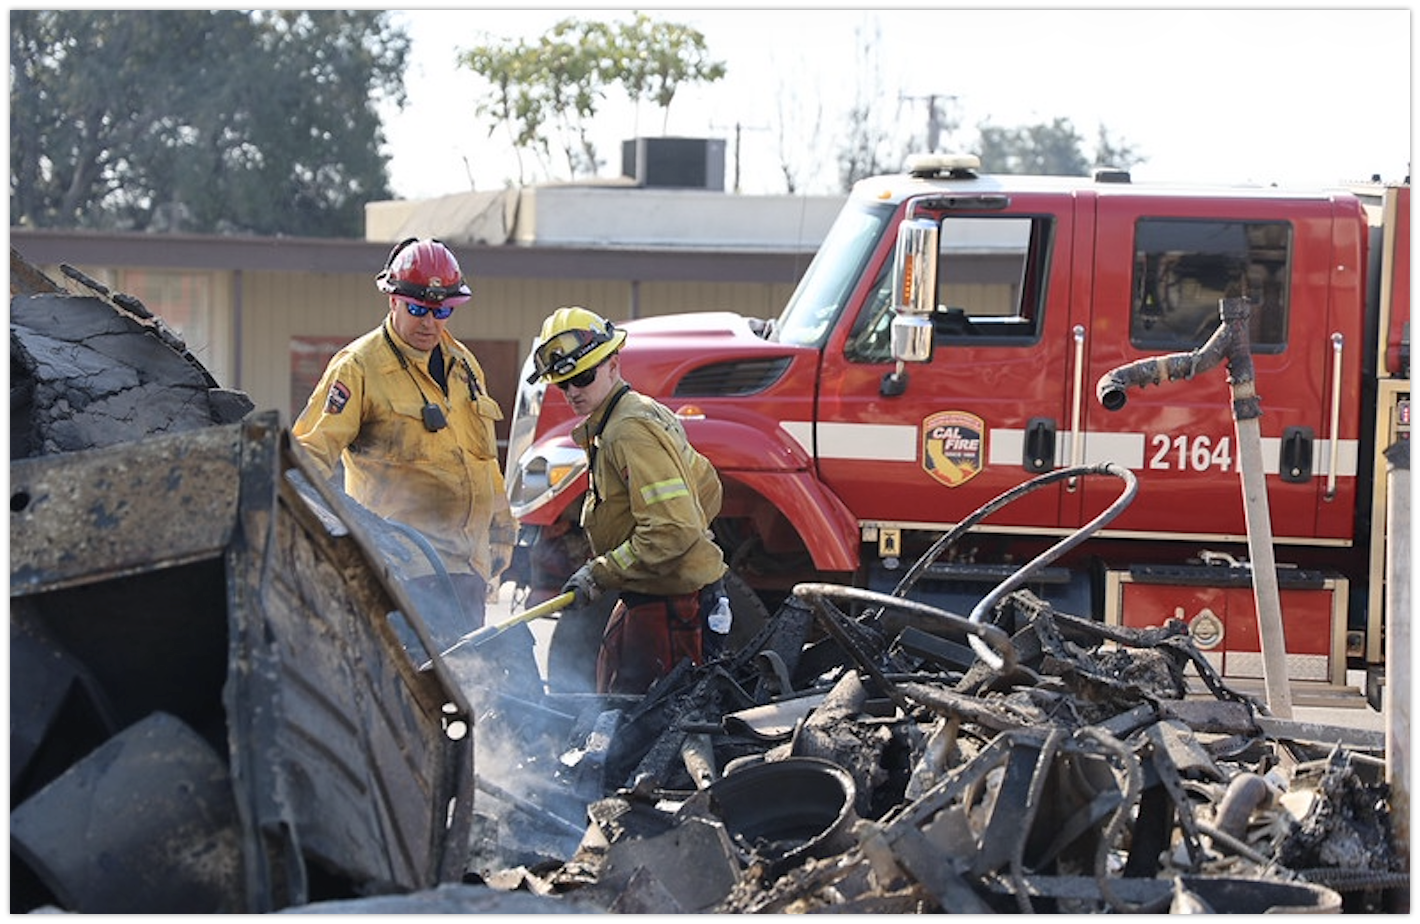 Image: Eaton firefighters cleaning debris. Source: www.fire.ca.gov
For context, the scale of damage was enormous. The Eaton Fire caused an estimated $7.8 billion in direct property losses across Altadena, and the Palisades fire caused $22 billion in real estate losses, making it the costliest wildfire in California history. UCLA's Anderson Forecast puts combined property and capital losses from both fires at between $95 billion and $164 billion. Permit data captures only the portion of that loss that has begun to move through the rebuilding pipeline, the earliest hard-dollar signal of capital returning to the ground.
Along the coastline, Malibu shows the highest average job value of any geography tracked: about $489,000 per permit. Here, higher land values, complex site conditions, and premium construction requirements drive project costs sharply upward, exposing the real costs of coastal rebuilding.
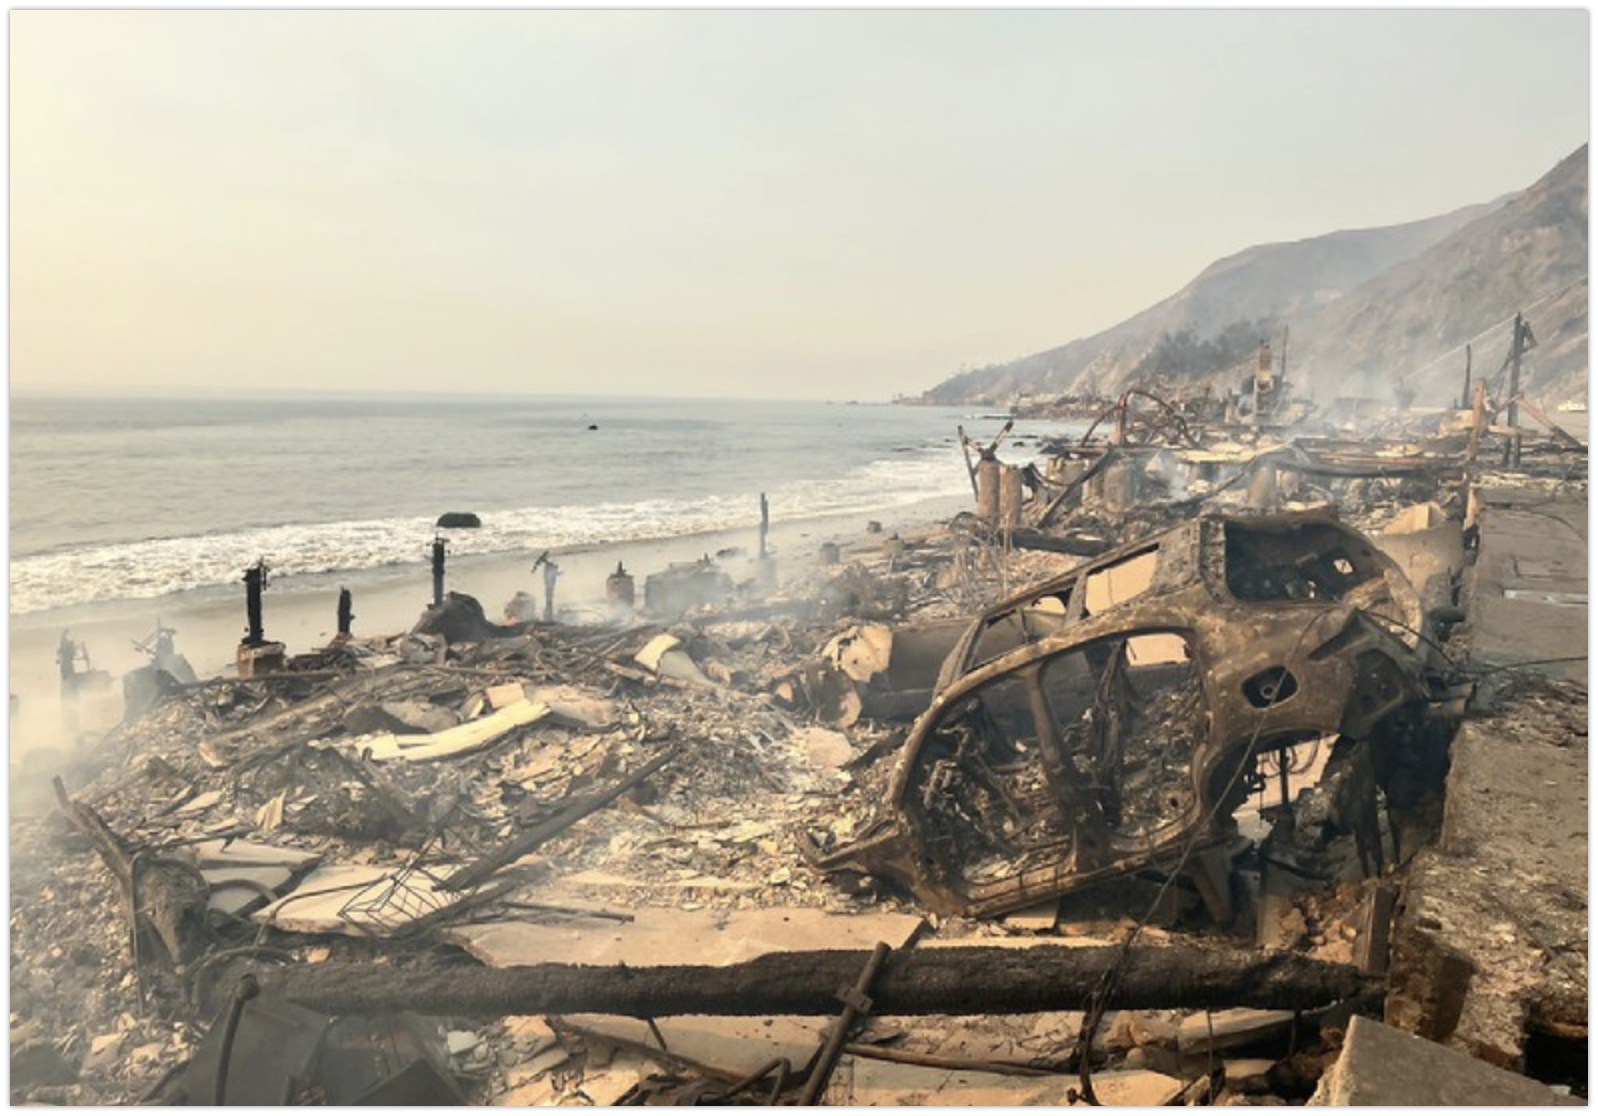 Image: Palisades fire wreckage along the coast. Source: www.fire.ca.gov
The Pacific Palisades job values, by contrast, are clearly understated. City of Los Angeles permit filings frequently leave the job value field blank. The 27 job-value-bearing permits in 90272 show an average of only $310,000 each, while coverage across all filed permits is thin. The volume story in Palisades is tracked in permit counts. The dollar story will take years to fully emerge in the record.
The Pre-Fire Price Tag: How We Measure What Was Actually Lost
Permits show what's being built. Property records can show what was lost. To estimate the value of what was being rebuilt, we matched 3,243 addresses with new construction permits, 2,174 in Altadena and 1,069 in Pacific Palisades, to pre-fire property records.
Assessed values were not very useful for this purpose. Because California's Proposition 13 caps annual assessment increases at 2%, tax assessments often reflect decades-old purchase prices rather than current market value. In our dataset, the median assessed value was $293,000 in Altadena and $982,000 in Pacific Palisades. They are real numbers, but far below actual market prices.
 Map: Property for sale in Pacific Palisades. Source: redfin.com
Instead, we used recorded sale prices from county deed records, which capture the actual transaction value of each property. To approximate January 2025 market conditions, we focused on homes that last sold in 2020 or later.
The median prices for those properties were:
- Altadena: $1,045,000
- Pacific Palisades: $2,930,750
These figures should be read as conservative estimates. Many long-held homes do not appear in recent transaction records, and improvements made after purchase are not reflected in the last sale price.
Even with those limitations, the pattern is clear. The homes generating new construction permits were million-dollar properties before the fires. In Pacific Palisades, often closer to three million. That is the economic baseline the rebuild has to replace.
With reconstruction now underway, the next question is who is securing the contracts.
The Contractors Leading the Palisades Fire Rebuild
As the rebuild unfolds, a network of California contractors has stepped in to lead the reconstruction effort in Pacific Palisades. These firms manage the complex work of bringing thousands of homes back from the ground up. They navigate updated building codes, coordinate across disciplines, and execute rebuilds under compressed timelines and difficult conditions.
The contractors leading the new construction effort include:
- TJC Home Builders LLC — 28 new construction permits filed
- Service Champions (On-Time A/C & Heating LLC) — 20 new construction permits filed
- Dolan Design & Build LLC — 16 new construction permits filed
- South Coast Construction and Development — 11 new construction permits filed
- Drexel Construction Management LLC — 8 new construction permits filed
- Ortam Construction Inc. — 8 new construction permits filed
- Hanover Builders Inc. — 7 new construction permits filed
- Jensen Construction Inc. — 6 new construction permits filed
- Clear Construction Inc. — 6 new construction permits filed
- PSG Hardware & Supply — 4 new construction permits filed
These firms are building under California's updated Wildland-Urban Interface Code, which took effect January 1, 2026. Every structure going up is being built to a higher standard intended to help guard against future disaster.
What This Means For Contractors, Building Suppliers and Insurers
Altadena is in the active phase of rebuild. New construction permits in December 2025 were running at 374 per month. Cleared lots are being built out, and that rate will continue through 2026. Contractors who are already on the ground are capturing demand, those who are not are late to the game.
Pacific Palisades is earlier in the cycle. Construction activity is steady but has yet to peak. In December 2025, grading permits were running at 73% of new construction volume, indicating that site preparation is still underway. The surge in new construction filings will likely follow in the second half of 2026, leaving a narrow window for contractors to establish relationships.
For building product suppliers, permit data defines the scale of demand. More than 440 fire sprinkler permits have been filed across the affected areas, and electrical permits have exceeded pre-fire levels since the first month after the fires. New construction permits average $275,000 in declared job value, a sign of rebuild projects with correspondingly high material requirements.
For insurers, the post-fire job value data provides a cost benchmark. The average permitted job value in Altadena before the fire was $67,000. Post-fire, it was $275,000. That four-fold increase reflects the scope of work being filed. Research consistently shows that wildfire victims are significantly underinsured, with average payouts falling 35% short of replacement cost. Permit data offers one way to track what actual reconstruction spending looks like.
For all three audiences, timing decides who captures the opportunity. The permit record shows where reconstruction and opportunities are now, and where they're likely to appear.
Methodology
The permit data in this analysis comes from the Shovels database, which indexes building permits at the address level across the United States. Permit filings are collected continuously from county and city sources and updated as new records are made available.
The fire impact zone is defined by ZIP codes 90272 (Pacific Palisades) and 91001 and 91003 (Altadena). The pre-fire baseline covers permit activity from the 12 months prior to January 7, 2025. The post-fire period covers January 7, 2025 through February 2026.
Permit categories used: DEMOLITION, NEW CONSTRUCTION, ELECTRICAL, FIRE SPRINKLER, and GRADING. Each permit is categorized based on the primary scope of work as filed. View our data dictionary for more information.
Job value figures reflect the declared job value in the permit record. City of Los Angeles filings (ZIP 90272) have low job value field coverage. Most permits in that jurisdiction do not include a declared dollar amount. Altadena falls under Los Angeles County, where coverage is more complete. All job value figures should be read as minimums, not totals.
Frequently Asked Questions
How many building permits were filed after the LA wildfires?
In the year following the January 2025 fires, Pacific Palisades and Altadena generated 20,069 building permits combined — nearly three times the 6,877 permits filed in all of 2024. Altadena alone accounted for 13,621 permits in 2025, with activity peaking at 1,954 permits in October 2025, more than five times its pre-fire monthly baseline.
Why is Pacific Palisades rebuilding slower than Altadena?
Several factors contribute to the different timelines. Palisades homes are significantly higher-value (median pre-fire sale price of $2.93M vs. $1.04M in Altadena), requiring more complex plans, longer design cycles, and more involved insurance resolution before a permit is filed. Jurisdictional differences also play a role: Pacific Palisades falls under the City of LA, which had a 79-day permitting baseline before the fires, while Altadena falls under LA County at 131 days — though post-fire volume has complicated both systems. The permit record shows Palisades is still moving through grading and site prep, while Altadena is deep into new construction.
How much has been invested in LA wildfire reconstruction so far?
Altadena logged over $2.78 billion in permitted job value in the 13 months following the fires — an 18x increase over the $156 million recorded in the prior year. The broader Eaton Fire corridor, including Pasadena, has crossed $3.15 billion in permitted reconstruction value. These figures are directional minimums: City of LA permit filings frequently omit job value, so the Pacific Palisades total is likely significantly understated.
What building codes apply to new construction in the wildfire zones?
Every structure being rebuilt in the affected areas must comply with California's updated Wildland-Urban Interface Code (Title 24, Part 7), which took effect January 1, 2026. The code sets higher standards for fire-resistant construction, including requirements for fire sprinkler systems — which showed up clearly in the permit record, with Pacific Palisades fire sprinkler permits reaching 99 in October 2025 alone. Homes being rebuilt are being built to a materially different safety standard than what was lost.
How can contractors and building suppliers use permit data to find rebuild opportunities?
Shovels indexes building permit activity at the address level across the United States, updated continuously from over 2,000 jurisdictions. For the LA wildfire zones specifically, permit data shows which neighborhoods are in active construction, what permit types are surging, which contractors are filing the most permits, and where the pipeline is still forming. Suppliers can use fire sprinkler and electrical permit trends to anticipate material demand; contractors can identify where new construction volume is concentrated before the peak arrives.
Want to track where the rebuild goes next? Shovels indexes building permit activity at the address level across the United States, updated continuously. Dive into the data yourself, or get in touch to talk through what's possible.