
For professionals across telecommunications, real estate, utilities, and construction, the most valuable question isn't "What is happening now?" but "What is going to happen next?" Gaining a predictive edge is what separates market leaders from the competition. The earliest, most reliable indicator of future development—from a new subdivision to a 5G tower or a commercial renovation—is the building permit.
Today, we're exploring how a new integration between Shovels and the Esri ArcGIS platform transforms this critical leading indicator into actionable, predictive intelligence for a wide range of industries.
The Challenge: From Fragmented Records to Strategic Insight
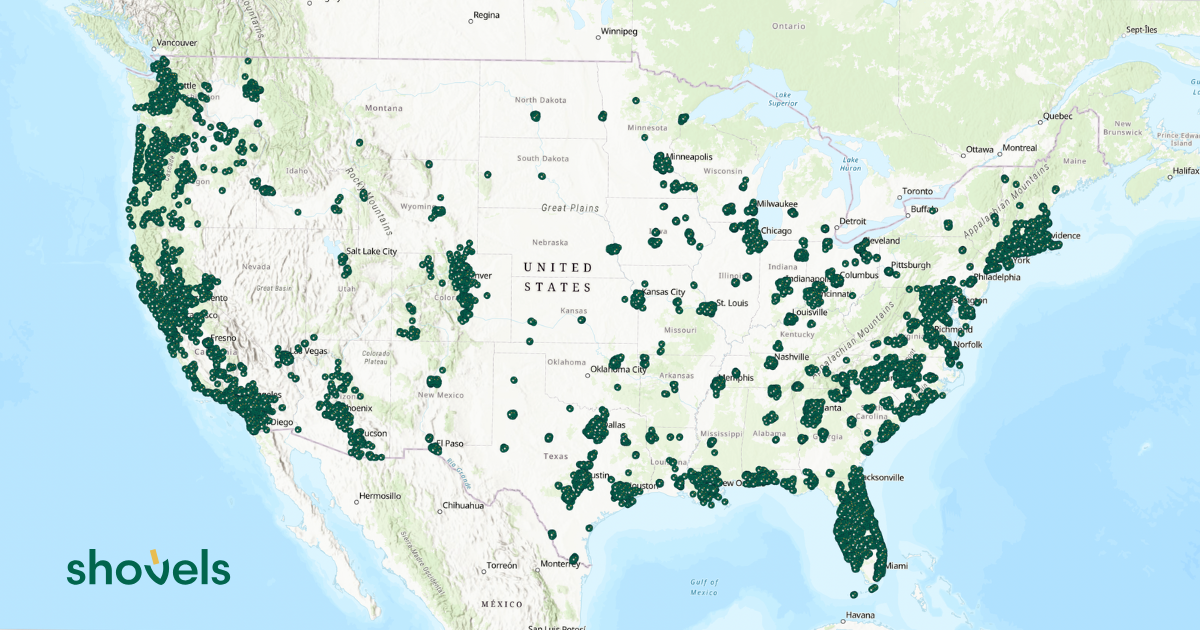
Building permits are a goldmine of market intelligence, but they've historically been trapped in fragmentation. With over 20,000 permitting jurisdictions in the U.S., each with its own formats, requirements, and systems, creating a clean, standardized, and queryable nationwide dataset has been a monumental challenge. This data chaos has prevented ArcGIS users from realizing the full potential of their powerful spatial analysis tools, forcing them to rely on lagging indicators like census data or sales records.
The Solution: A Live Feed of Future Growth in ArcGIS
We solve this problem by using AI to aggregate, clean, and standardize millions of permits into a single, GIS-ready data source. By making this available as a hosted feature layer in ArcGIS, we provide a live feed of future construction activity directly within your existing mapping environment.
Check out our demo feature layer containing construction permit records for Los Angeles County, California, from June 1, 2025 to August 31, 2025:
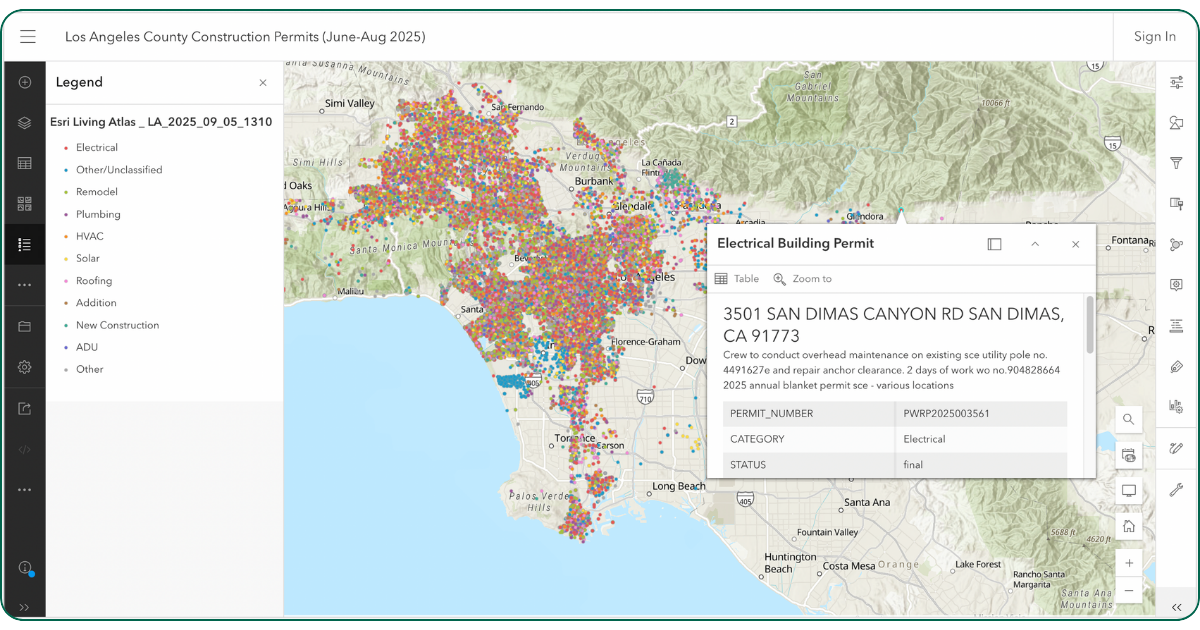 The data provides comprehensive insights into building and construction activities across the county, with enhanced categorization to support analysis and decision-making. The map features detailed project categorization, contractor information, and location data for residential and commercial development activities.
This isn't just about finding leads; it's about fundamentally changing how organizations plan, invest, and compete. Let's look at what this means for key Esri verticals.
Telecommunications: Proactive Network Planning & First-Mover Advantage
For Communication Service Providers (CSPs), capital is expensive and competition is fierce. Permit data allows you to move from reactive to proactive network deployment.
- Optimize Fiber Rollouts: Instead of waiting for a new housing development to be built, you can identify a 200-home subdivision the moment its master permit is approved. Use ArcGIS network analysis tools to plan the most efficient Fiber-to-the-Home (FTTH) route and coordinate with the developer to ensure day-one connectivity for every new resident, locking in customers before rivals even know the homes are occupied.
- Target 5G Small Cell Placement: Filter permits for new utility poles, traffic lights, and commercial buildings to identify a rich inventory of potential small cell mounting locations. Combine these sites with 3D building data in ArcGIS to perform line-of-sight and RF propagation analysis, ensuring optimal network performance.
- Track Competitors: Monitor permits filed by rival ISPs for "directional boring" or "conduit installation" to map their network expansion plans in near-real-time and make strategic decisions to either compete head-on or redeploy capital to uncontested markets.
Commercial Real Estate & Retail: Data-Driven Site Selection
In real estate, timing is everything. Permit data gives you the foresight to act before opportunities become common knowledge and priced into the market.
- Identify "Pre-Gentrification" Hotspots: Use ArcGIS Hot Spot Analysis (Getis-Ord Gi*) on the monetary value of renovation and addition permits. A statistical cluster of high-value permits in an overlooked neighborhood is the earliest possible signal of revitalization, allowing you to acquire prime locations at a lower cost basis.
- Predictive Competitive Analysis: Go beyond mapping where your competitors are. Track new commercial construction and interior fit-out permits filed by specific rival chains to see where they are opening next. This allows you to launch preemptive marketing campaigns or adjust your own site selection strategy.
- Optimize Tenant Mix: For shopping center owners, analyze the types of commercial permits being pulled in your trade area. A surge in medical clinic permits suggests a need for a pharmacy; a spike in office fit-outs indicates a growing daytime population that would support a fast-casual restaurant.
Energy & Water Utilities: Granular Demand Forecasting
Utilities must ensure grid and system reliability in the face of dynamic growth. Permit data provides the granular, bottom-up inputs needed for precise, cost-effective infrastructure planning.
- Surgical Load Forecasting: A single permit for a new data center or a 500-home subdivision provides a definitive, geolocated signal of future demand. Overlay these permits on your ArcGIS Utility Network to run load-flow models that pinpoint the exact substation or water main that requires an upgrade, optimizing capital deployment and preventing outages.
- Plan for Electrification: Use AI-classified permit tags to map the adoption of rooftop solar, EV chargers, and electric heat pumps at the address level. This allows you to proactively identify circuits at risk of instability from these new loads and make targeted upgrades before customers are impacted.
Seamless Parcel Integration via Regrid
The strategic value is magnified by joining Shovels permit data with Regrid’s nationwide parcel data. Our common join key makes this seamless in ArcGIS, allowing you to instantly connect a permit to its specific land parcel. This enables you to:
- Overlay permit locations with zoning data to identify projects that may require a variance.
- Access property ownership information to initiate contact with developers.
- Analyze clusters of permits across contiguous parcels that indicate a large-scale phased development.
Implementation: Getting Started Today
Activating this intelligence layer is straightforward for ArcGIS users:
- Contact Esri Sales to get your hosted feature layer URL.
- Access the layer through your ArcGIS Online or ArcGIS Enterprise account.
- Create filtered views for your specific markets and permit types of interest.
- Optionally combine with Regrid parcel data using the common join field for deeper context.
The Future is Mappable
This integration represents a paradigm shift, moving from analyzing the past to mapping the future. By feeding the industry's most powerful geospatial platform with the most potent leading indicator of economic activity, we empower organizations to make smarter, faster, and more confident capital decisions.
For any organization whose success depends on understanding where and how our communities will grow, this data doesn't just provide information—it delivers a competitive advantage.
Ready to see the future of your market? Contact our team today for a demonstration.