

In the United States, 5G deployment has largely followed a simple rule: build where the people already are. Dense urban corridors reached broadband-speed 5G first. But housing growth is happening outside dense urban corridors.
New homes are appearing in mountain towns, agricultural counties, foothill suburbs, and smaller communities within commuting distance of major metros. Population is expanding in these places, but telecommunications infrastructure may be lagging.
That creates an interesting gap: networks expand based on existing population centers, but housing growth hints at where people might move next. This is where building permit data is useful. Permits offer an early signal of population shift. A permit filing reflects active developer interest, financing secured or in progress, and construction already underway or soon to begin. These signals can appear in permit data months or years before they show up in infrastructure planning cycles.
Where Construction Is Active, But Coverage Is Lagging
Using residential permit data from Shovels and coverage data from the FCC’s National Broadband Map, we looked at five counties outside major metros where construction activity spiked or grew steadily in the last five years: Bedford County, VA; Yuma County, AZ; Placer County, CA; Larimer County, CO; and Pima County, AZ.
They represent several different types of housing markets that sit outside the densest metropolitan cores. Some are smaller or rural counties absorbing spillover urban markets. Others are strong economies where major employers create steady housing demand. Others yet are resource and agricultural regions. Each county has a different story, but the same thread of 5G gaps runs them.
A Note on Methodology
We look specifically at residential permits (single-family homes, mobile/manufactured homes, multi-family housing, duplexes, and townhouses) from the Shovels database, aggregated by county FIPS code. Commercial and infrastructure permits were excluded.
All permit volumes are filtered by issue date. They exclude inactive permits and require a recorded approval duration.
To create the provider maps, we referenced the FCC's speed tier 1 data for mobile broadband. This refers to 5G at minimum speeds of 7 Mbps download and 1 Mbps upload, the lower of the two 5G tiers the FCC tracks. This tier reflects basic 5G connectivity. The higher tier (35/3 Mbps) sets the broadband standard. Using speed tier 1 (spd1) shows where any 5G signal exists, indexing a baseline for 5G coverage.
Bedford County, VA: 5G Catching Up to Blue Ridge Lakefront Boom
Wedged between Lynchburg and Roanoke along the U.S. 460 corridor in the Blue Ridge foothills, Bedford County has quietly become one of Virginia's fastest-growing rural counties. Its recent growth captures an ongoing trend about where Virginians are choosing to live. The county sits roughly 28 miles from each city center, close enough to commute to nearby cities but with far more affordable properties. Its population grew 3.5% between 2020 and 2024.
Smith Mountain Lake, Virginia's largest lake contained entirely within the Commonwealth, is also a remote-worker magnet. When lockdowns arrived in 2020, 431 waterfront homes sold that year, a 20-year record. In 2021, homes closed at 51.2% above assessed value, with the average price surging to \$916,302 from \$717,587 the prior year.
Residential permits tell a story of a market that responded decisively to low interest rates and pandemic-era demand.
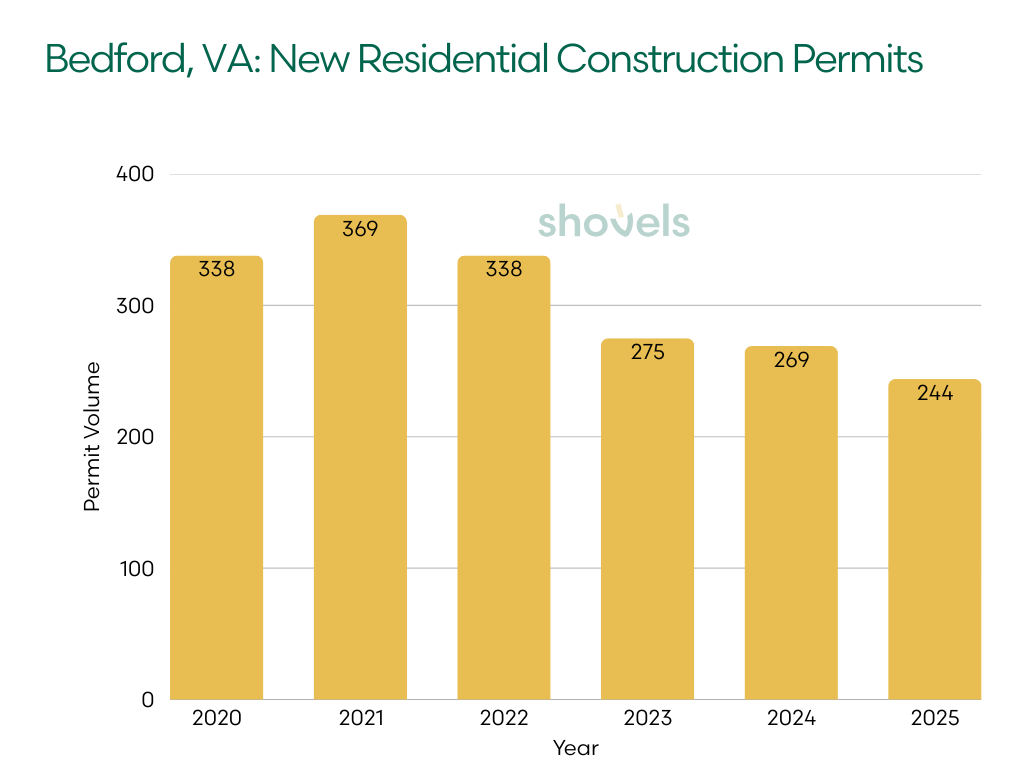
| Year | Permits | YoY % |
|---|---|---|
| 2020 | 338 | — |
| 2021 | 369 | +9.2% |
| 2022 | 338 | −8.4% |
| 2023 | 275 | −18.6% |
| 2024 | 269 | −2.2% |
| 2025 | 244 | −9.3% |
At a 338-unit baseline in 2020, Bedford was already building, and the 2021 uptick to 369 (+9.2%) corresponds directly to the SML sales frenzy and the first full year of the remote-work migration. Permits held through 2022 at 338, but the correction arrived in 2023.
2023 saw an 18.6% single-year drop to 275 permits. Construction activity contracted across non-metro Virginia, likely a response to high interest rates and elevated materials costs. Now, Bedford is building at roughly 66% of its pandemic peak. That said, the remote workers who doubled the county's work-from-home headcount significantly increased the county’s broadband needs.
5G Coverage in Bedford County
Overall 5G coverage for Bedford is strong, at 66.8%. All three national networks show their strongest footprints near the urban edges of Roanoke and Lynchburg and along the US-460 highway spine connecting the two metros.
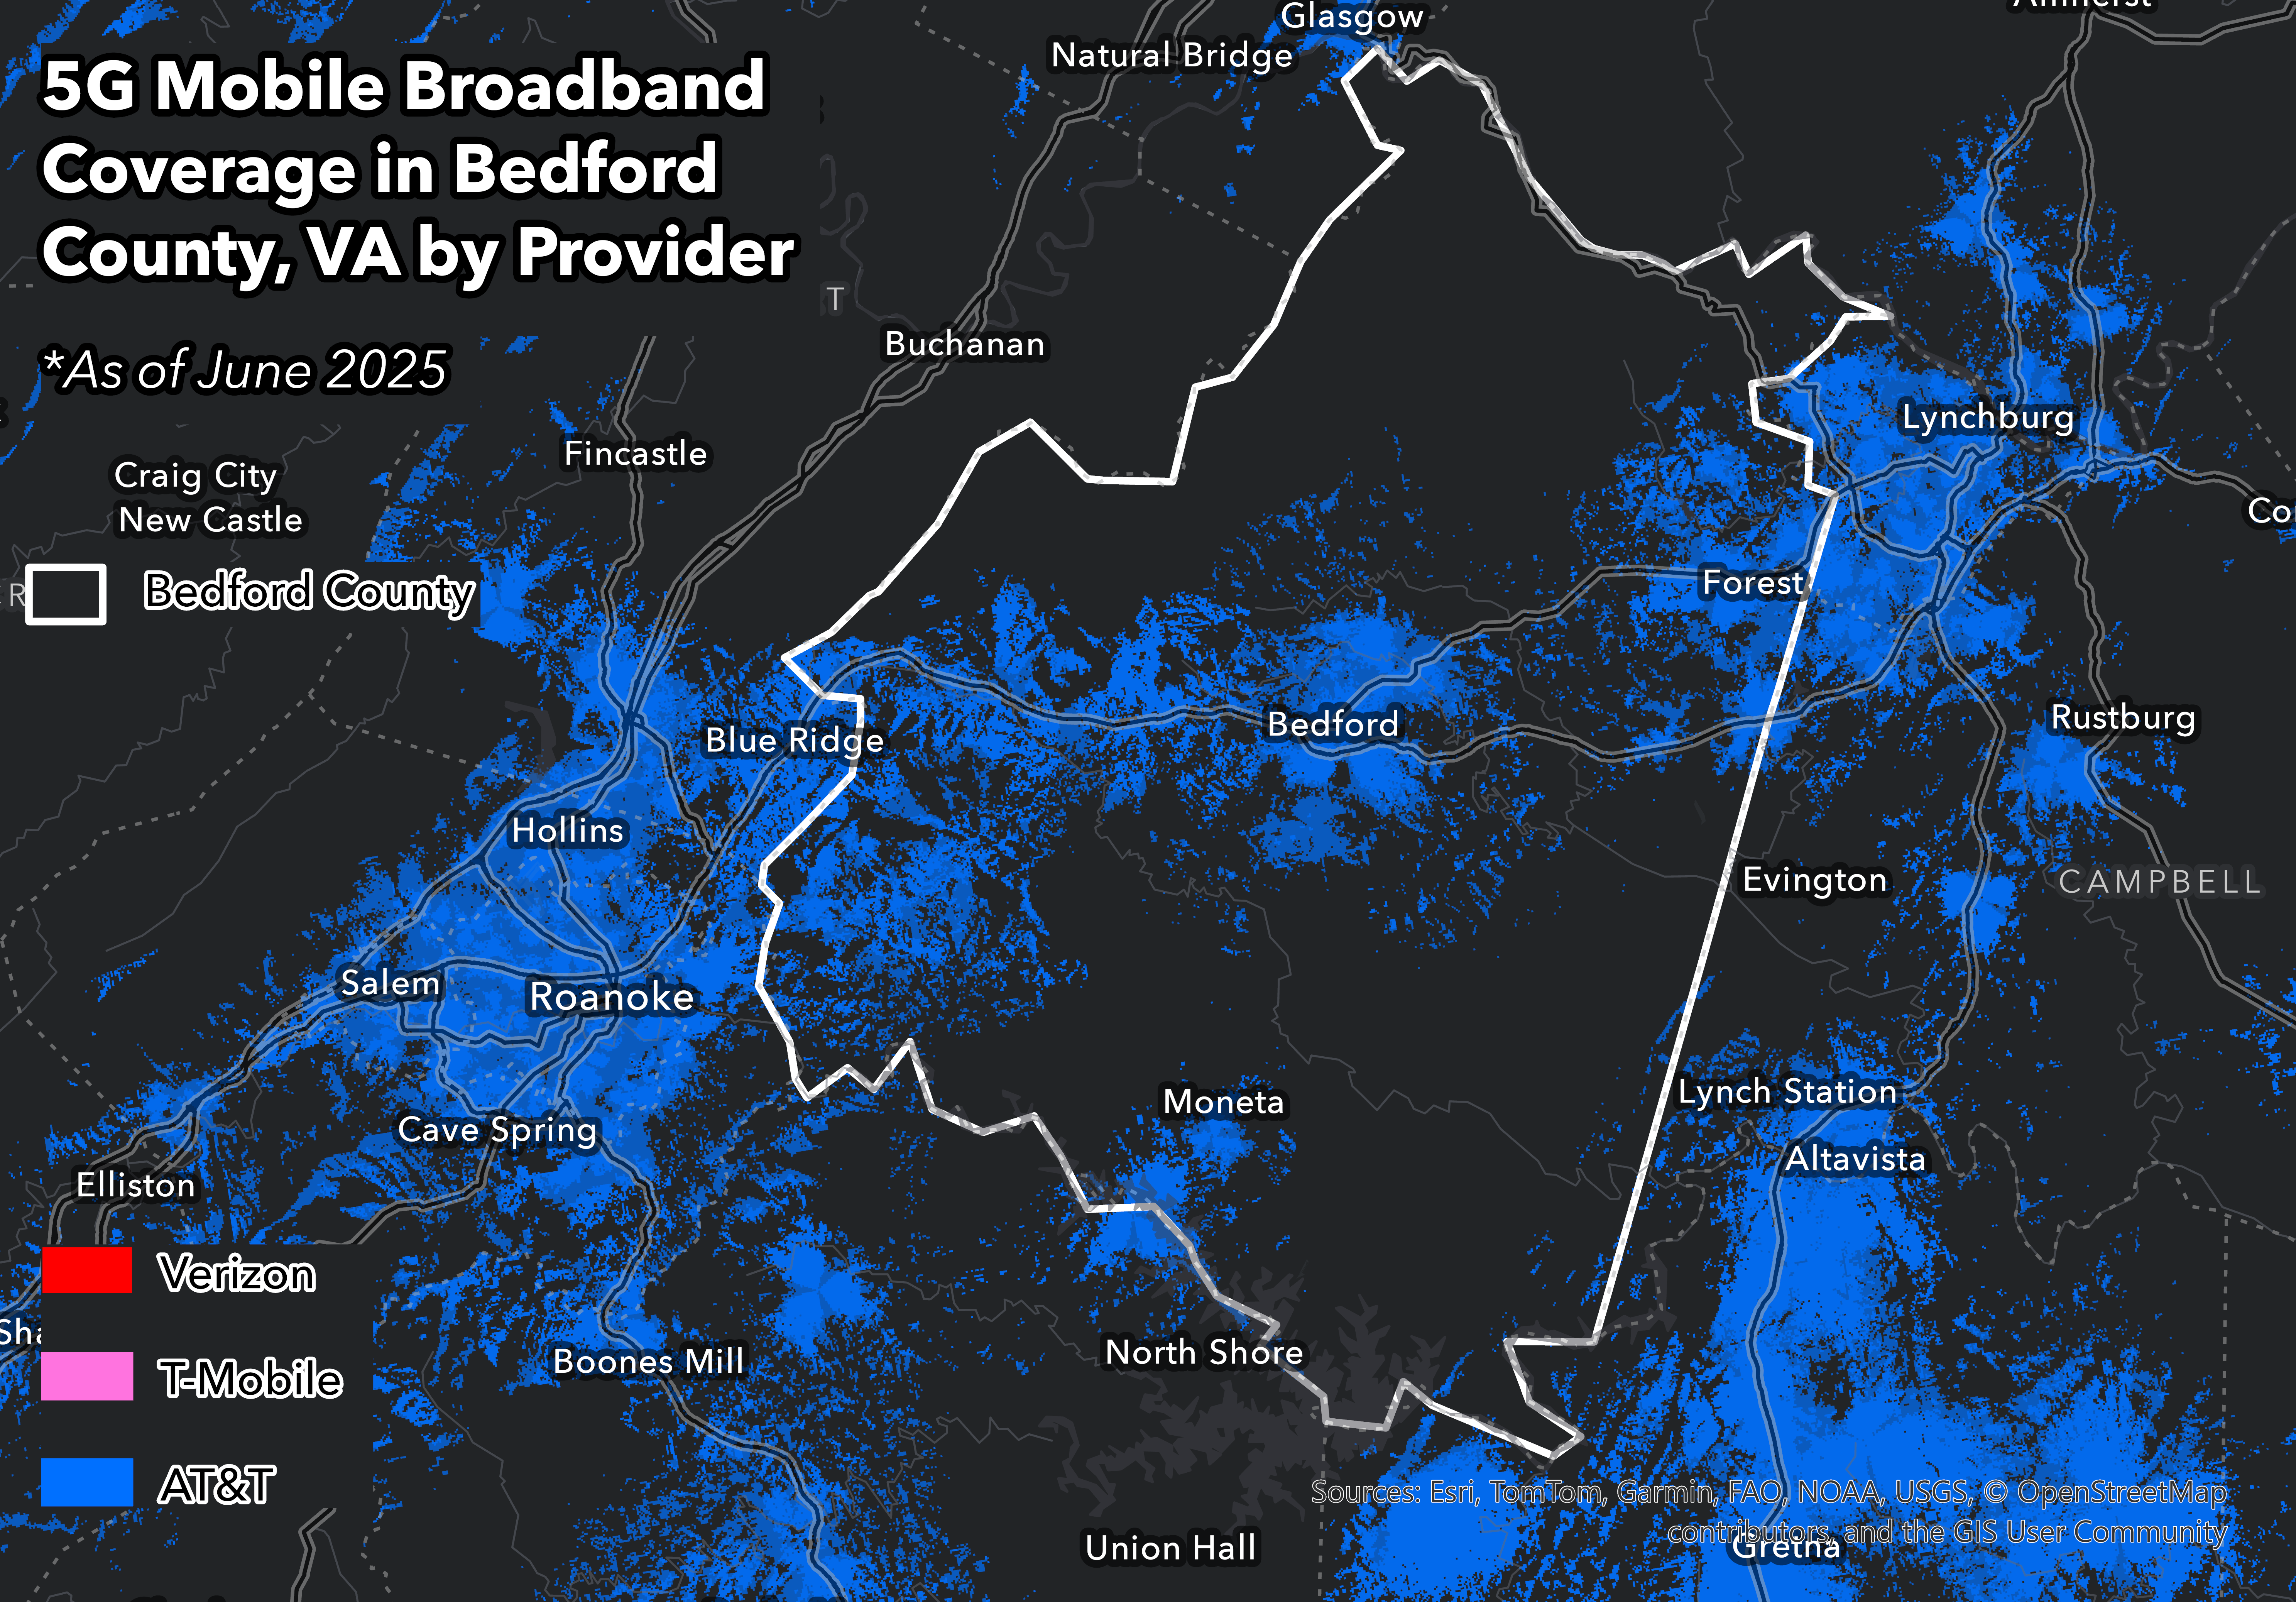
AT&T 5G (spd1) coverage — Bedford County, VA
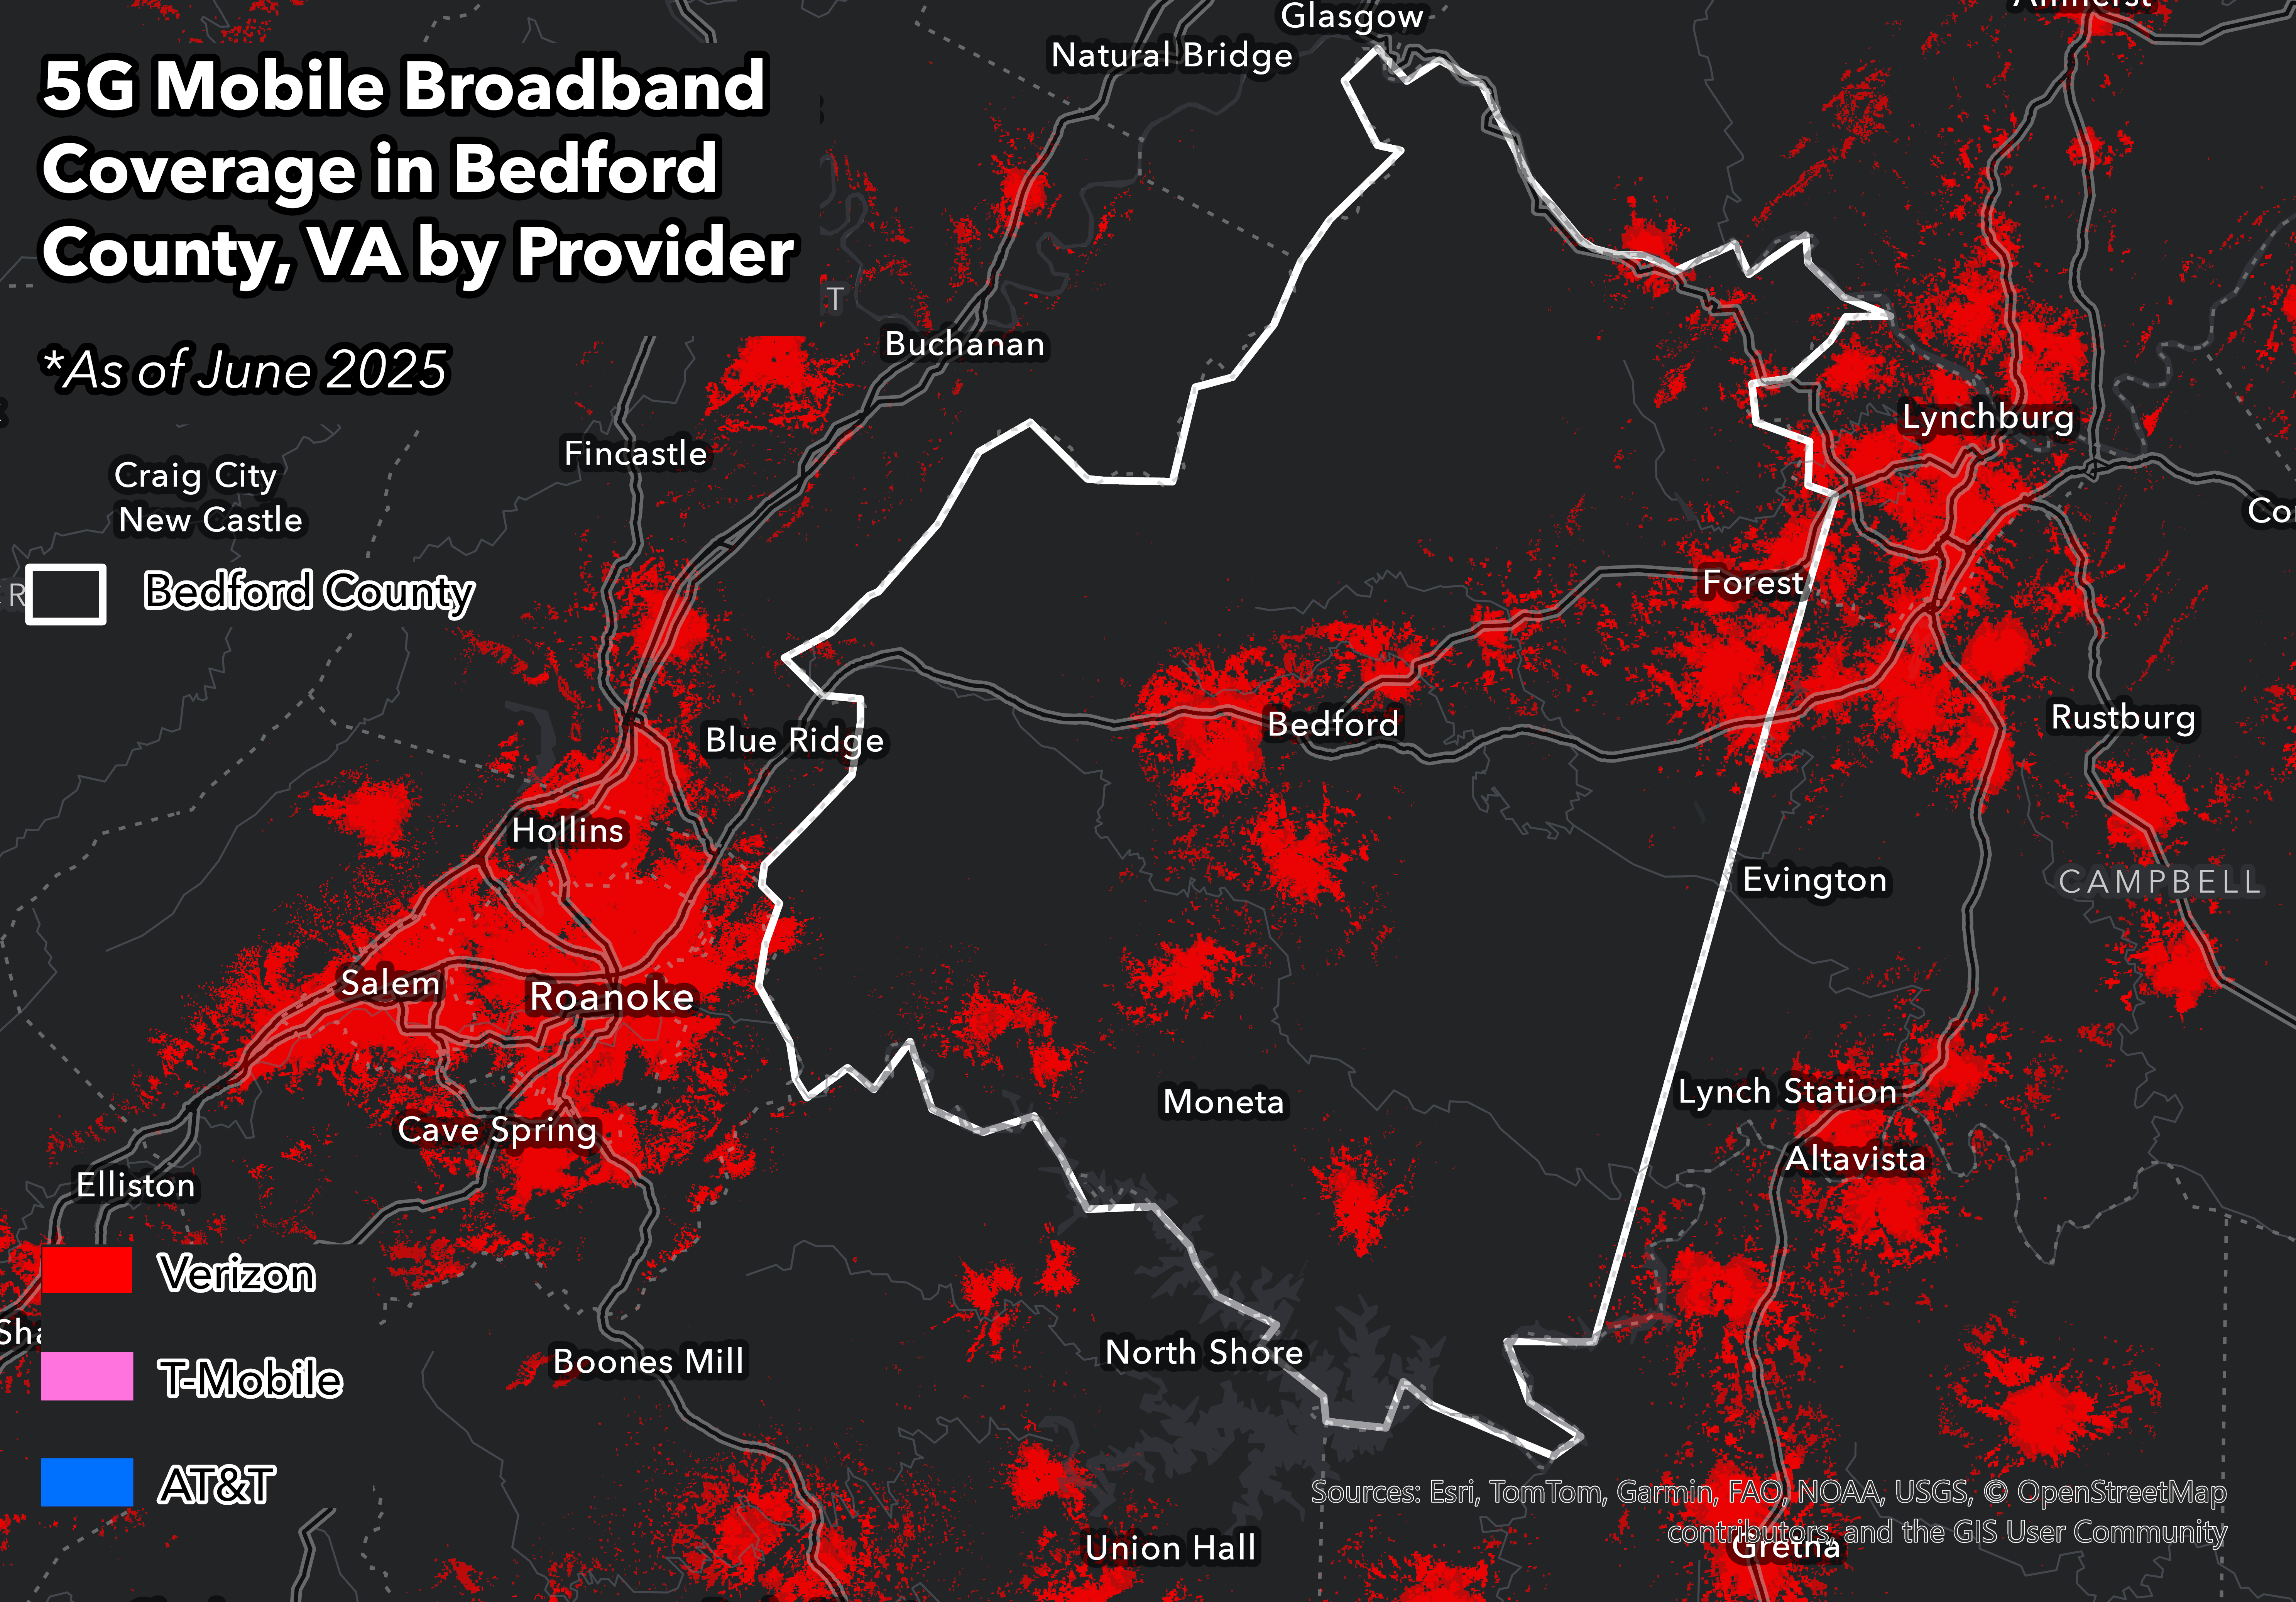
Verizon 5G (spd1) coverage — Bedford County, VA
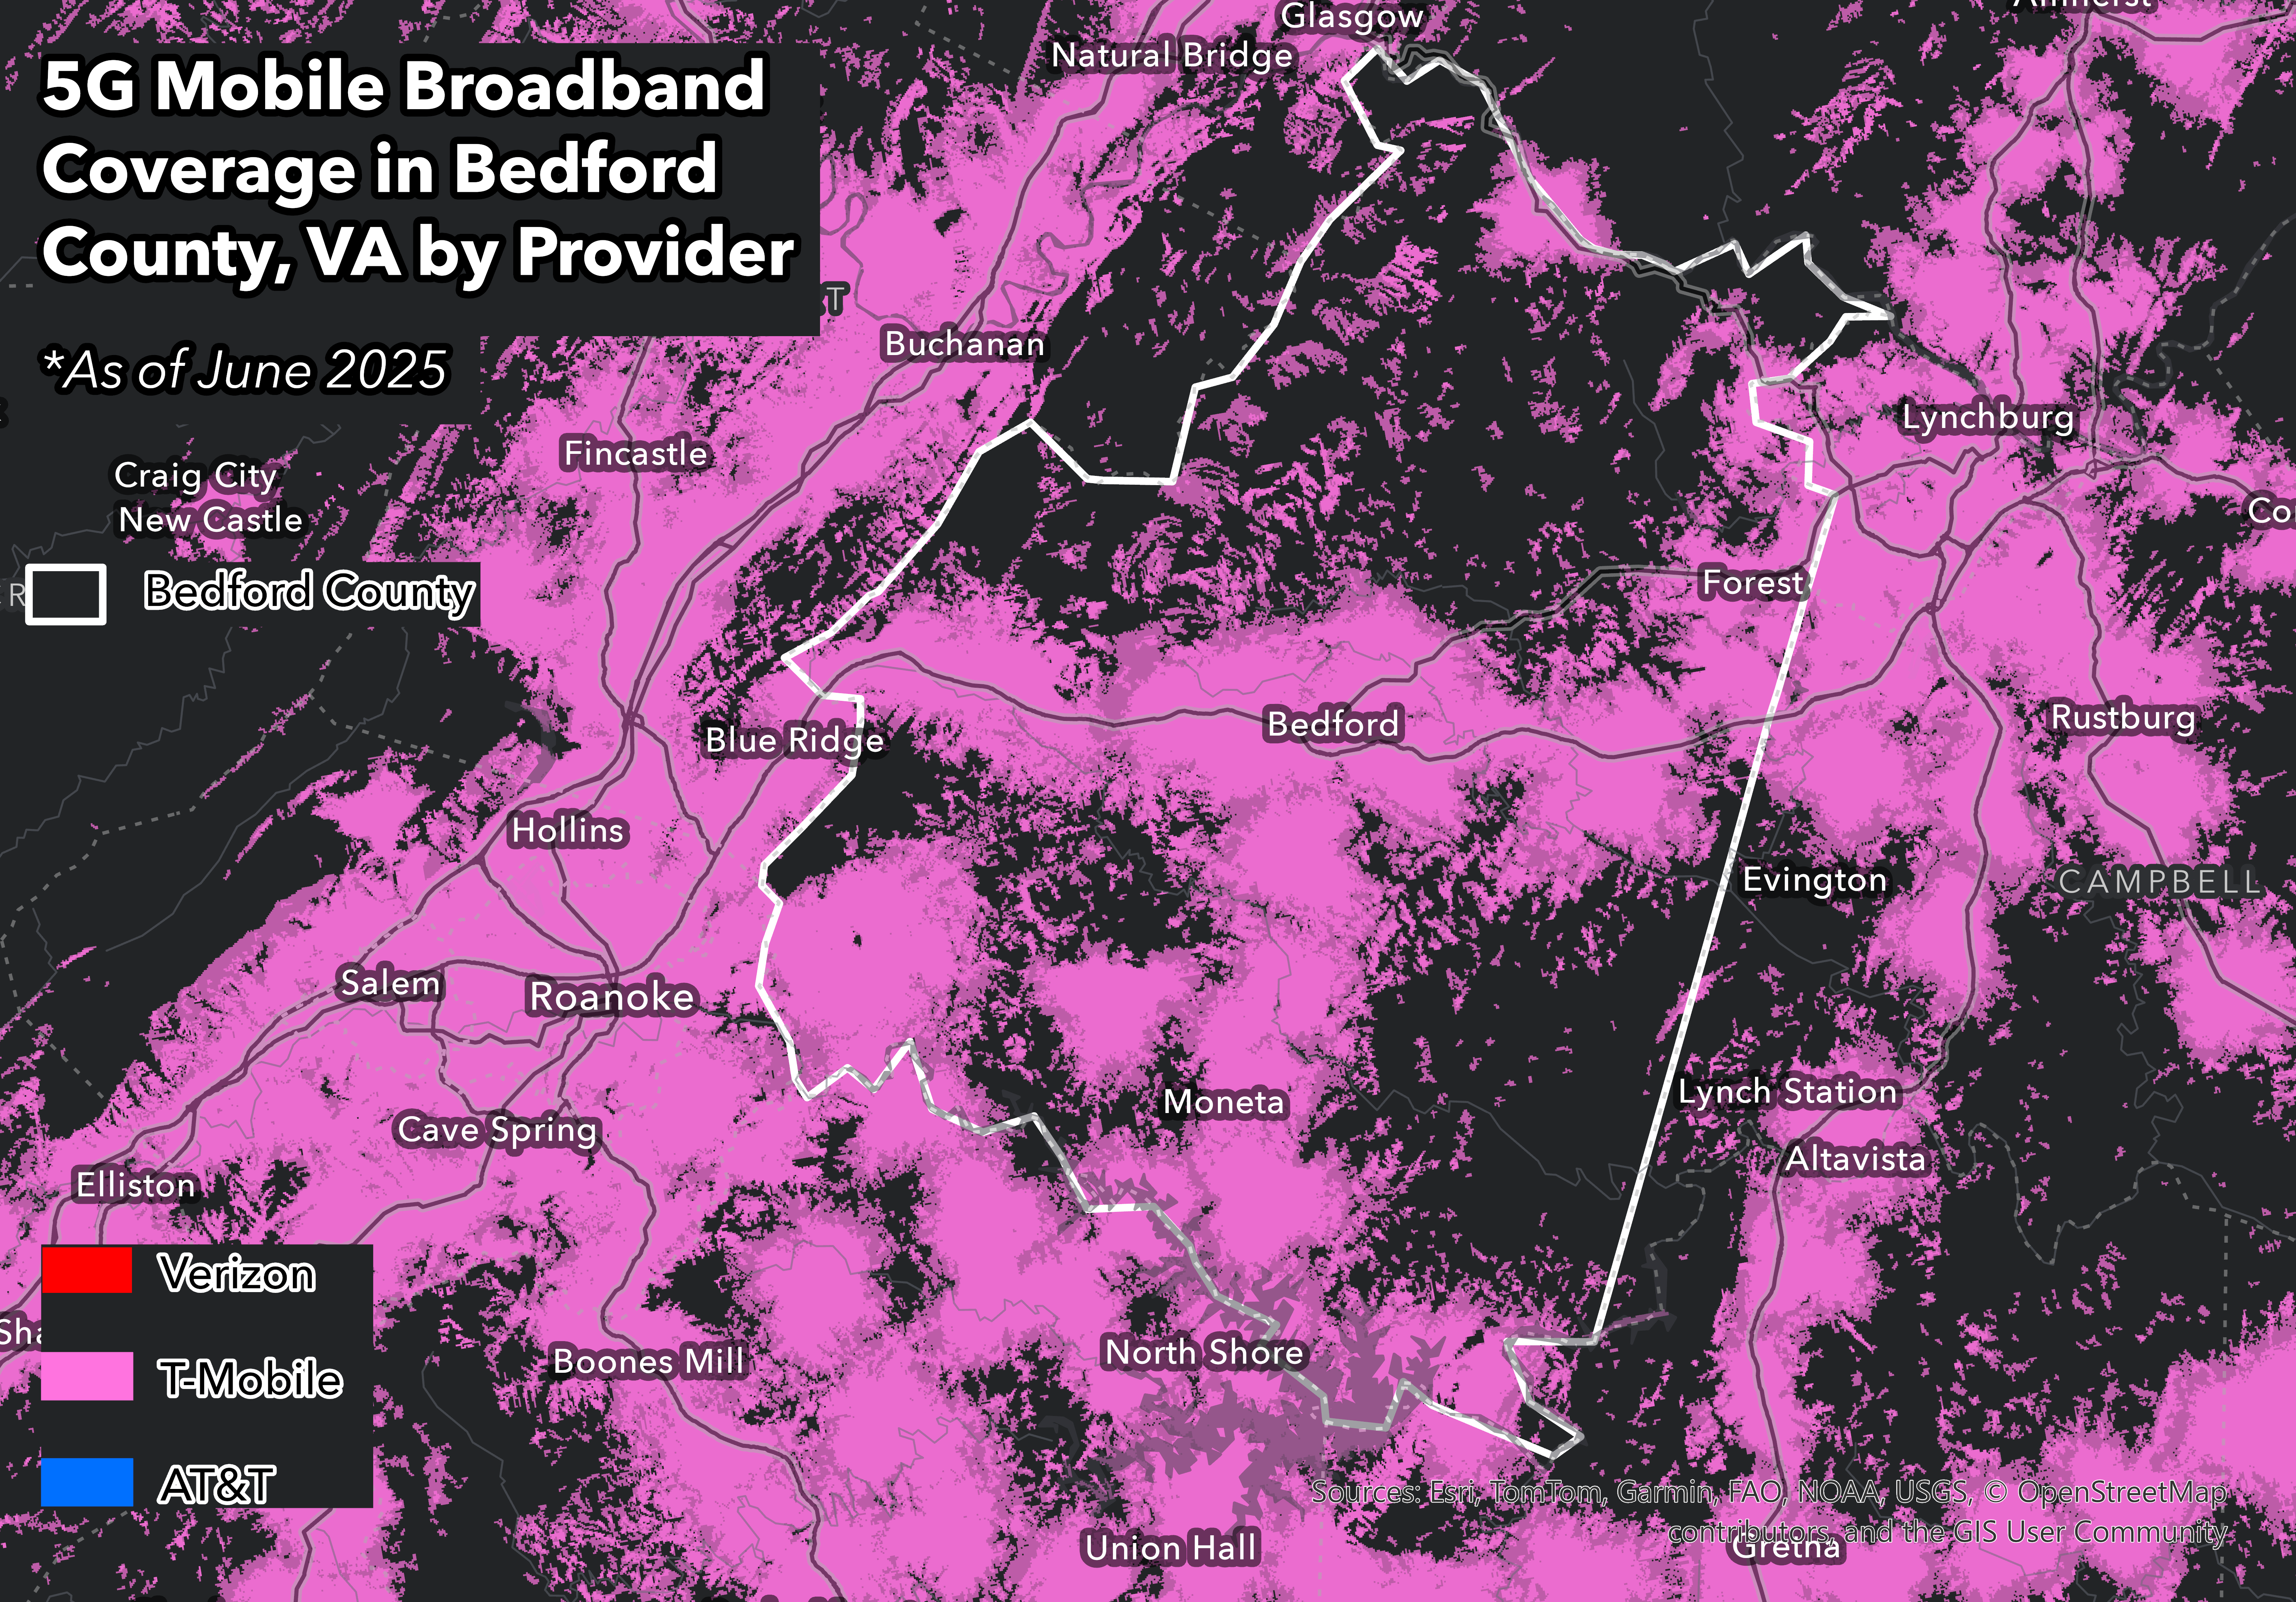
T-Mobile 5G (spd1) coverage — Bedford County, VA
Coverage thins quickly as it moves away from this east-west corridor into Bedford County’s interior hills and lake communities. It’s likely that infrastructure expanded outward from existing cities.
T-Mobile shows by far the broadest footprint, spreading across much of the corridor and into surrounding rural areas. Verizon appears concentrated around the urban clusters, with coverage breaking into smaller pockets tied to towns and highways. AT&T sits between the two, maintaining solid corridor coverage but leaving larger gaps across the county’s interior.
Overall, coverage shows a commuter county whose wireless infrastructure is still anchored to the neighboring metros.
Yuma County, AZ: Agricultural Powerhouse With a Connectivity Gap
Yuma County produces 80–90% of America's leafy greens during winter months, a concentration the University of Arizona has compared to Silicon Valley's share of the tech industry. The farms run year-round across hundreds of thousands of irrigated acres along the Colorado River.
Currently, permit activity in Yuma County shows renewed growth. After the initial 2021 baseline of 944 permits, construction cooled during 2022–2023. The slowdown ended in 2024, when permits climbed to 983 units, surpassing the earlier baseline and marking the strongest year so far.
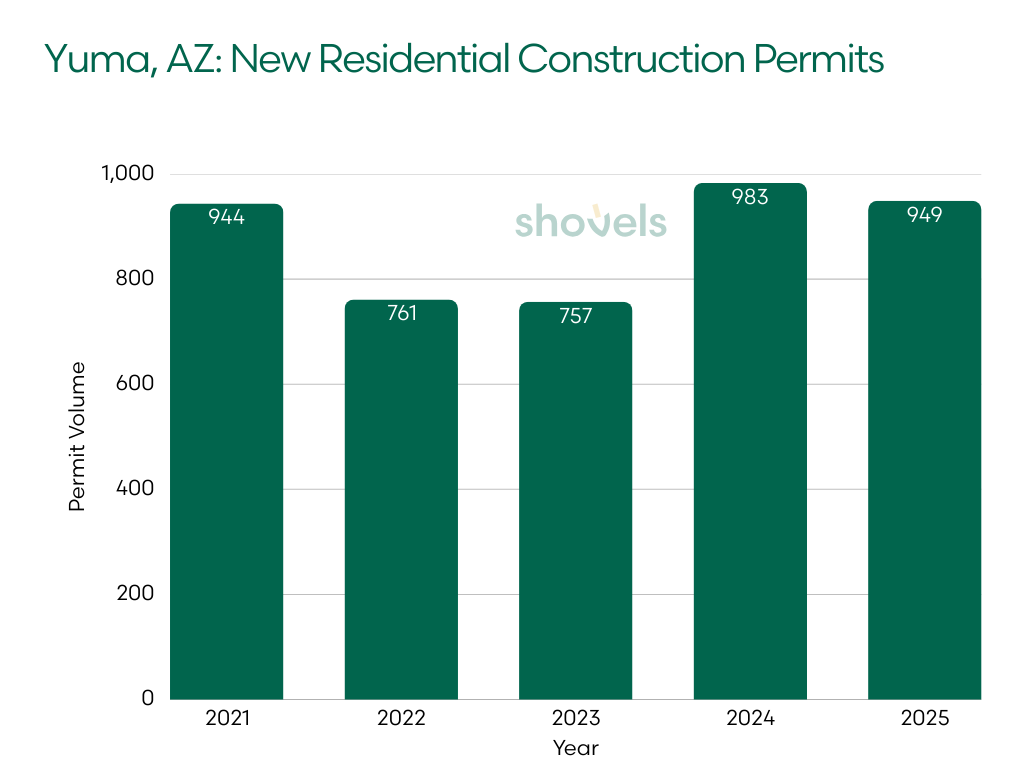
| Year | Permits | YoY |
|---|---|---|
| 2021 | 944 | - |
| 2022 | 761 | −19% |
| 2023 | 757 | flat |
| 2024 | 983 | +30% |
| 2025 | 949 | −4% |
Population has also grown roughly 6.7% between 2020 and 2024, reaching approximately 222,000. Growth is steady rather than dramatic, driven by agricultural labor, a regional services economy, and Yuma's position as the commercial hub for southwestern Arizona and the border region.
The 2025 total of 949 permits suggests the higher level of construction is holding rather than retreating. In other words, the 2022–2023 dip was a brief pause, and by 2024, local housing demand is resuming and pushing construction higher.
Here, mobile connectivity serves multiple functions. It isn't just about new residents or workers commuting. Precision agriculture sensors, irrigation management, harvest logistics, worker communication, and other commercial needs matter alongside residential coverage.
5G Coverage in Yuma County
Overall 5G coverage is at 39.3%, concentrated along the Colorado River corridor, centered on the city of Yuma and extending east along the region’s main highway and population corridor.
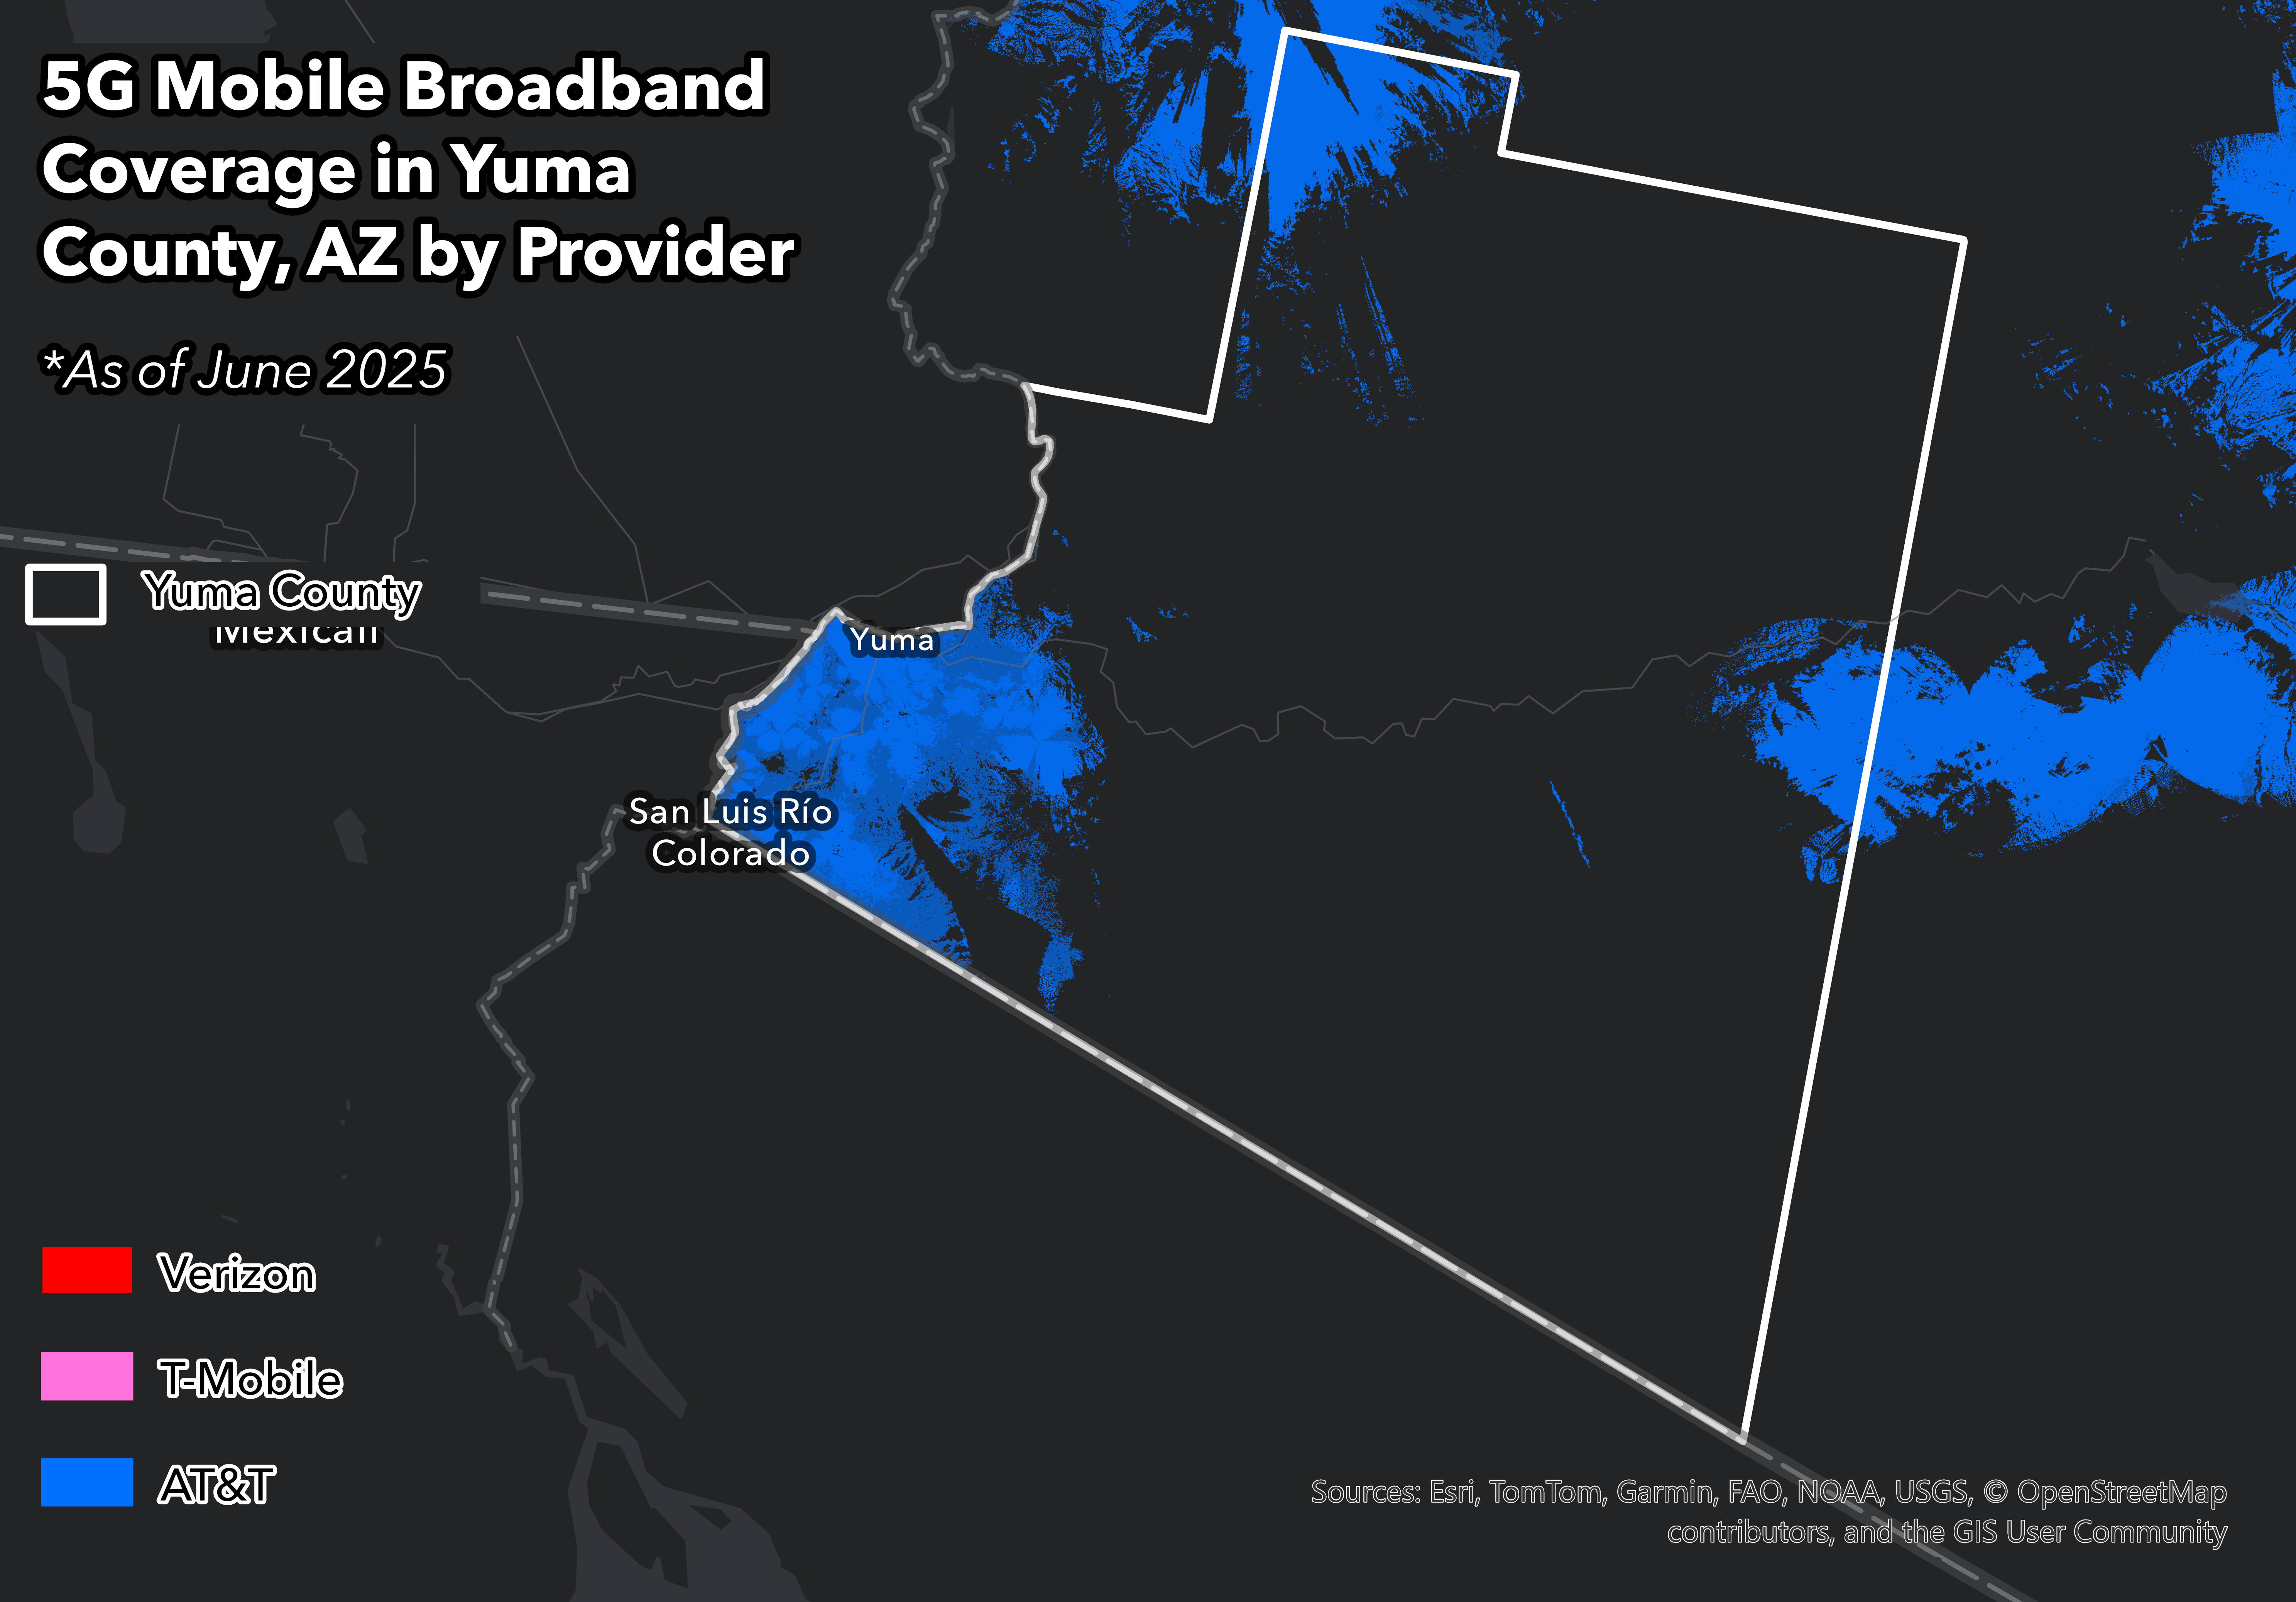
AT&T 5G (spd1) coverage — Yuma County, AZ
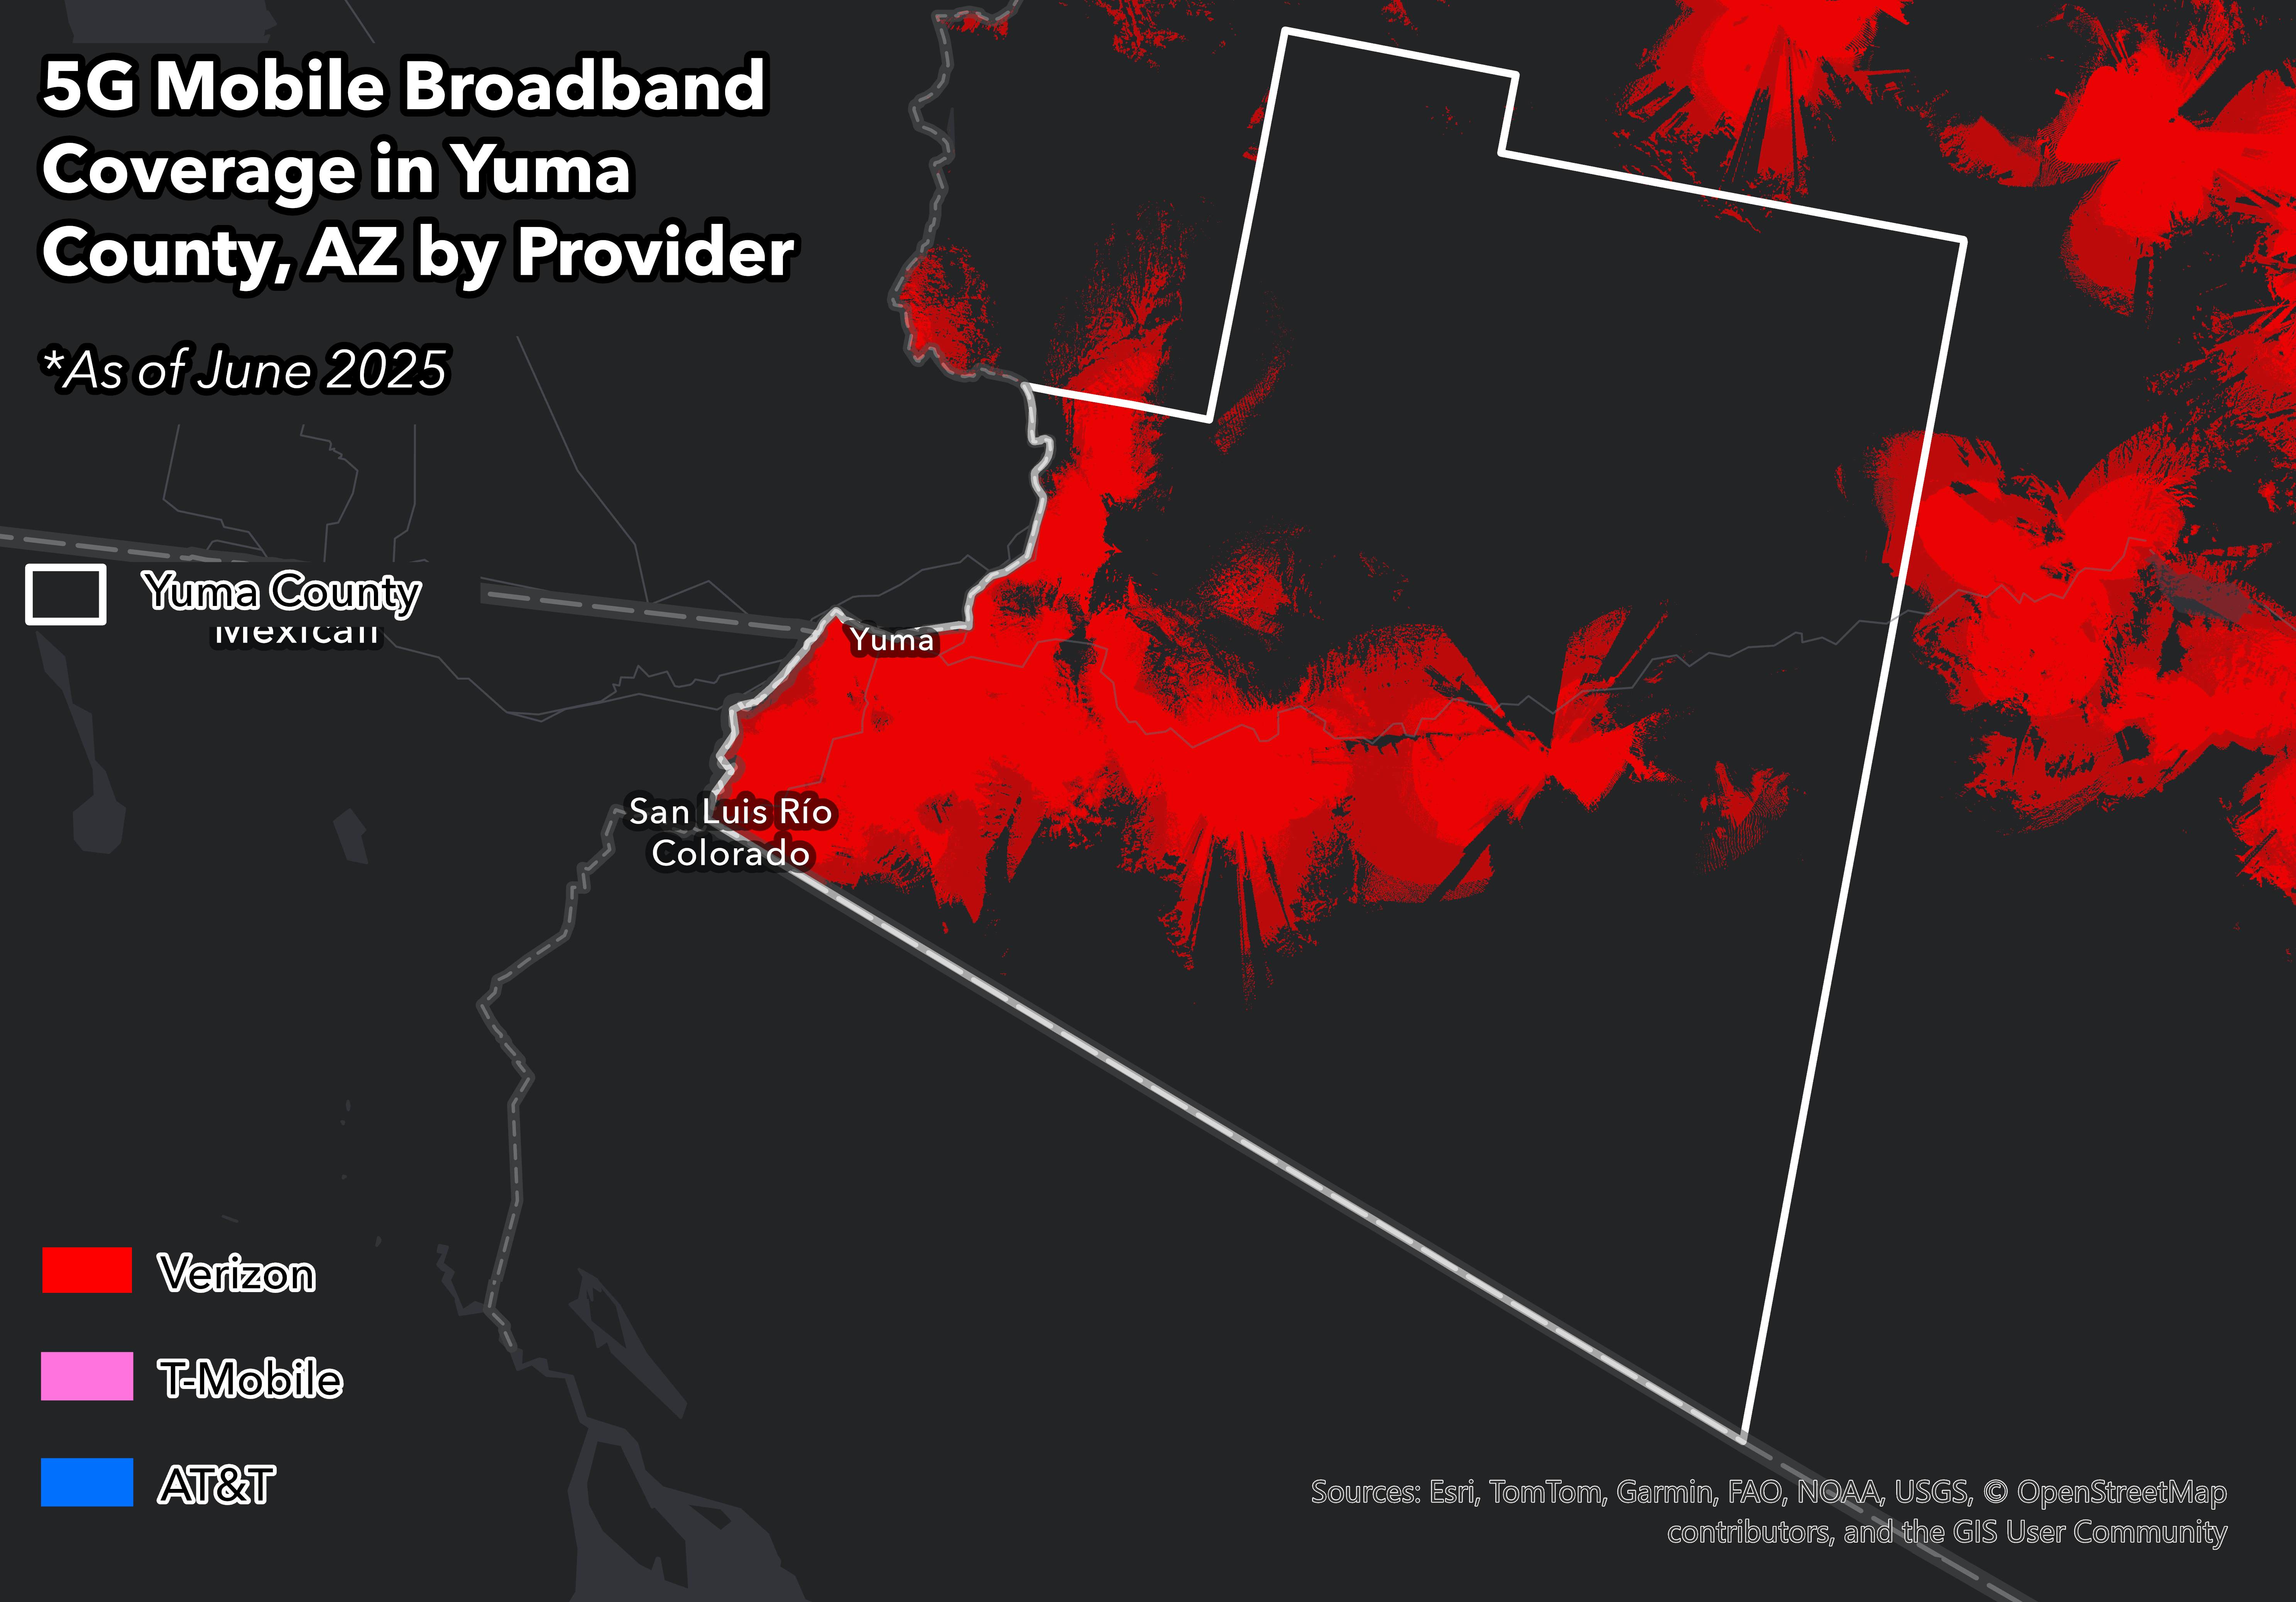
Verizon 5G (spd1) coverage — Yuma County, AZ
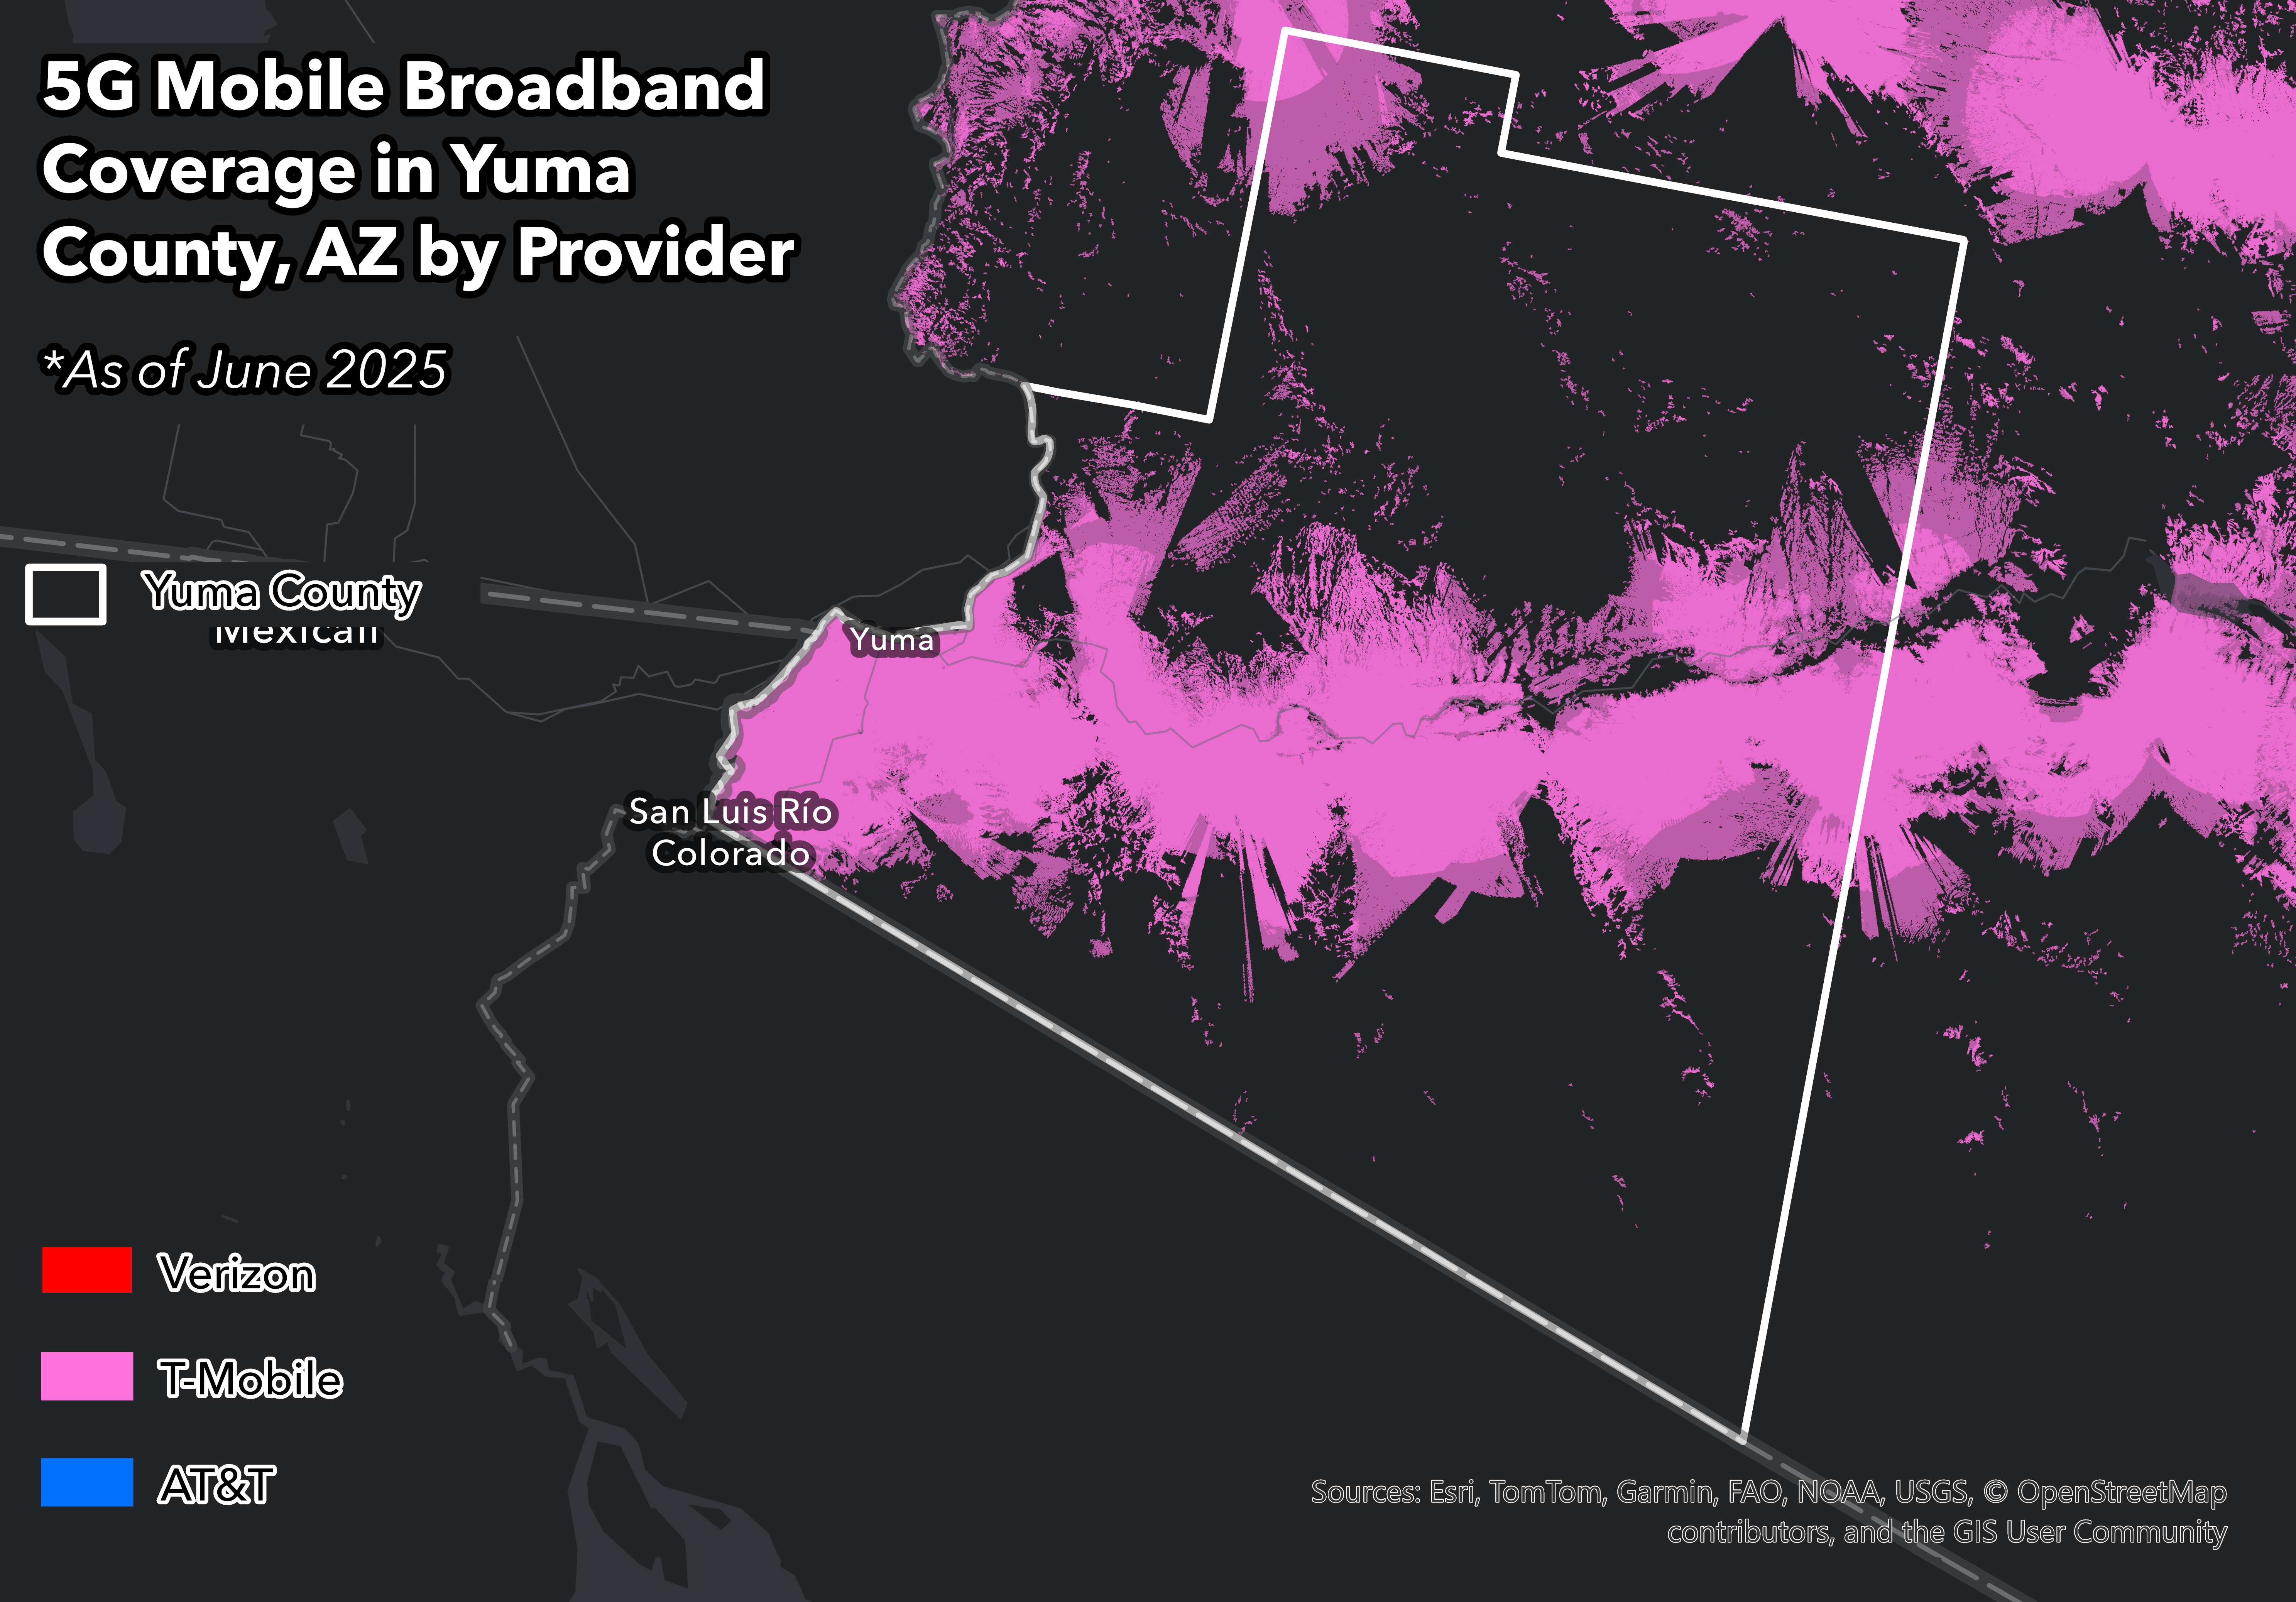
T-Mobile 5G (spd1) coverage — Yuma County, AZ
Again, T-Mobile shows the broadest footprint, with dense coverage across Yuma city and spreading widely through the irrigated agricultural belt along the Colorado River. Verizon is nearly as extensive, covering the same core corridor with strong saturation across the farming region west of the city. AT&T covers Yuma proper and the immediate river corridor but pulls back more quickly into the surrounding desert, leaving a thinner footprint.
All three carriers concentrate on the irrigated strip along the Colorado, not the dry interior to the east and south. Beyond that corridor, coverage thins. The result is a clear gap across the rural landscape that supports much of the county’s agricultural economy.
Placer County, CA: Underserved Bay Area Migration
Placer County spans one of the more geographically varied footprints in California. It extends from the Sacramento Valley floor (Lincoln, Rocklin, Roseville) through the Sierra Nevada foothills (Auburn, Colfax, Applegate) to Donner Pass at 7,056 feet. The foothill stretch, accessible via I-80 and within two hours of the Bay Area, became one of the primary destinations for pandemic-era remote-work migration.
We see this reflected in building permit activity, which surged 83% in 2021, as pandemic-era migration from the Bay Area accelerated. Construction remained elevated in 2022, holding near the peak.
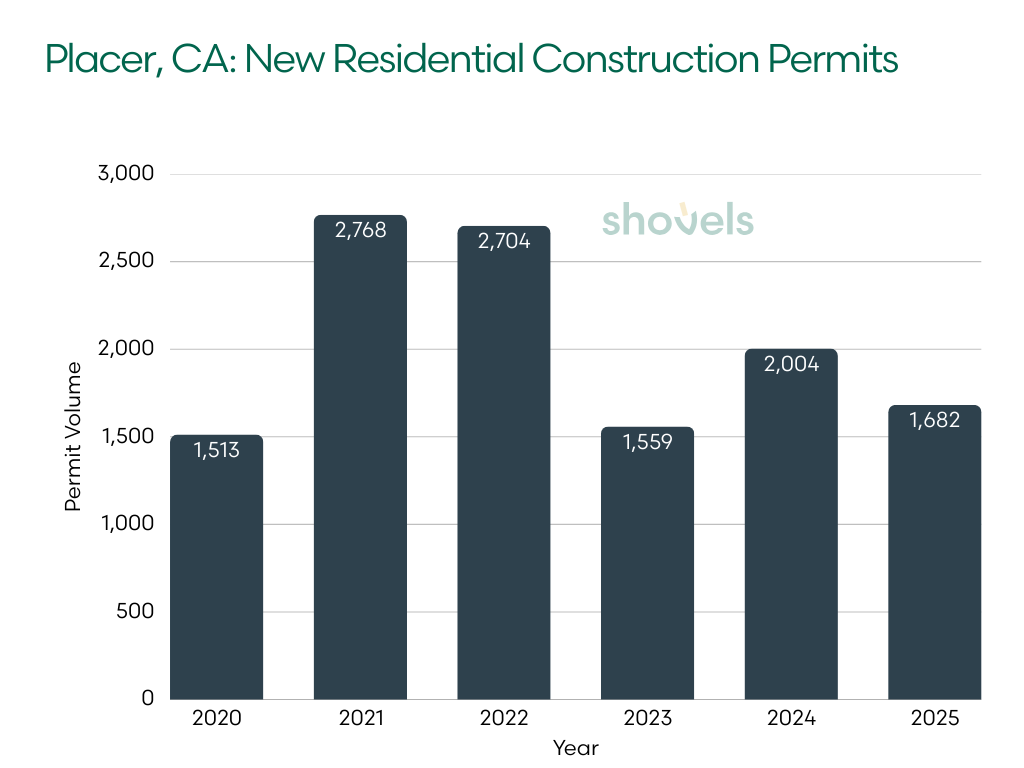
| Year | Permits | YoY |
|---|---|---|
| 2020 | 1,513 | — |
| 2021 | 2,768 | +83% (peak) |
| 2022 | 2,704 | −2% |
| 2023 | 1,559 | −42% |
| 2024 | 2,004 | +29% |
| 2025 | 1,682 | −16% |
Bay Area residents found they could own a home with land and space at lower costs, while staying close enough for occasional office trips. Placer's population grew 7.2% between 2020 and 2024.
As mortgage rates rose, permits fell 42% in 2023, returning almost exactly to the pre-pandemic baseline. Activity partially recovered in 2024, but 2025 slipped again to 1,682 permits, slightly above 2020 levels.
The coverage gap matters most for households that arrived during the 2021–2022 surge. Many came expecting suburban proximity to Sacramento while settling in foothill communities where wireless coverage is thinner than in the valley.
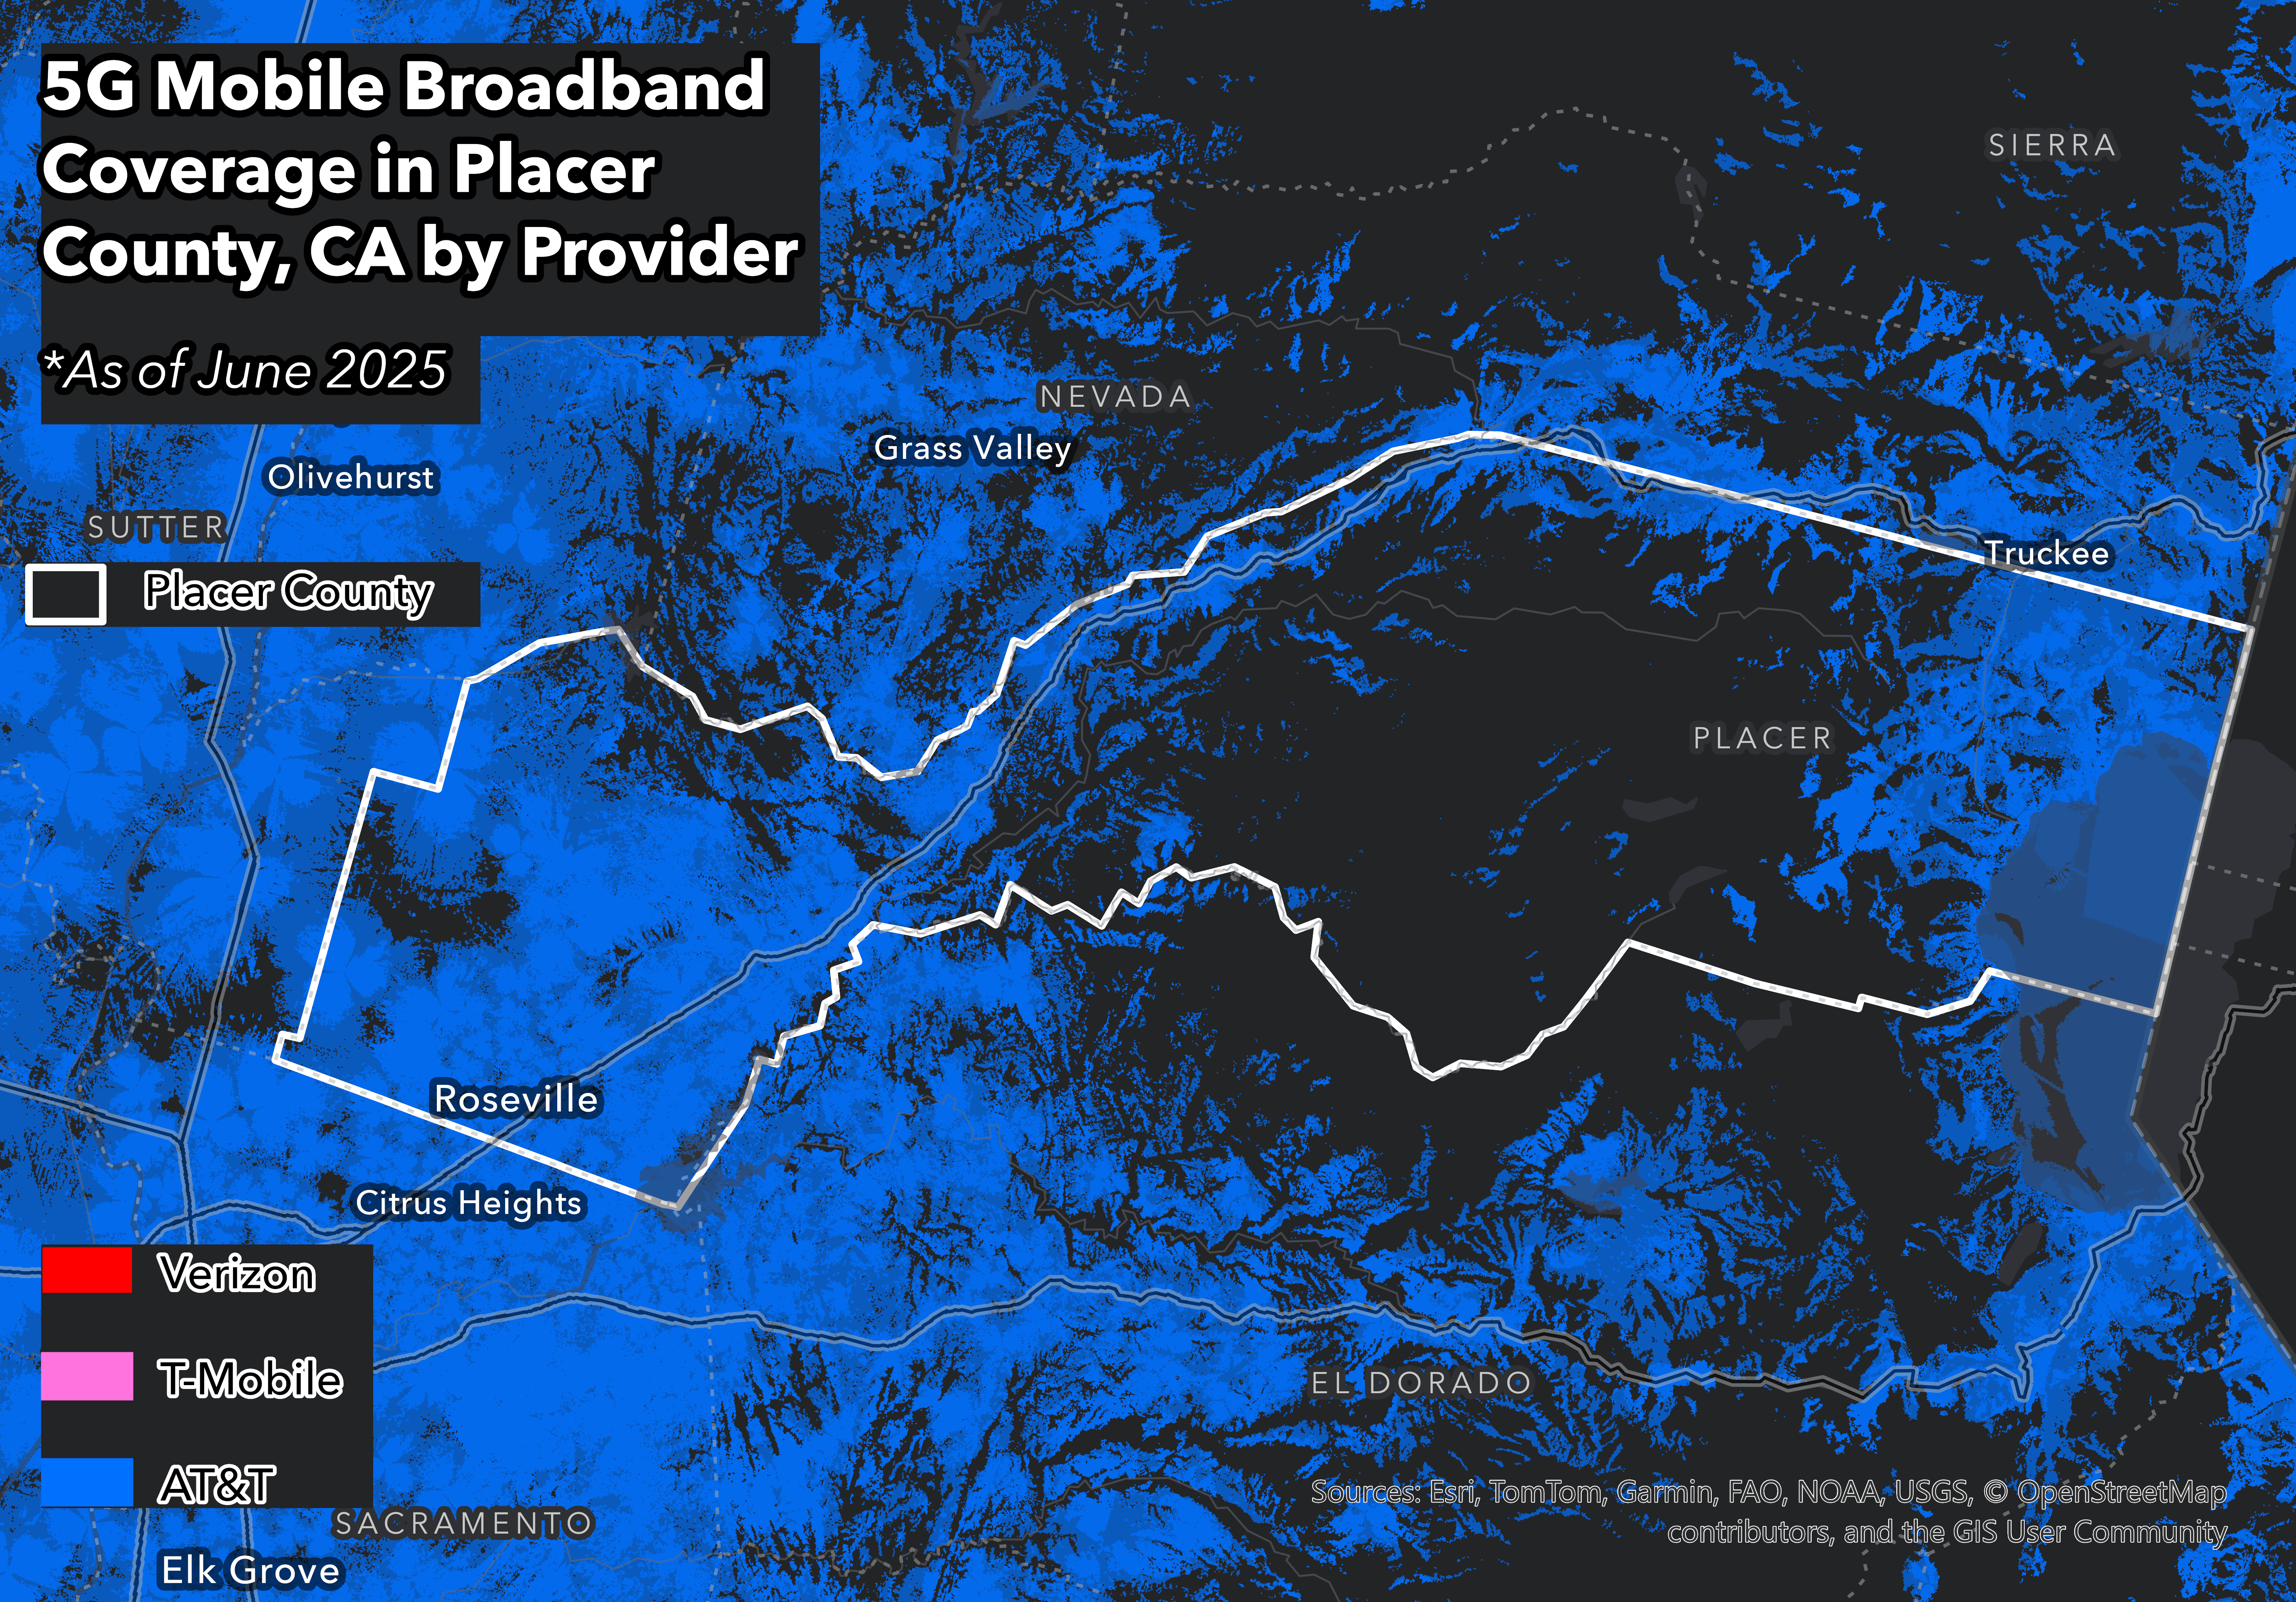
AT&T 5G (spd1) coverage — Placer County, CA
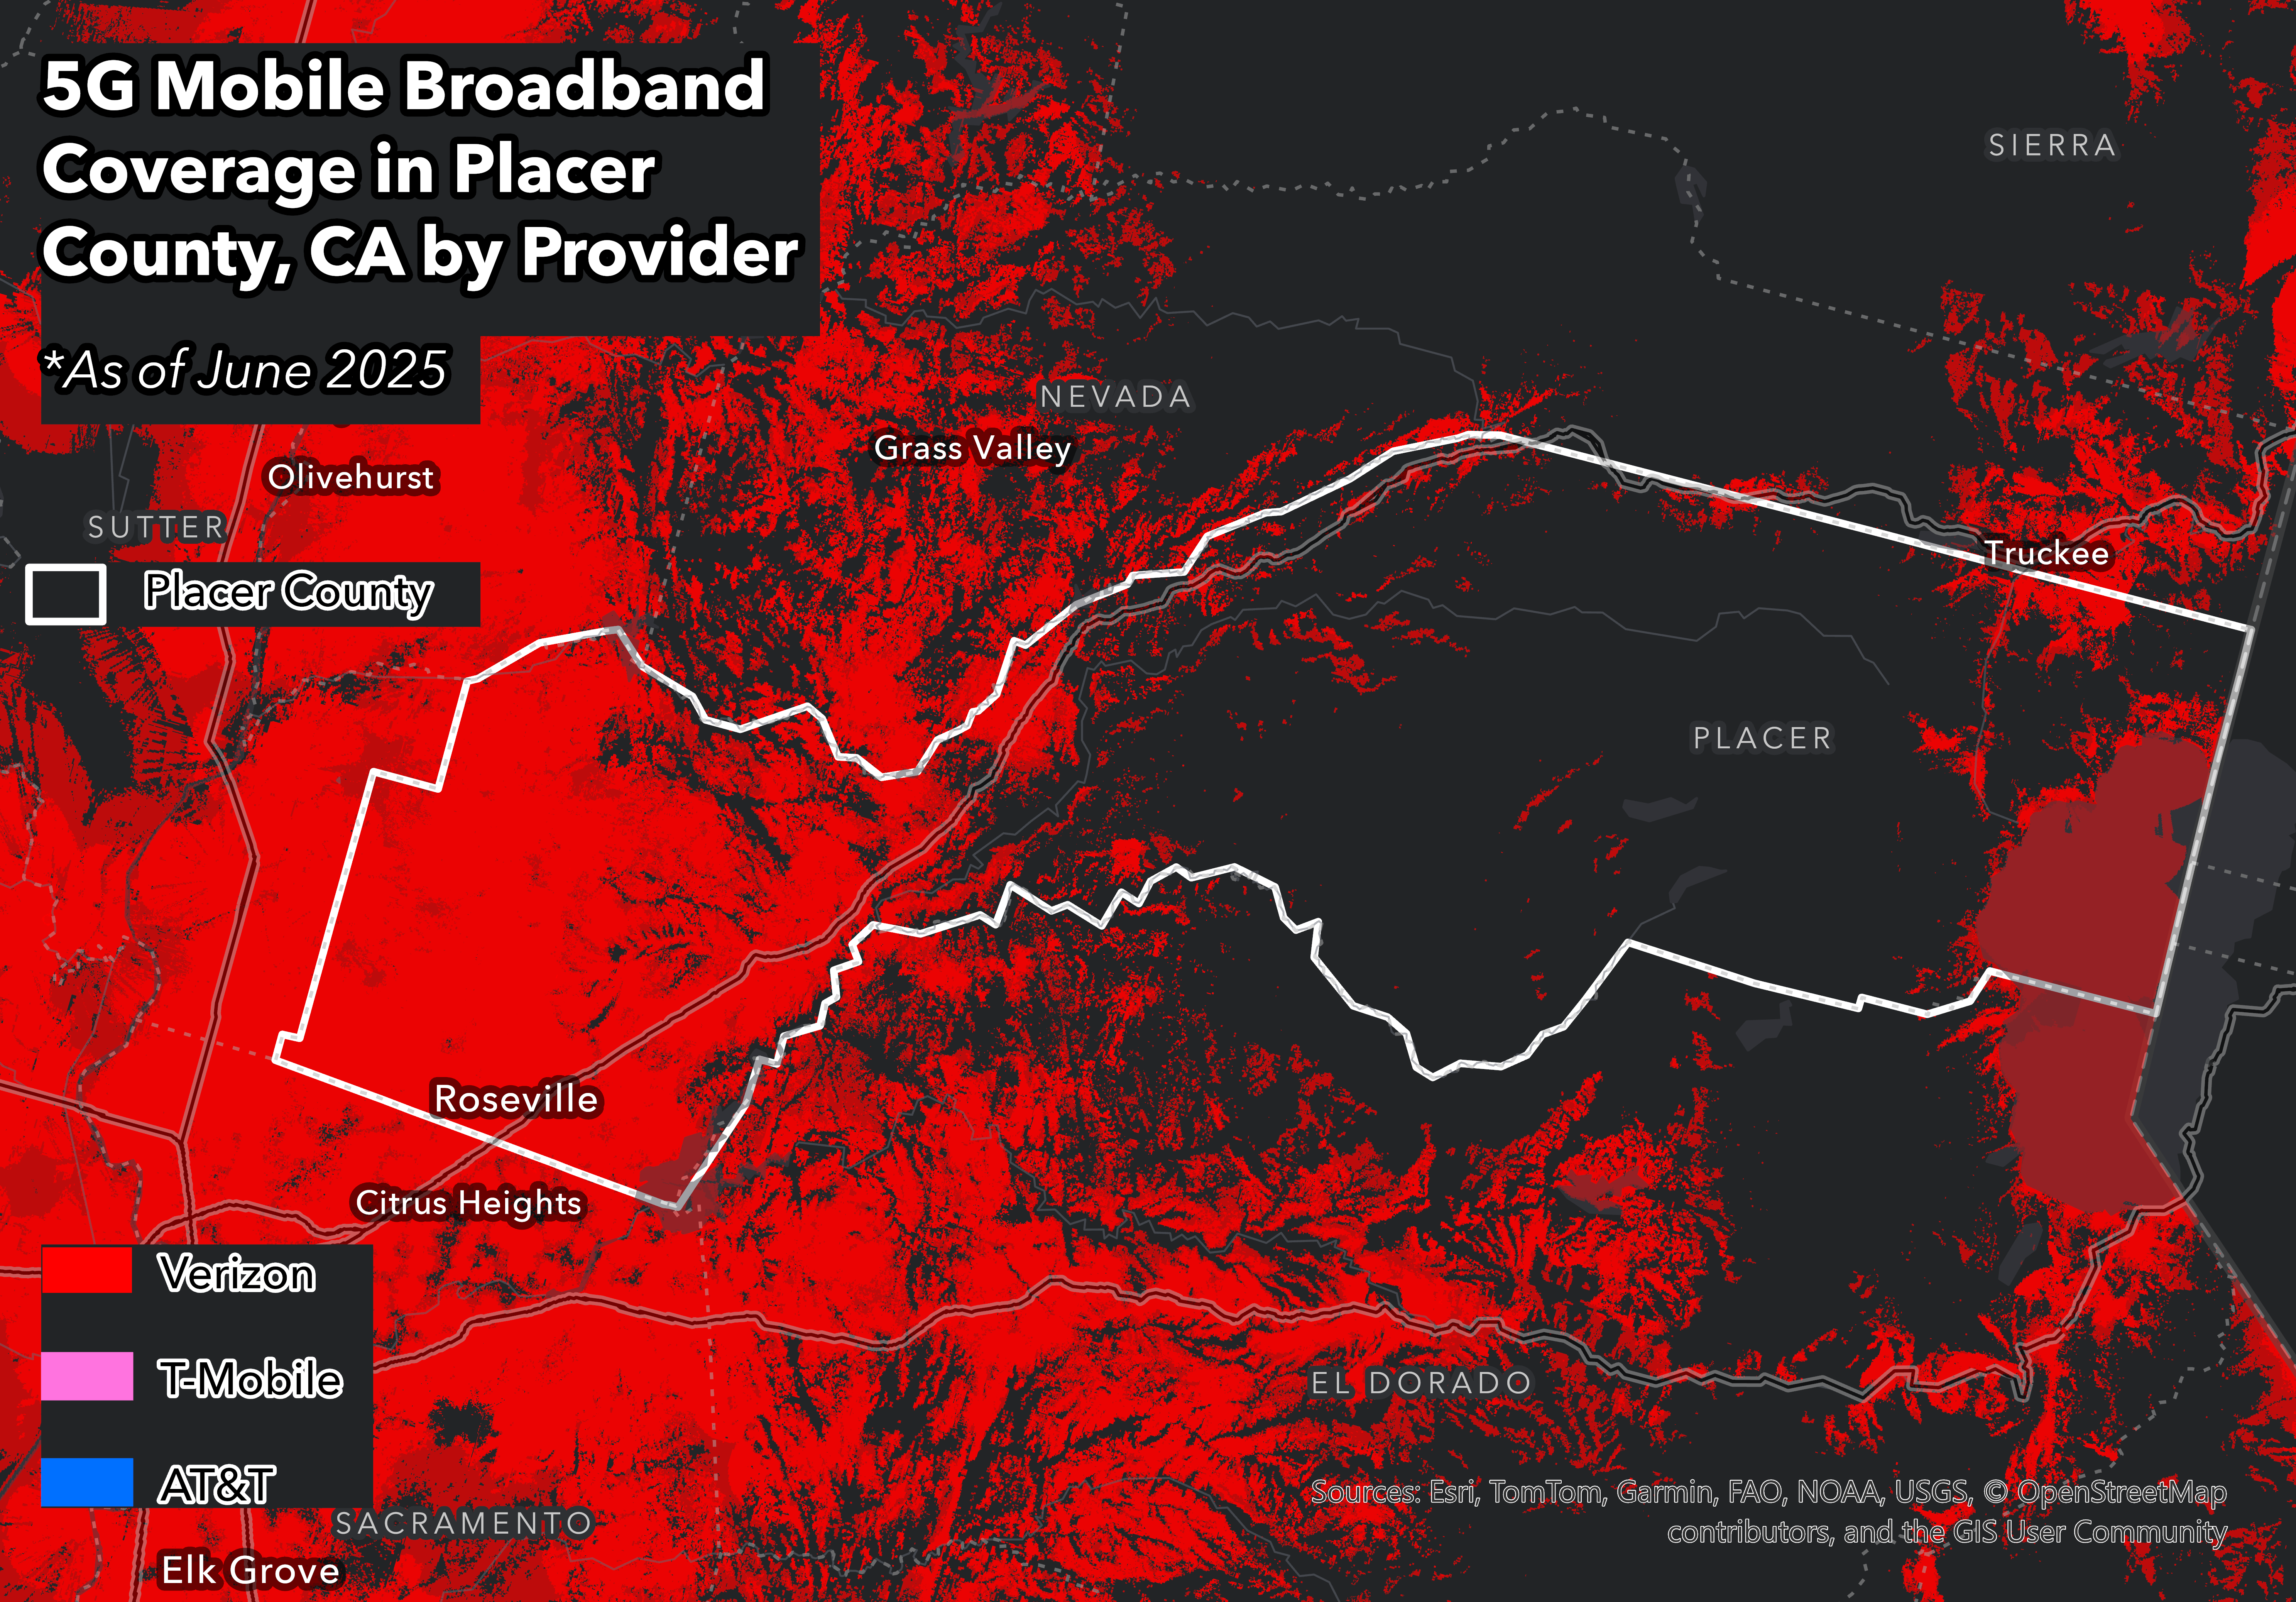
Verizon 5G (spd1) coverage — Placer County, CA
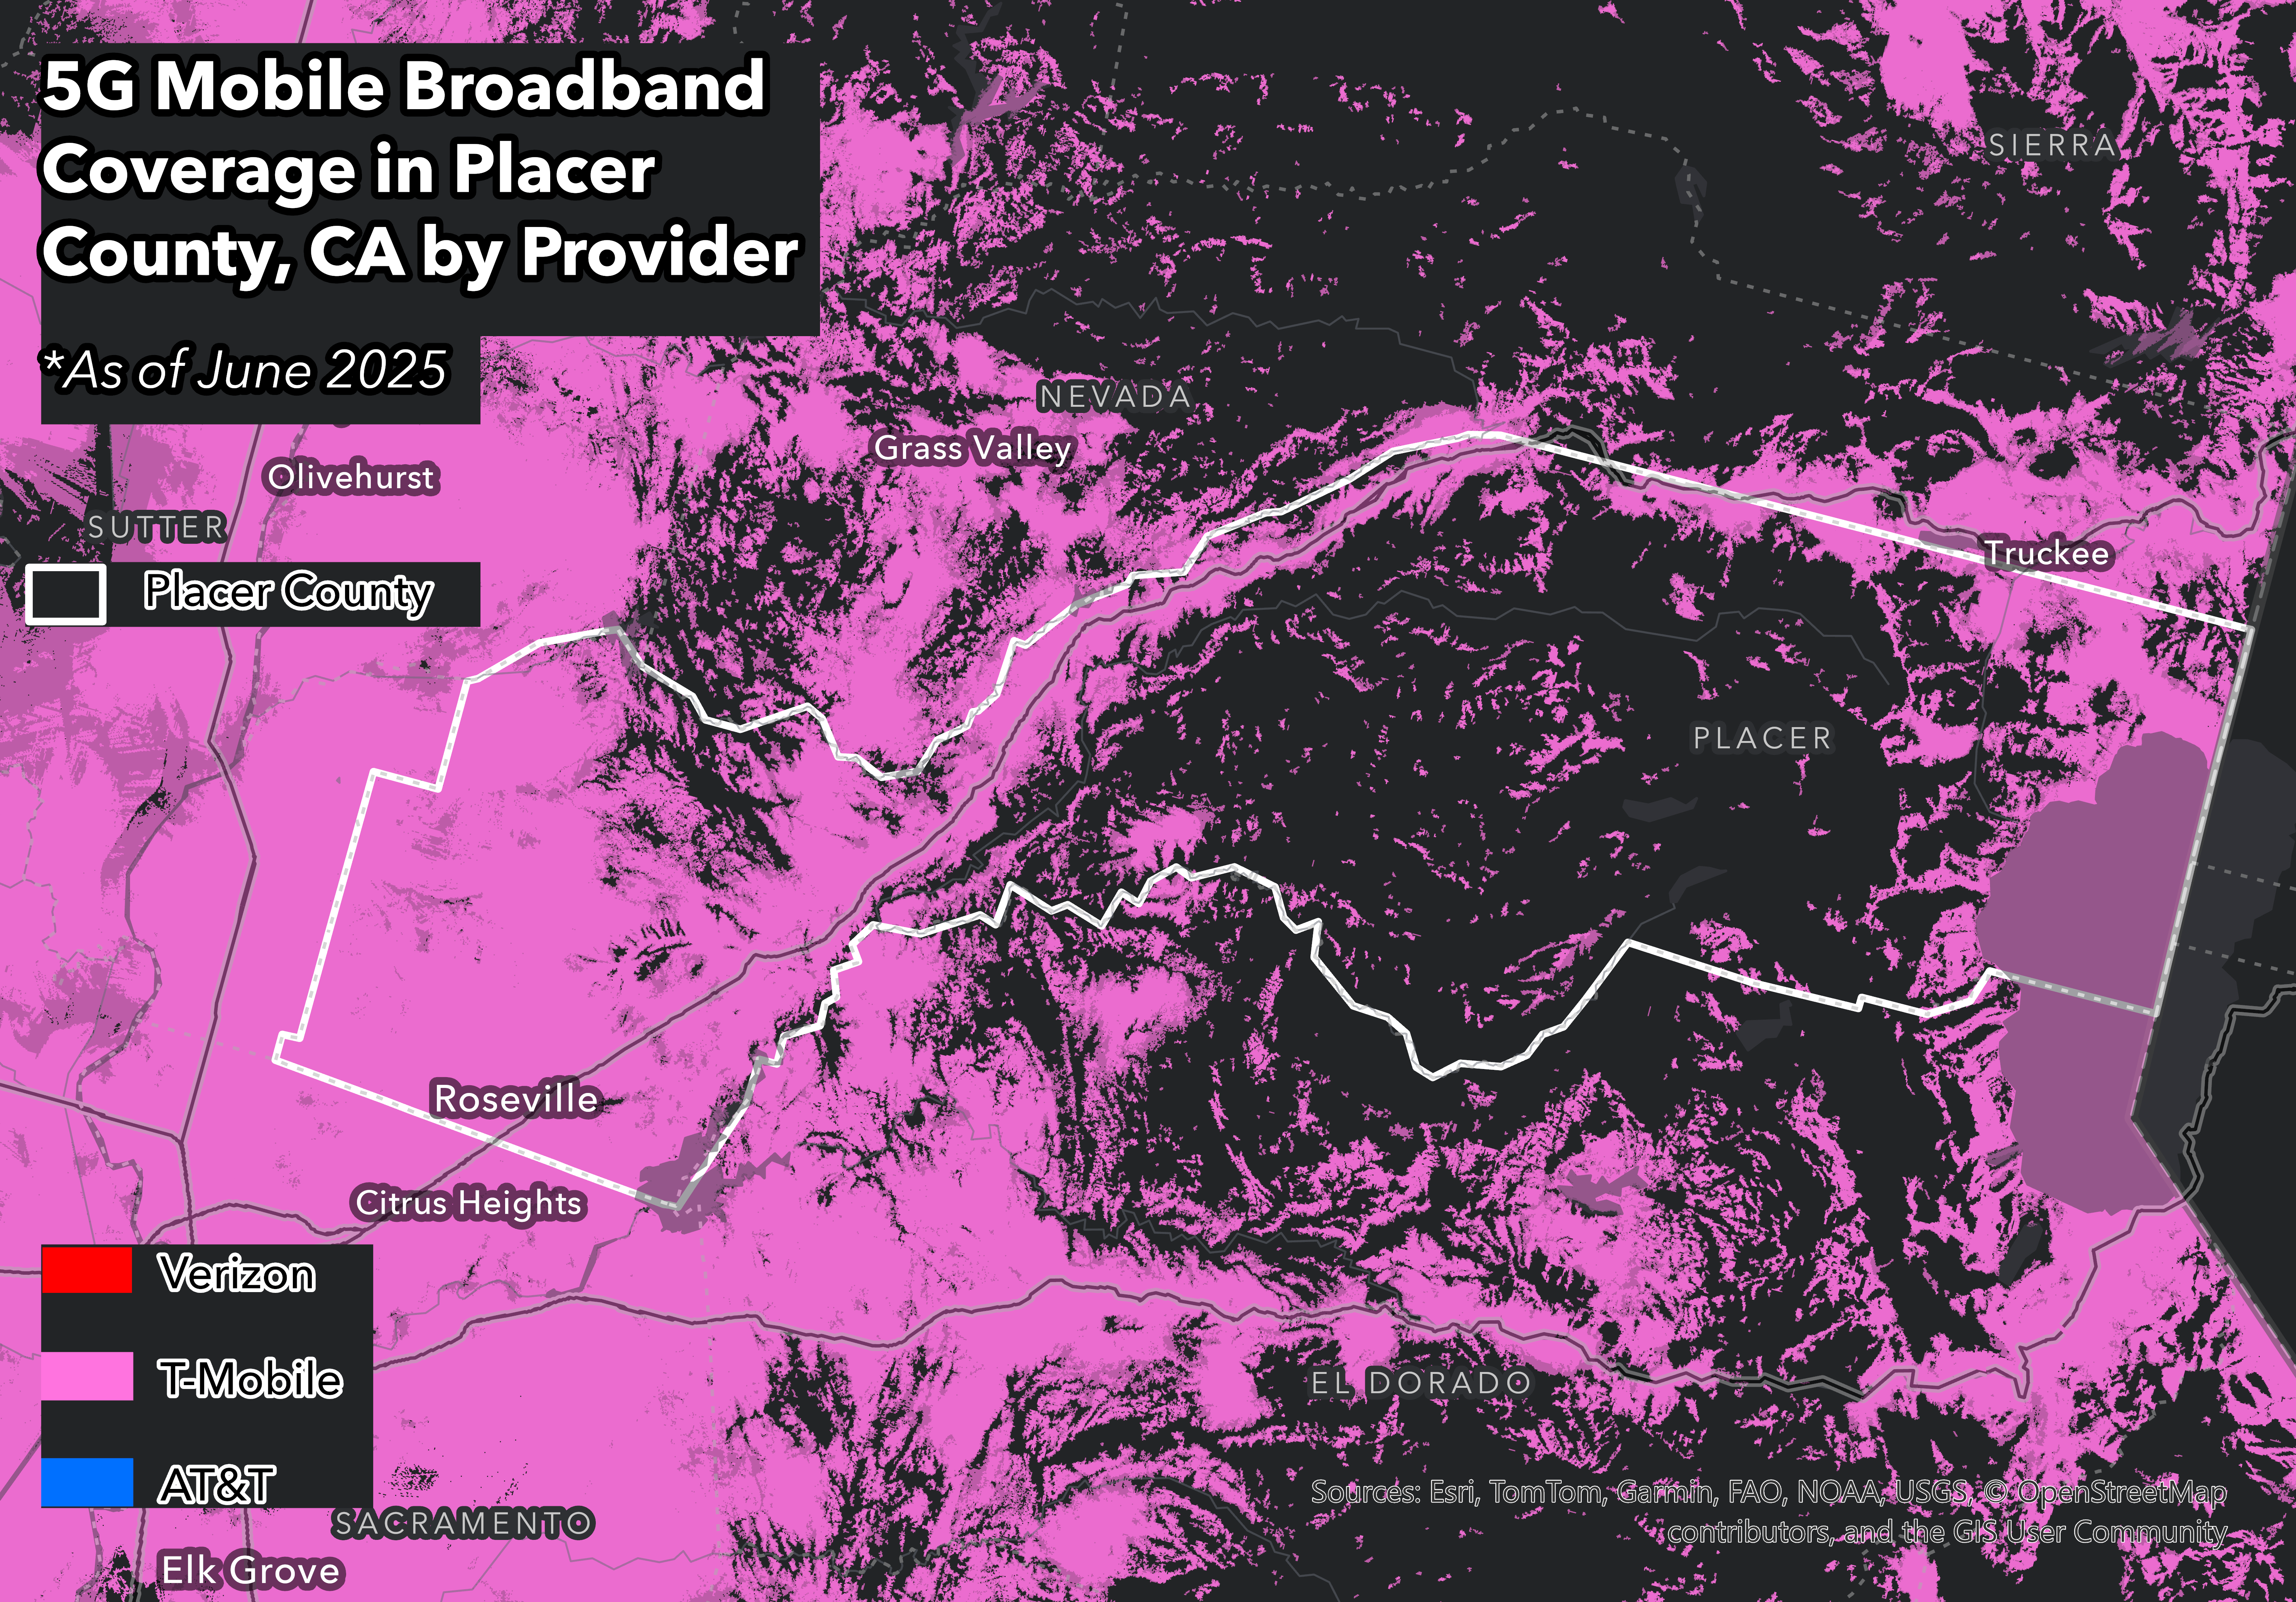
T-Mobile 5G (spd1) coverage — Placer County, CA
5G Coverage in Placer County
At the county level, Placer appears relatively well served. 5G coverage hovers at 57.9%. AT&T shows the most complete footprint, blanketing the western corridor from Roseville through Citrus Heights and extending well into the Sierra foothills. T-Mobile's coverage is comparably dense across the suburban core and reaches into the foothill communities. Verizon covers the same urban centers with strong saturation but tapers off quickly.
Moving east into the Sierra foothills away from Sacramento, coverage becomes more fragmented. It tapers in the Auburn-to-Colfax corridor and across many of the mountain communities.
Larimer County, CO (Fort Collins): Tech Corridor With Rural Edges
Larimer County is anchored by Fort Collins, Colorado's fourth-largest city and one of its most technology-dense. The county hosts major employer campuses including HP, Intel, and Broadcom, alongside Colorado State University. Its population has grown 4.3% between 2020 and 2024.
At a quick glance, Fort Collins itself is well-served. The city runs its own municipal fiber network, and Loveland and Estes Park have similar networks. The gap, however, isn't in the city center. It's in the communities surrounding it.
Larimer County extends into the Front Range foothills: Rist Canyon, Red Feather Lakes, the Poudre Canyon corridor, mountain communities above 7,000 feet that have absorbed significant in-migration from remote workers trading density for space.
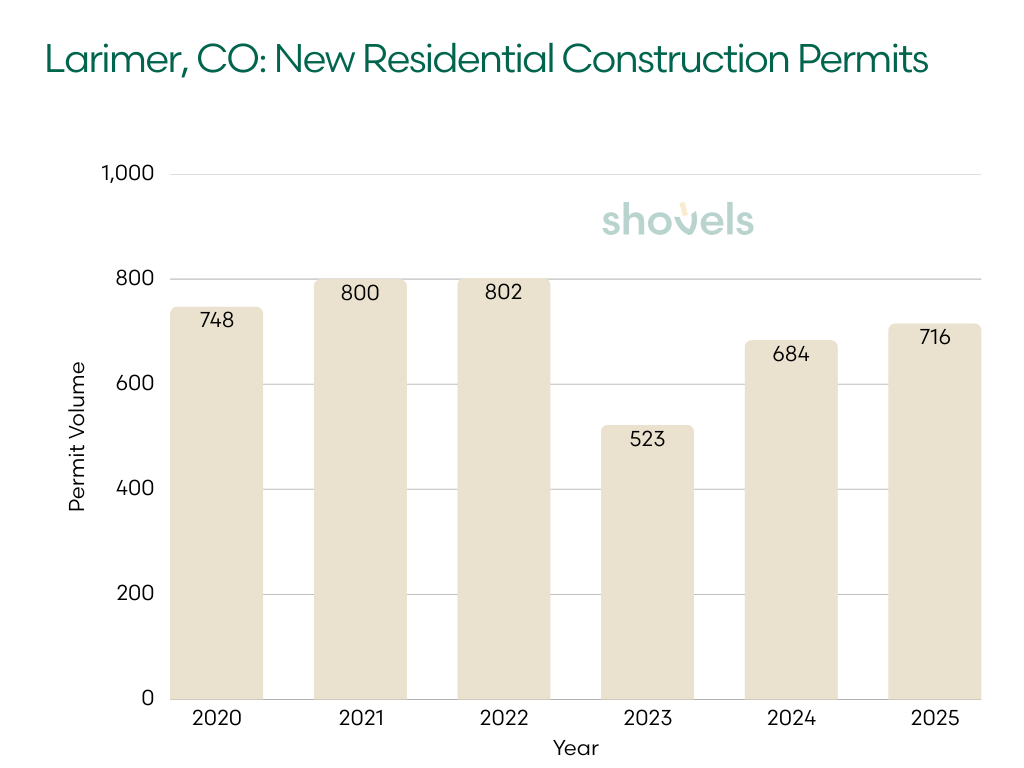
Larimer County’s permit activity closely mirrors the national housing cycle. Construction held steady at roughly 800 units per year through 2022, before the sharp interest-rate shock of 2023 pushed permits down 35% to 523 units.
| Year | Annual Permits | YoY |
|---|---|---|
| 2020 | 748 | — |
| 2021 | 800 | +7% |
| 2022 | 802 | flat |
| 2023 | 523 | −35% |
| 2024 | 684 | +31% |
| 2025 | 716 | +5% |
Since then, the market has recovered steadily. Permits rose 31% in 2024 and climbed again in 2025 to 716 units, bringing construction back near pre-rate-hike levels. The data points to a market that absorbed the national rate shock but where demand reestablished the construction floor.
5G Coverage in Larimer County
Larimer County displays one of the clearest urban–rural coverage divides we looked at. Overall 5G coverage is around 48.5%. The Fort Collins–Loveland corridor in the southeastern portion of the county is heavily covered by all three major carriers.
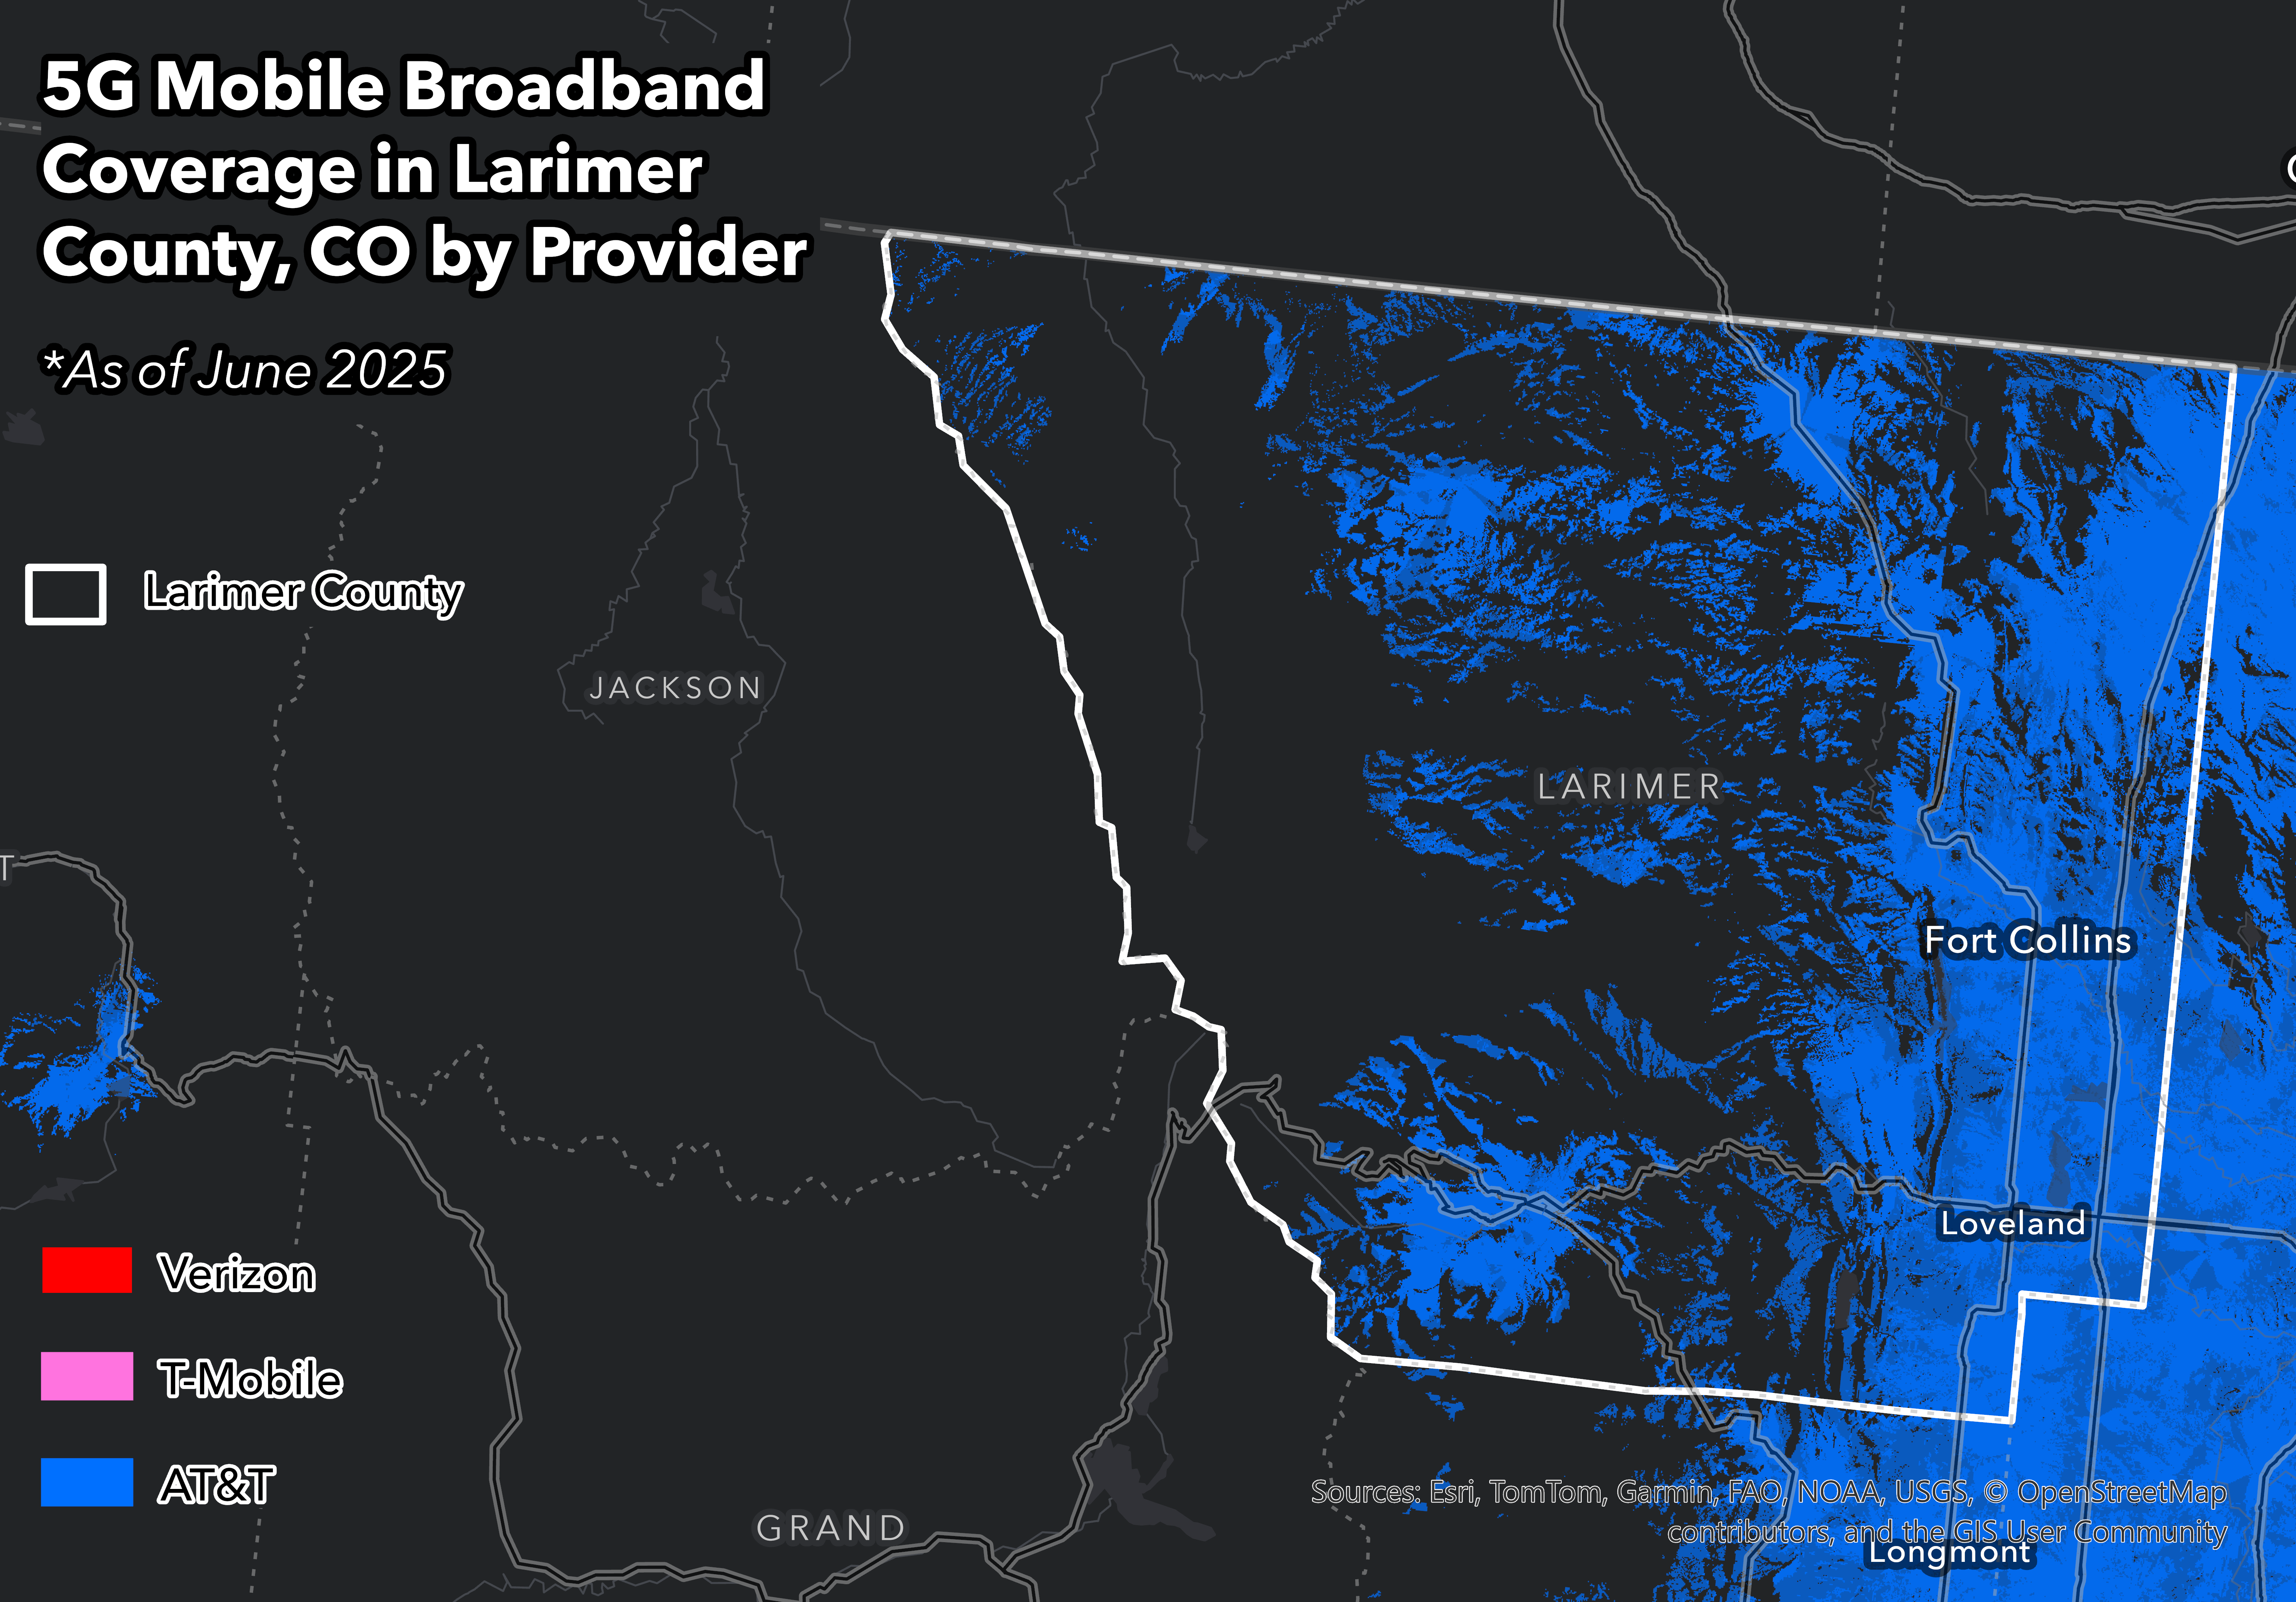
AT&T 5G (spd1) coverage — Larimer County, CO
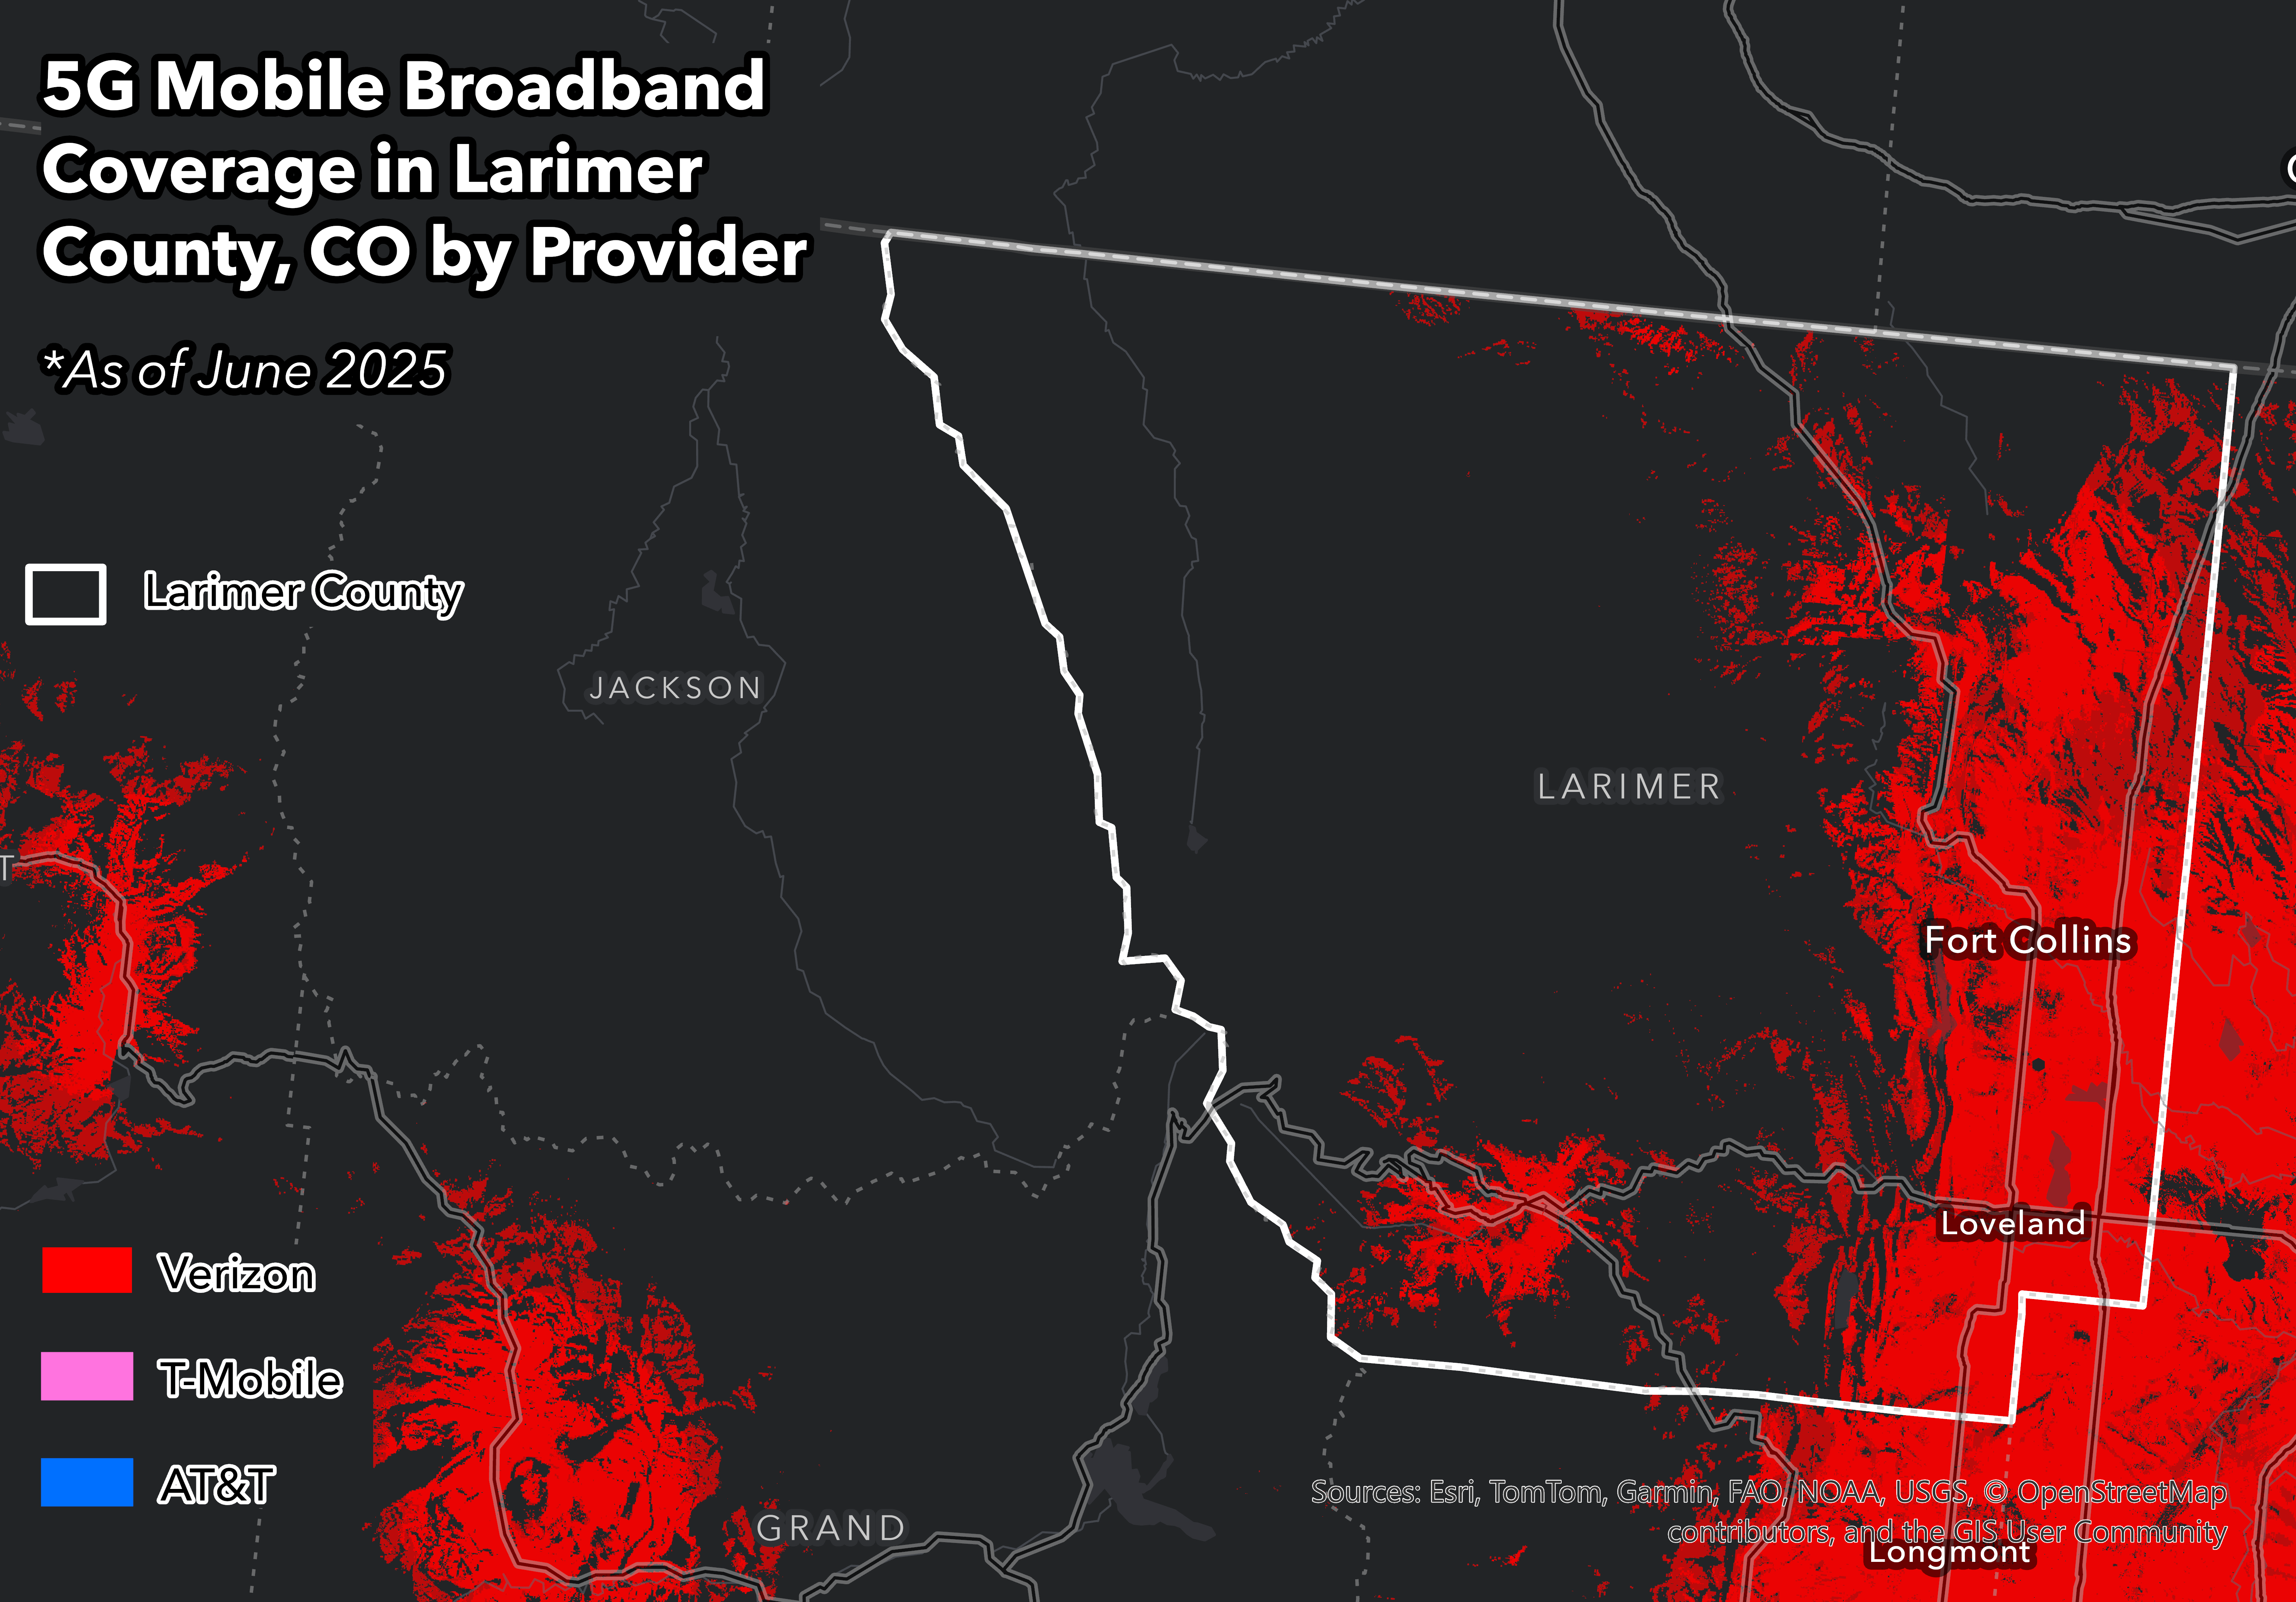
Verizon 5G (spd1) coverage — Larimer County, CO
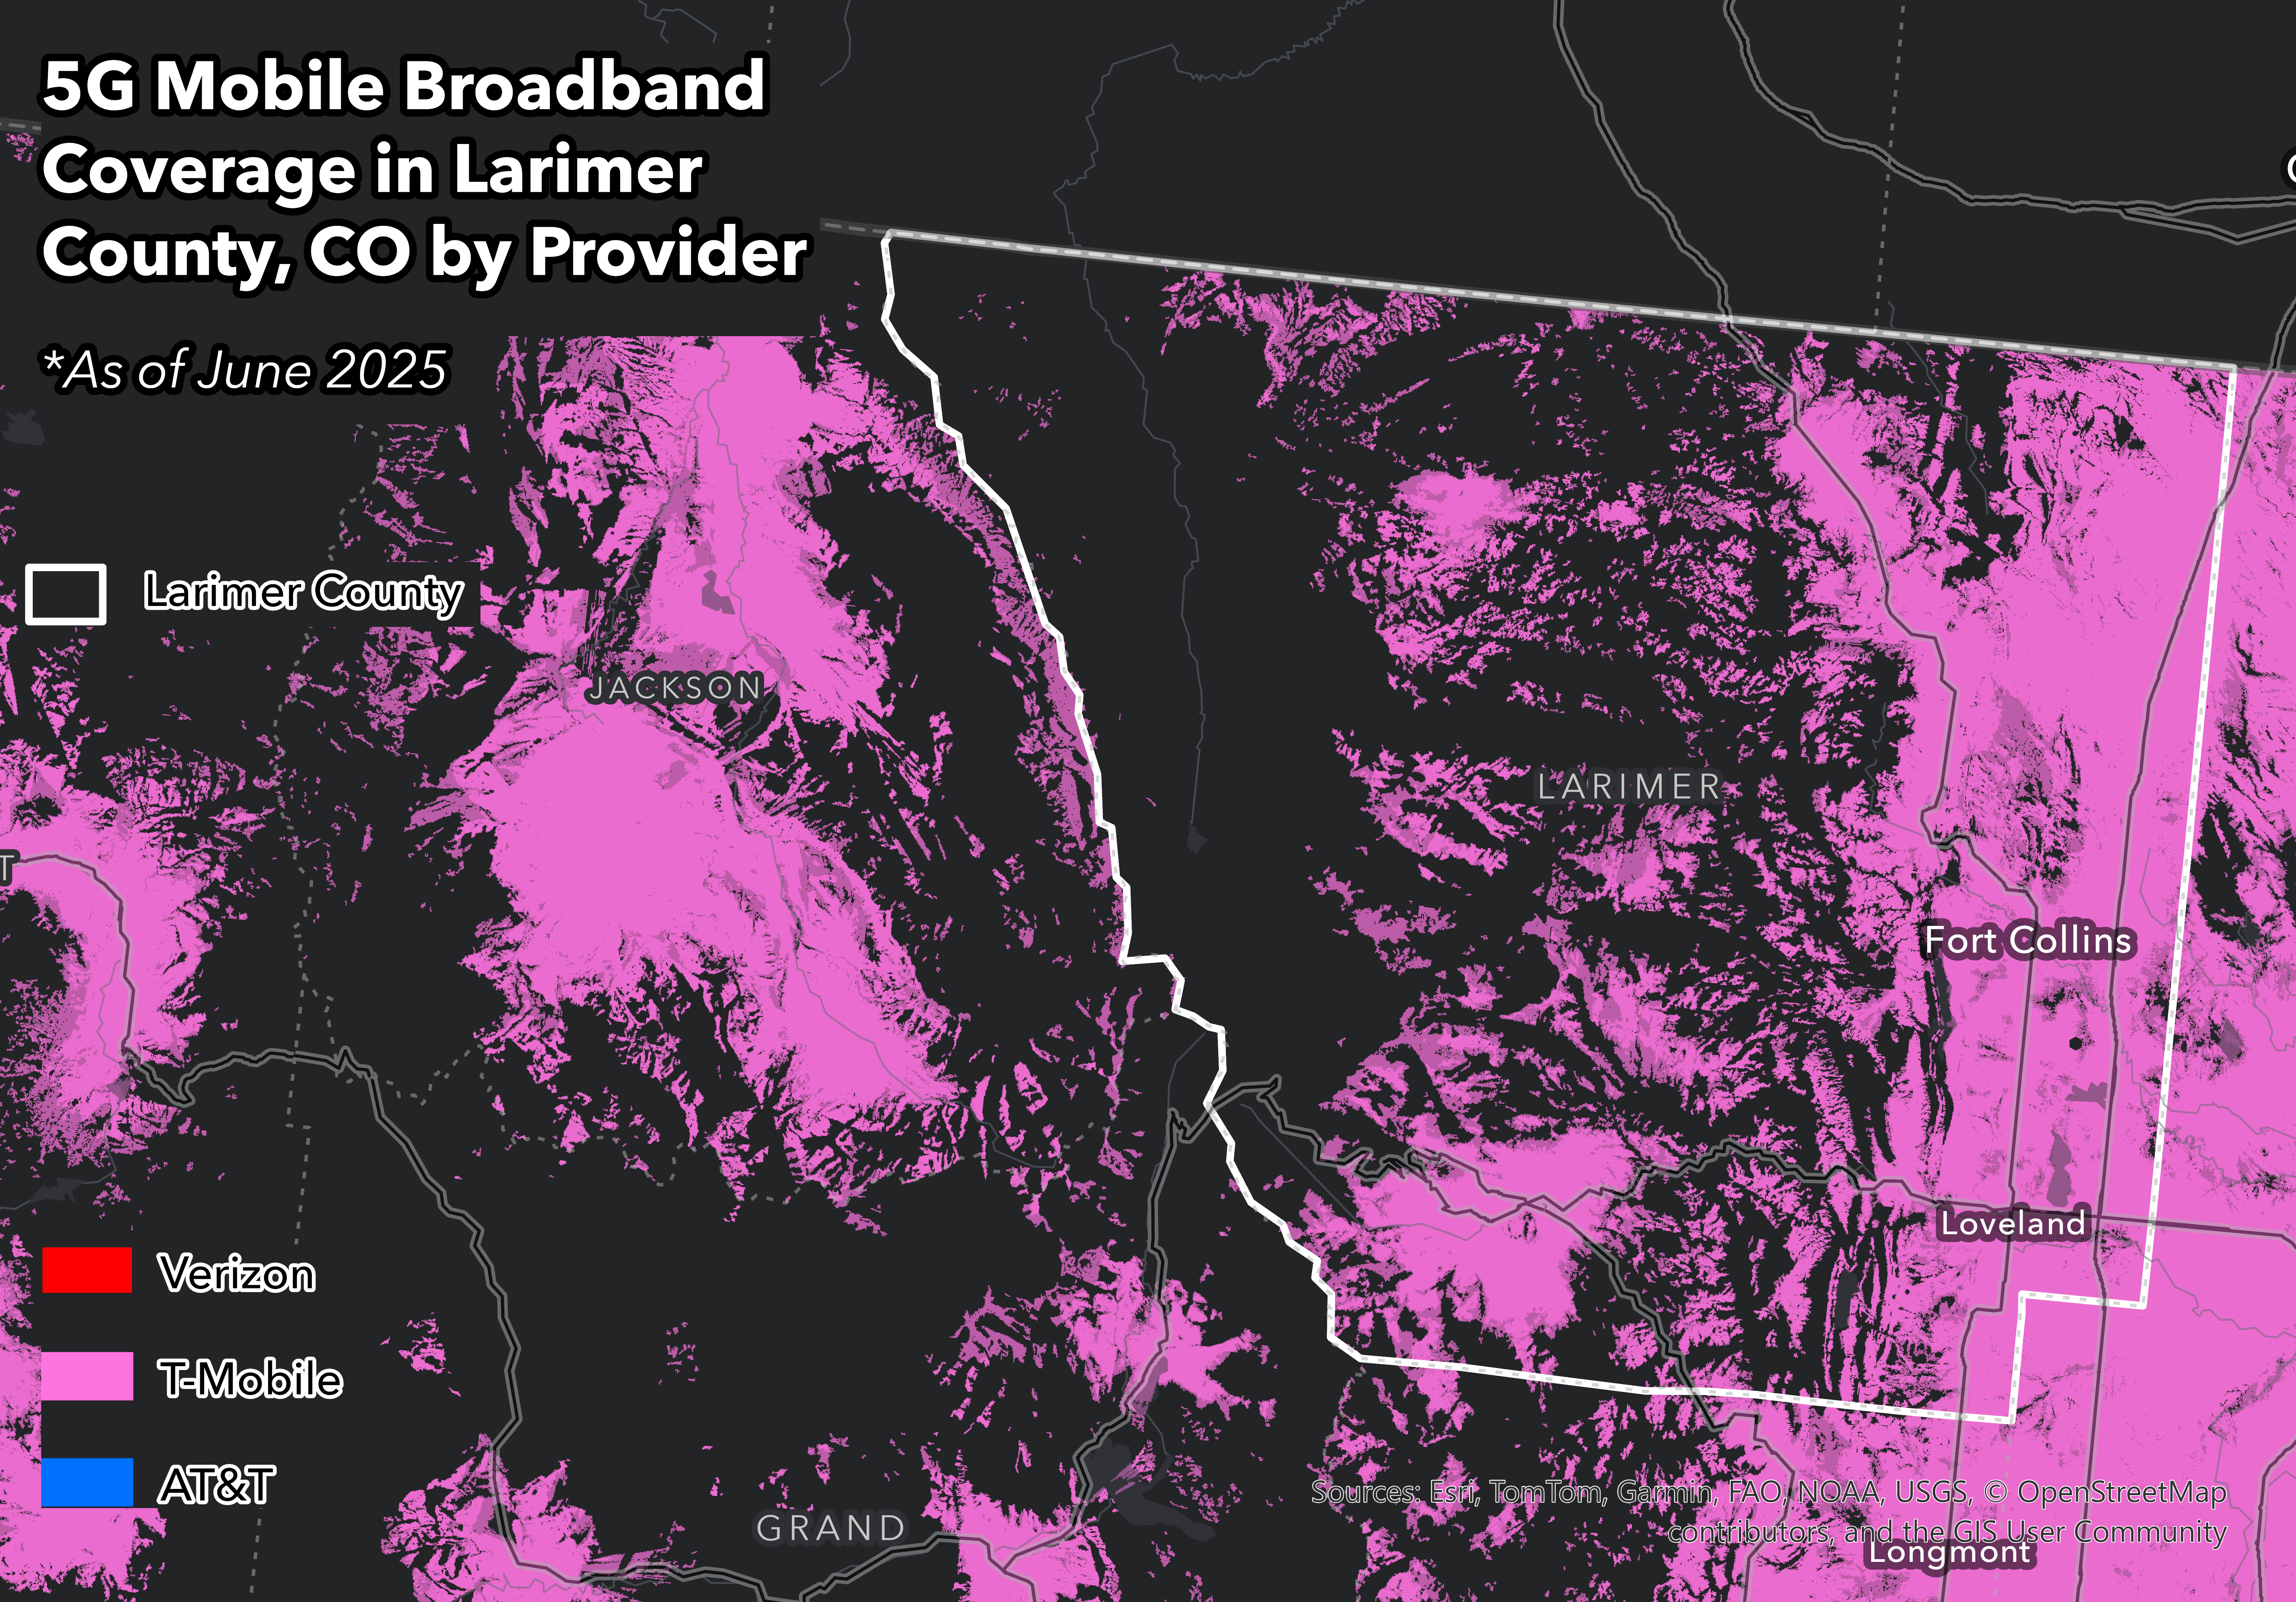
T-Mobile 5G (spd1) coverage — Larimer County, CO
T-Mobile shows the broadest coverage in Larimer County by a clear margin, extending well into the foothills west of Fort Collins and reaching terrain that the other two carriers don't touch. AT&T concentrates its footprint along the I-25 corridor. Verizon follows a similar pattern, dense in the southeastern urban areas but pulling back sharply as the terrain rises toward Rocky Mountain National Park.
Moving west into the Rocky Mountain foothills, coverage drops off rapidly. Areas such as Rist Canyon, Poudre Canyon, and Red Feather Lakes show little reported 5G availability. The pattern is clear. Coverage is concentrated where the historic population base sits along the Front Range.
Pima County, AZ (Tucson): Large Metro With Growth on the Edge
Pima County is essentially the Tucson metropolitan area, Arizona’s second-largest metro. While Tucson itself is the region’s economic and population center, we saw a pre-pandemic construction boom outside Tucson proper.
Three major anchors create steady housing demand. Davis–Monthan Air Force Base supports a large active-duty and civilian workforce. The University of Arizona, with more than 55,000 students, drives persistent rental demand. Raytheon Missiles & Defense also draws a major aerospace and defense workforce in the region.
Population growth across the county has been gradual rather than explosive, increasing about 3.5% between 2020 and 2024. What’s interesting, however, is that Tucson has over 400,000 residents living in unincorporated Pima, mostly urban areas of the county that are not within any city or town.
To analyze new construction beyond metro areas, we examined permit activity in the urban and suburban swathes outside Tucson. This includes: unincorporated Pima County, Oro Valley, and Sahuarita, areas that represent the metro’s primary outward growth.
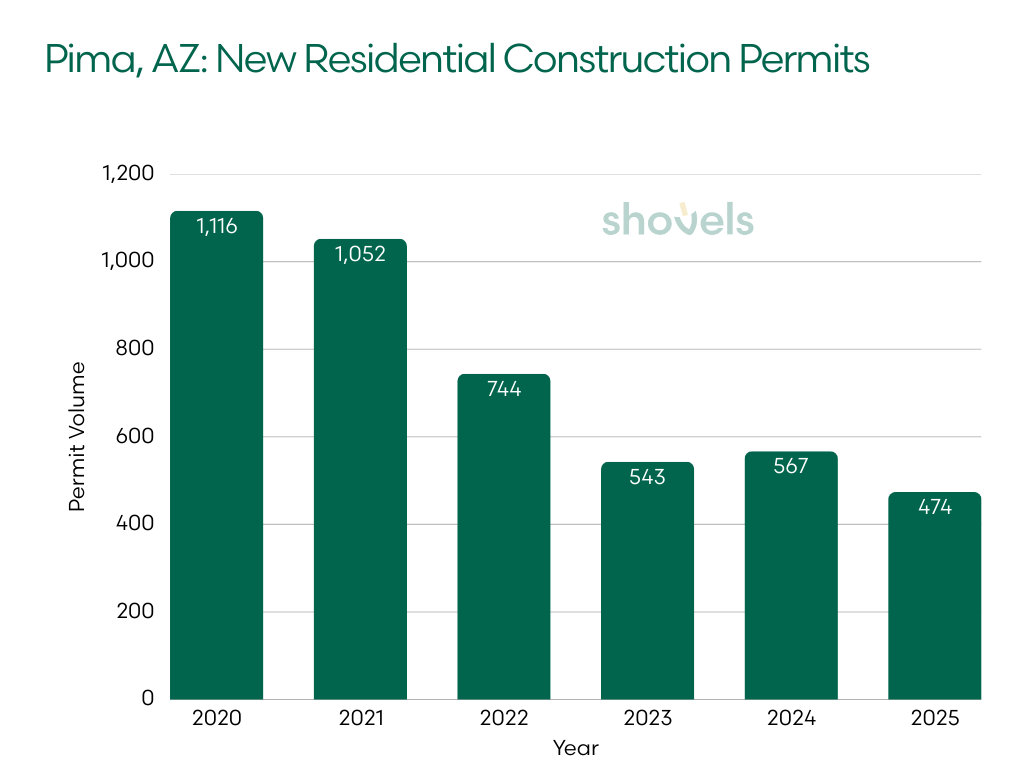
| Year | Annual Permits (Ex. Tucson) | YoY |
|---|---|---|
| 2020 | 1,116 | — |
| 2021 | 1,052 | −6% |
| 2022 | 744 | −29% |
| 2023 | 543 | −27% |
| 2024 | 567 | +4% |
| 2025 | 474 | −16% |
The permit trend reflects the broader national housing cycle. Construction slowed sharply after the pandemic housing boom as higher mortgage rates reduced new development. Activity stabilized slightly in 2024 but remains below early-decade levels.
Even with the slowdown, these urban and suburban jurisdictions represent a marked expansion of the metro’s outward housing edge. They are places with lower land costs but that are less served by existing infrastructure.
5G Coverage in Pima County
Overall, 5G coverage is around 33.7% across the county and concentrated around the Tucson metropolitan area, where all three major carriers maintain dense urban coverage.
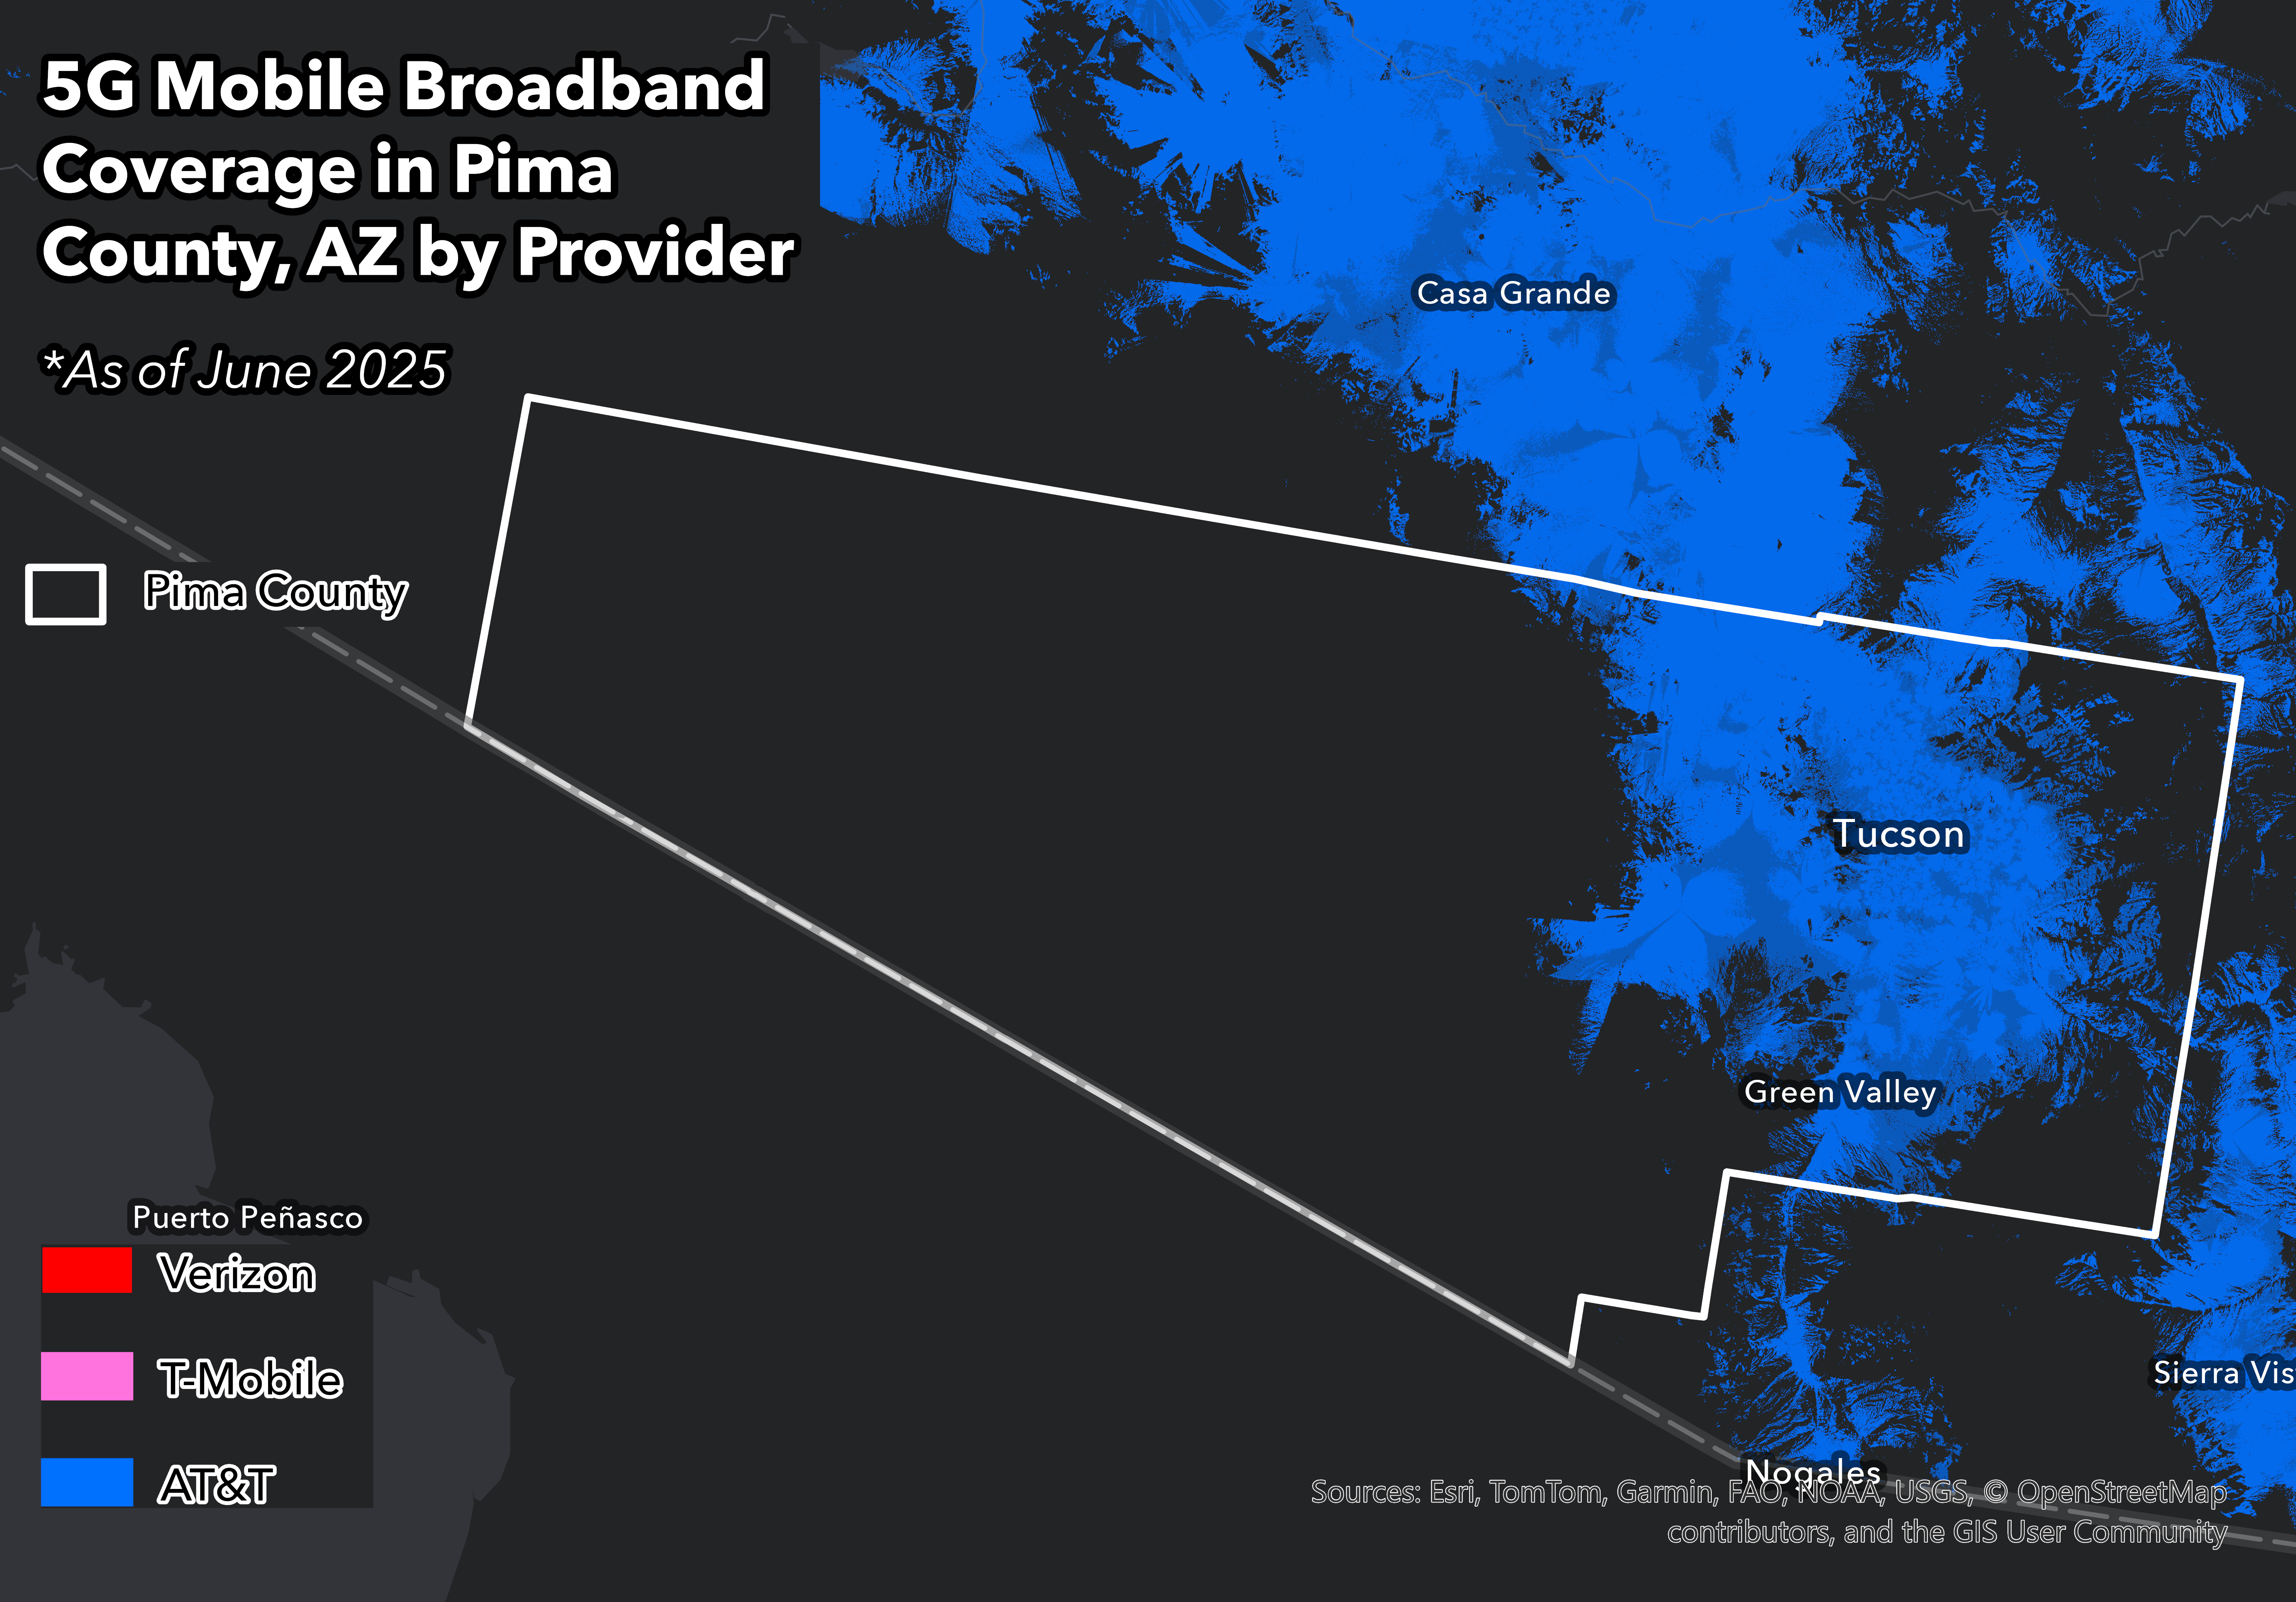
AT&T 5G (spd1) coverage — Pima County, AZ
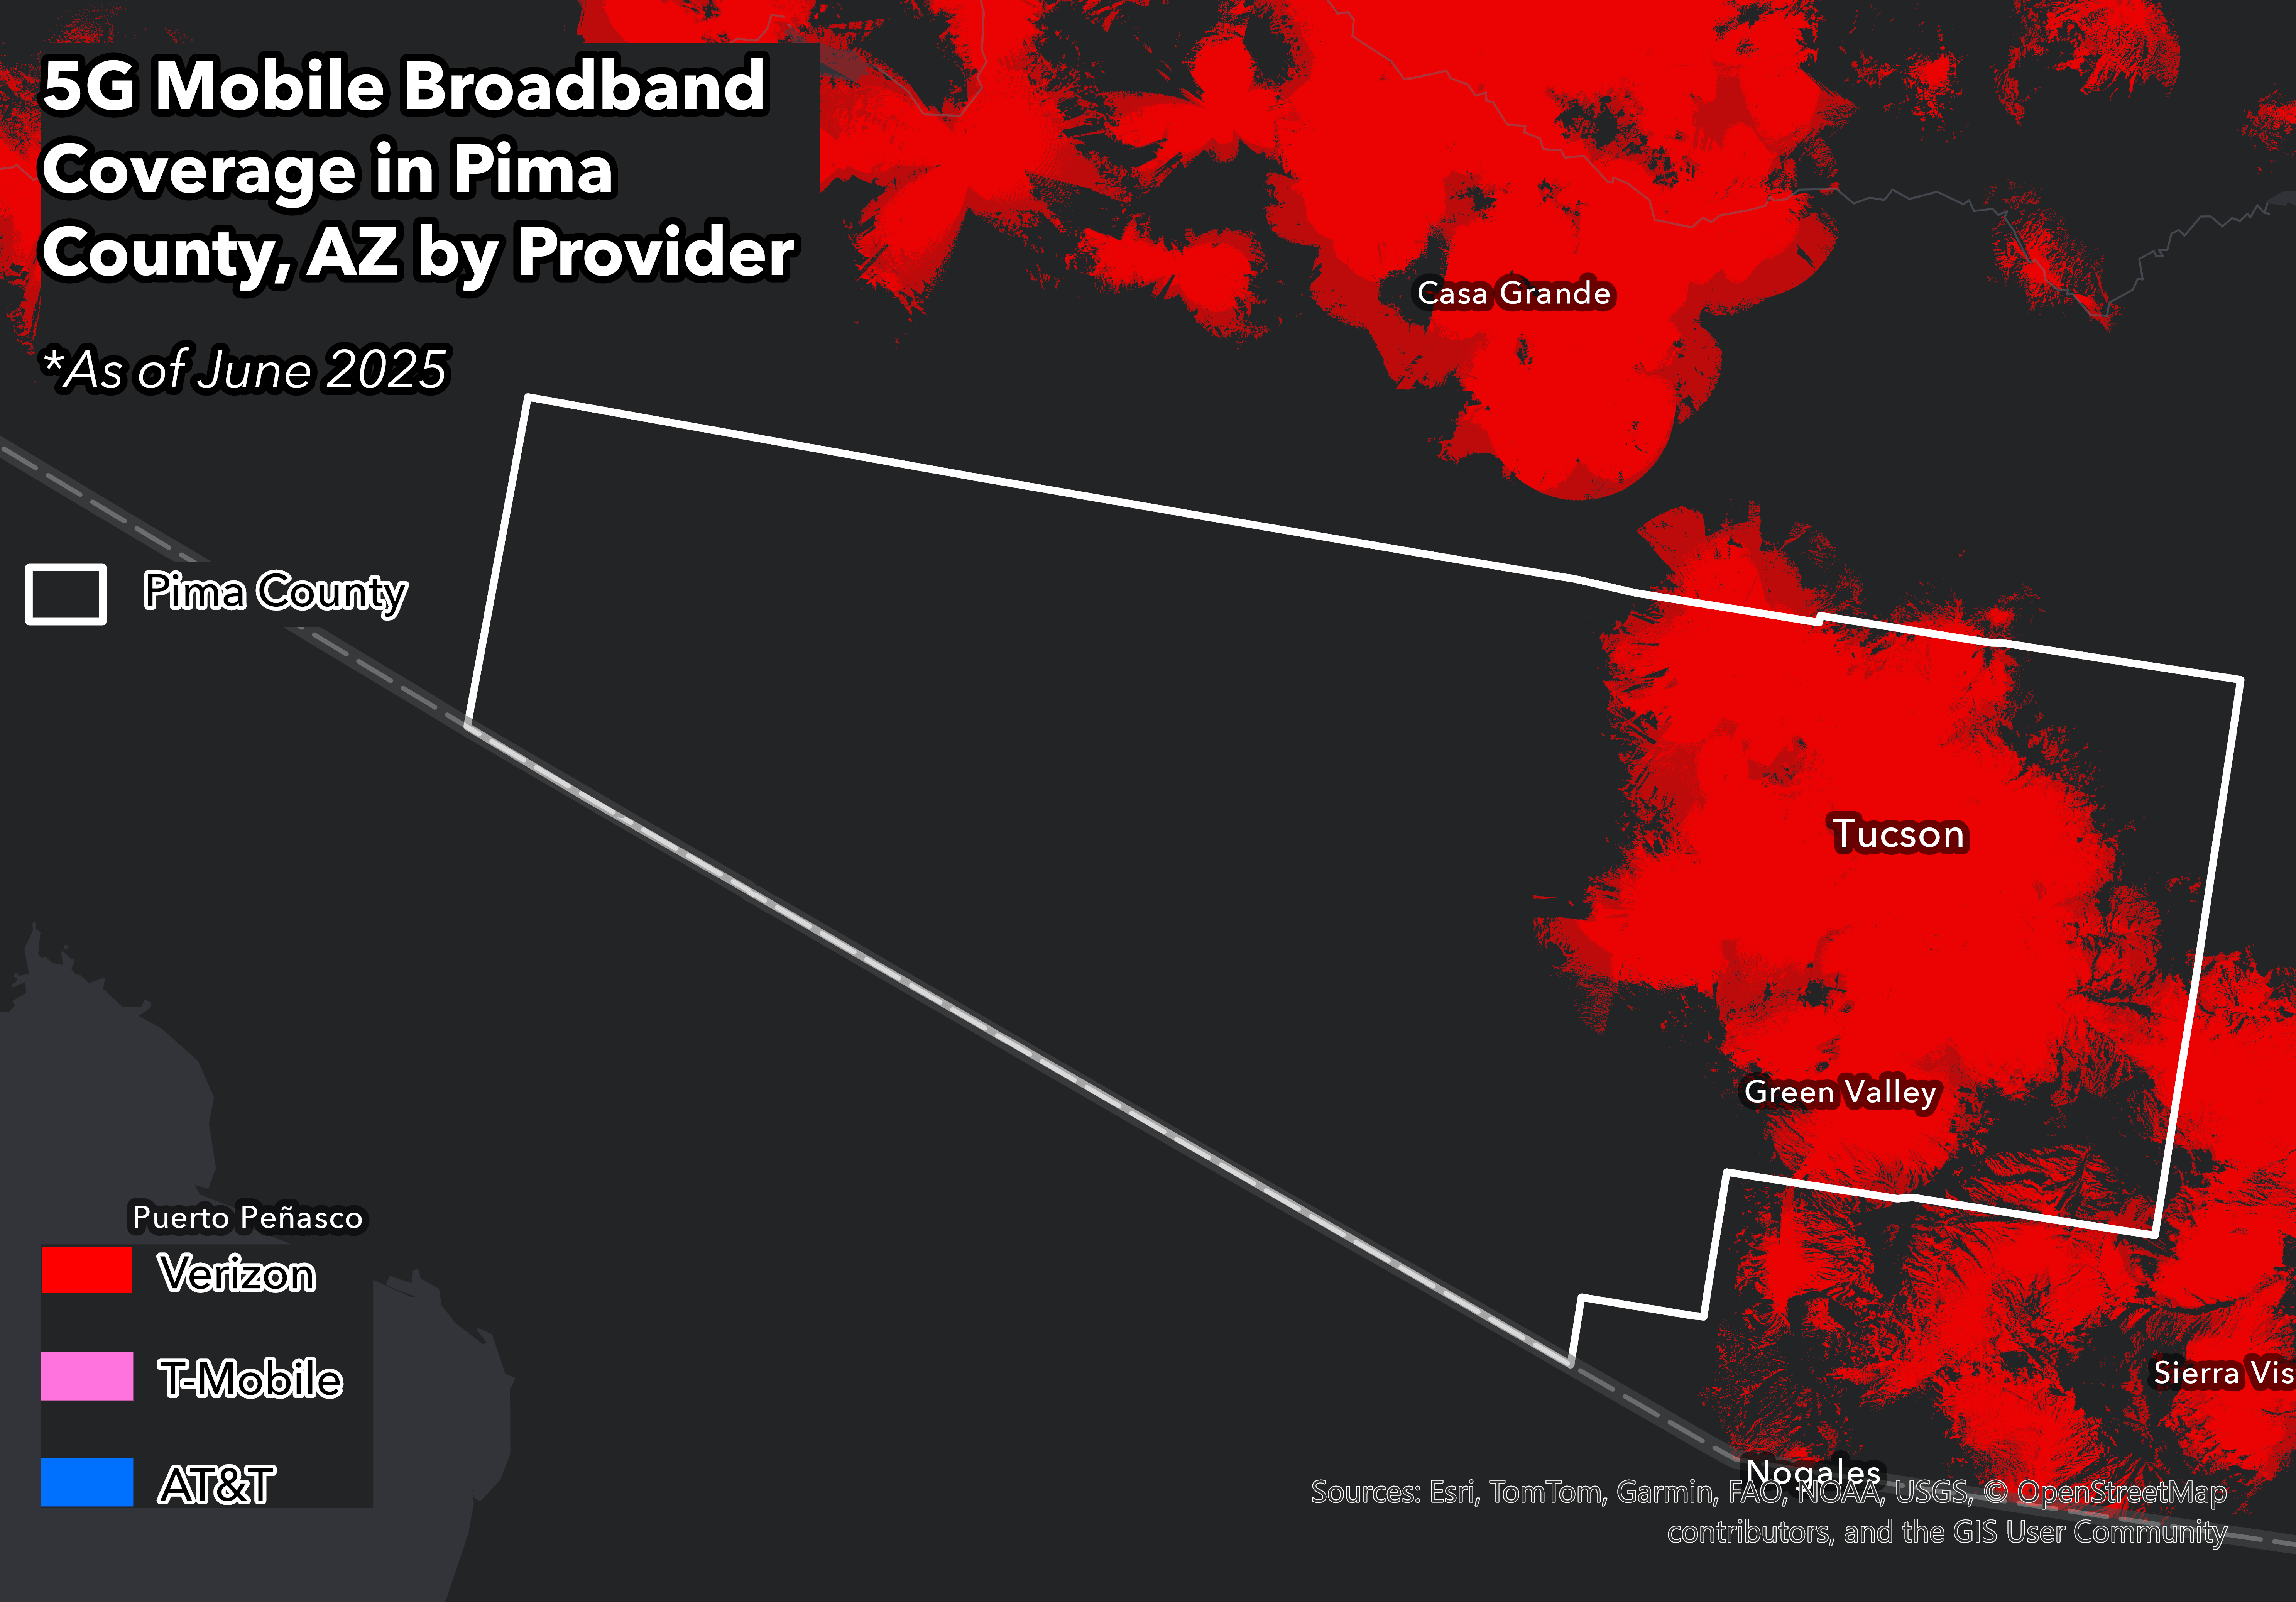
Verizon 5G (spd1) coverage — Pima County, AZ
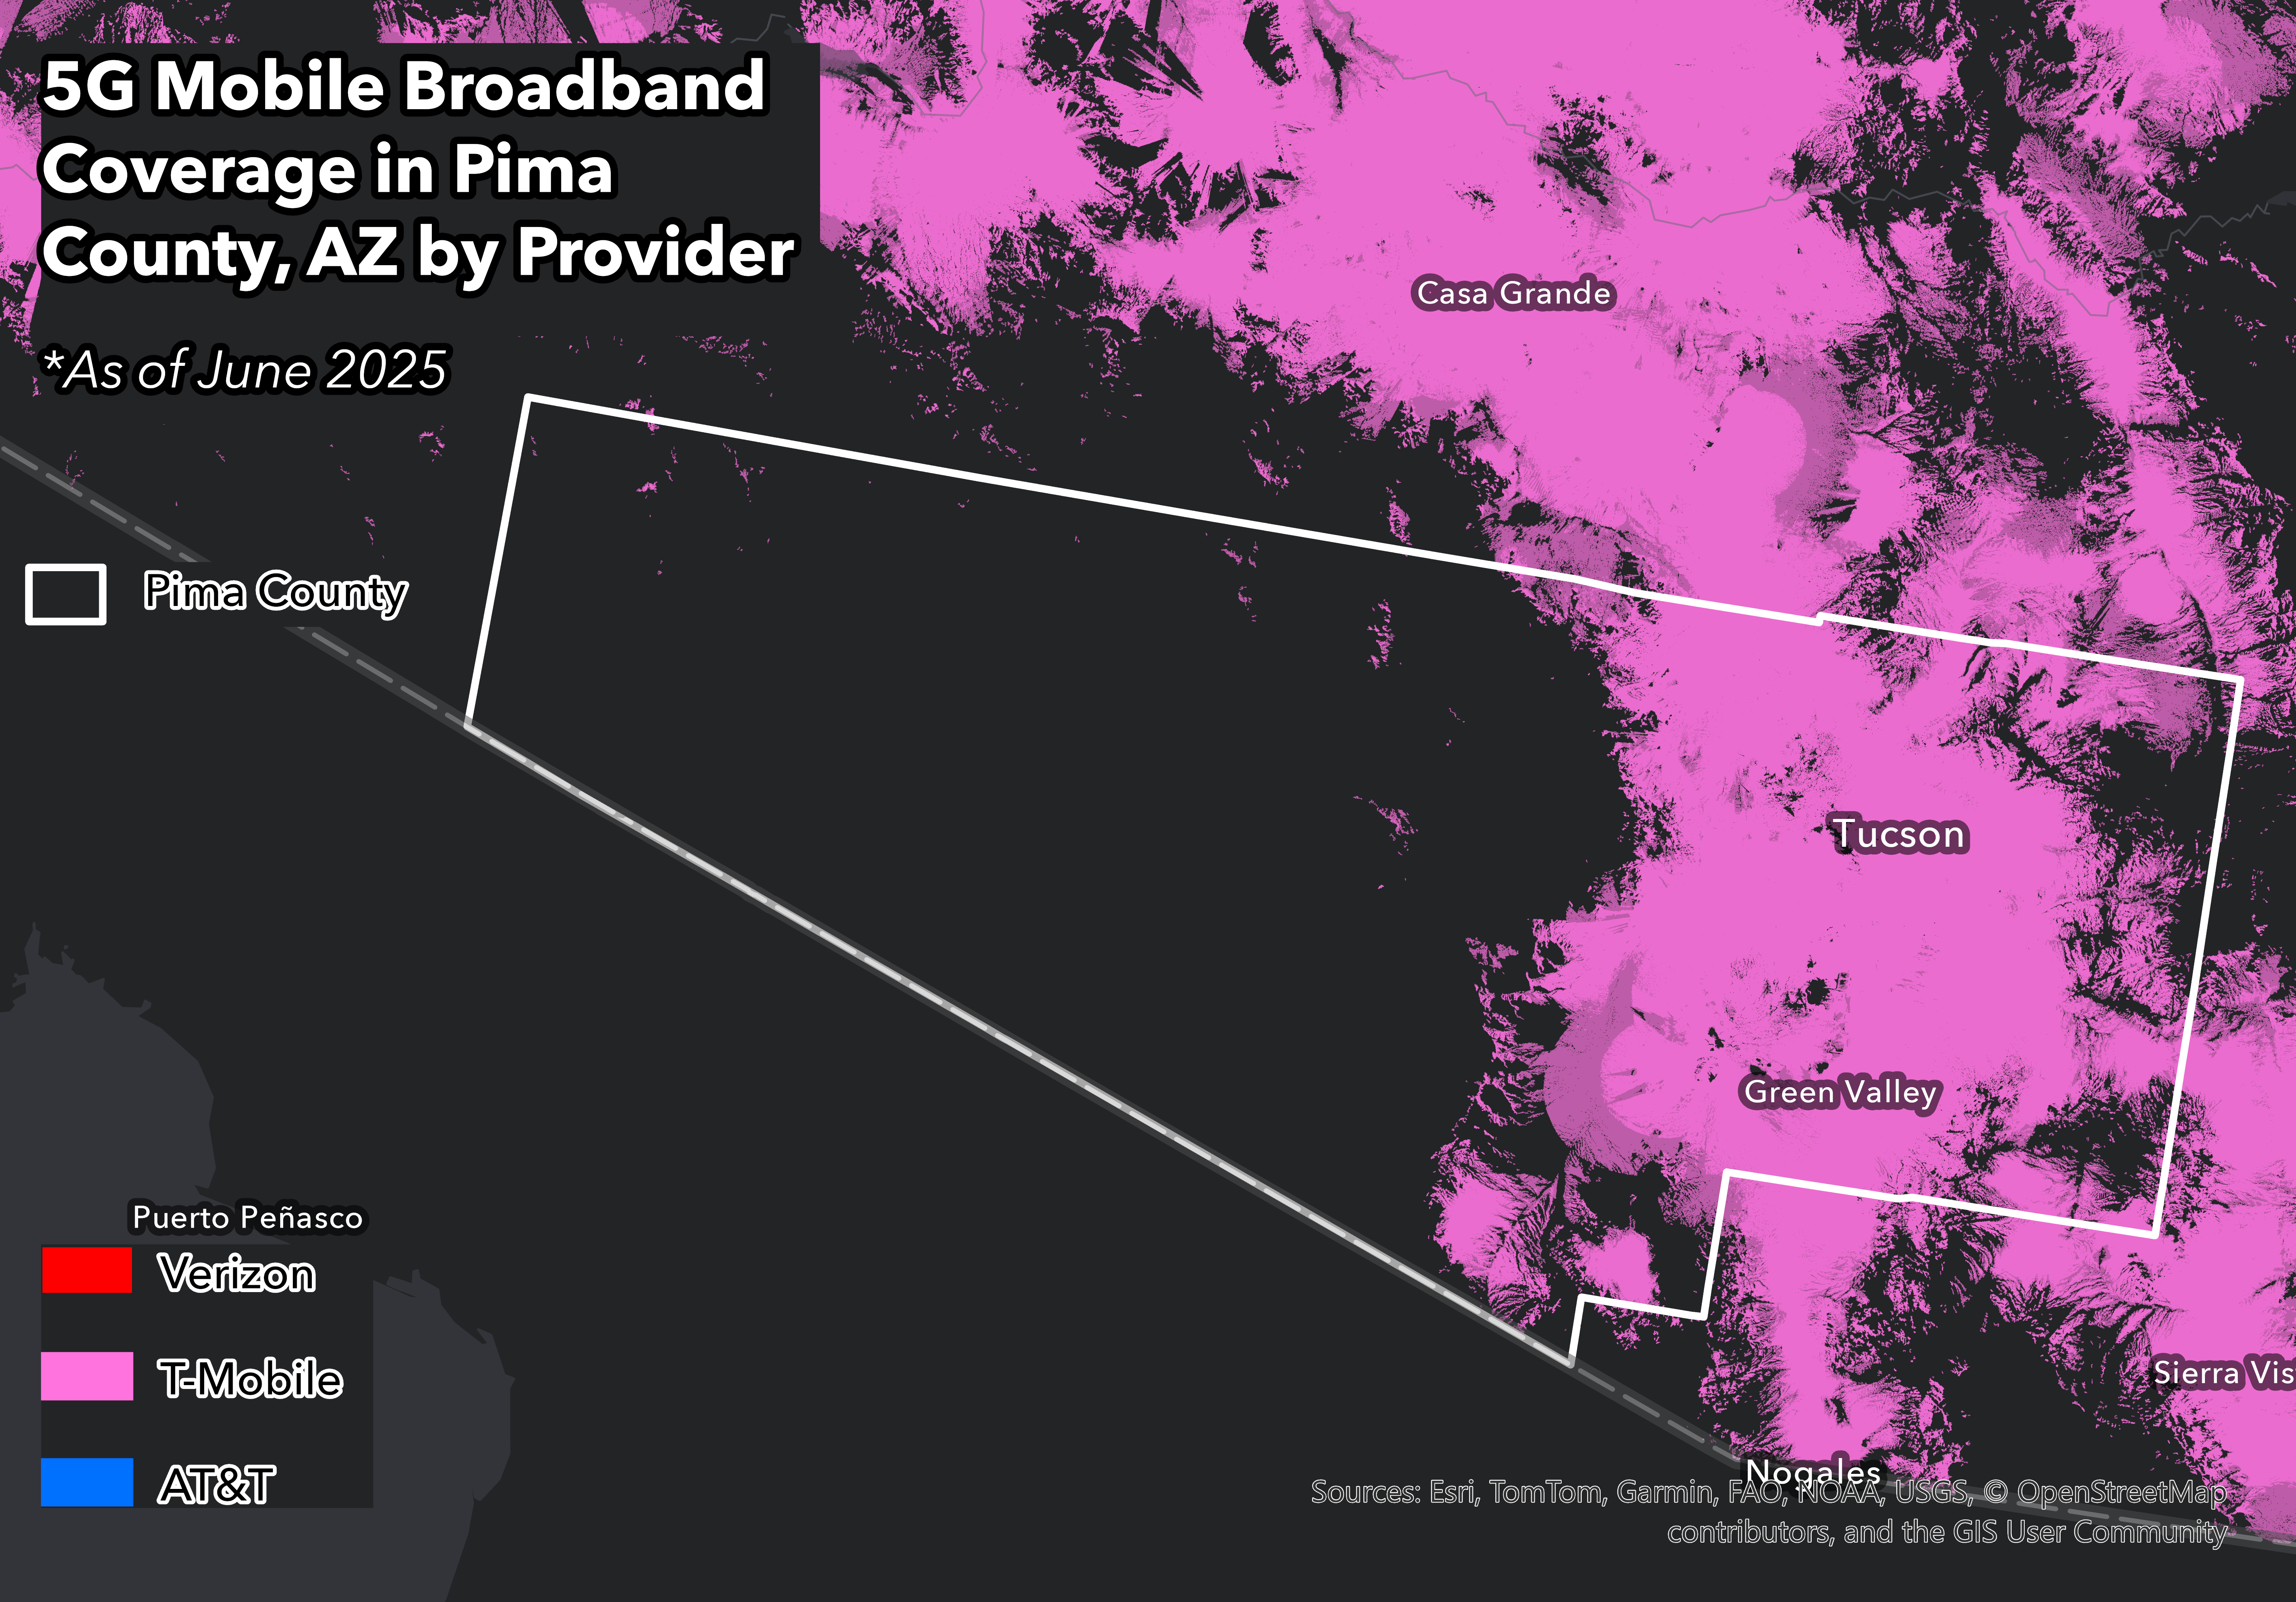
T-Mobile 5G (spd1) coverage — Pima County, AZ
Once again, T-Mobile shows the widest geographic reach, with coverage extending noticeably further from the Tucson core into the surrounding desert. AT&T and Verizon are closely matched within the Tucson urban area, but Verizon's footprint provides better coverage for Oro Valley and Sahuarita.
All three carriers drop off sharply beyond the metro. Pima County stretches far west and southwest toward the Tohono O’odham Nation and the U.S.–Mexico border, and much of that landscape shows little reported 5G availability in FCC data.
The Infrastructure Challenge: Keeping Up With Sprawl
Across all five counties, we see similar patterns. Wireless coverage is strongest in established population centers, city cores, suburban corridors, and major highways where carriers historically concentrated infrastructure. Migration from the pandemic-era housing boom, however, extends beyond those zones:
-
In Bedford County, VA, remote workers and commuters need broader coverage beyond major metros.
-
In Yuma County, AZ the agricultural landscape reaches far beyond urban hotspots.
-
In Placer County, CA and Larimer County, CO, pandemic migration moved households into foothill communities where infrastructure is thinner.
-
In Pima County, AZ dense wireless coverage around Tucson contrasts with vast rural landscapes across the county’s western half.
5G is expanding, but telecommunications infrastructure typically follows population density, not migration patterns. Residential building permits provide a forward-looking signal of where Americans are moving, and where infrastructure demand is emerging.
As housing continues to spread beyond established urban corridors, the gap between where people already live and where new households are moving (and have moved) is becoming visible, offering a preview of where the next layer of connectivity investment may be needed.
Working on network planning or site selection? Let us know how we can help. Or, if you’re ready to dive straight into the data, you can create an account here.