
Growth in EV charger contractors
This the final article of our recent series on EV charger activity in California. You can also read about the growth of EV chargers and EV charger permit approval timelines.
We have seen the EV charger space flourish, with companies operating in many different parts of the ecosystem. Check out a few examples::
EV charger hardware companies:
EV charger software companies:
EV charger services companies:
And charge point operators:
There are also sales and design tools like Monterra, purpose-built to help installers (electrical contractors and EV charging project developers) design, quote, and propose projects faster - streamlining and automating an otherwise manual site design and sales process. It’s a busy space! That’s why we’re spending so much time looking into it.
We already showed that there’s been a boon in EV charger installs. With all of this activity, it seems that there should be an increase in contractor activity, too. That’s what we set out to prove, and the data says it loud and clear: the number of contractors doing EV charger installations is increasing throughout California.
To put things into context, nearly 30% of all EV chargers in the US are installed in California today, followed by NY, FL, TX, MA, and WA (making up 25% collectively).
(Stay tuned, as we’ll soon dive into the data for FL and TX market in a future post!)
Here are the jurisdictions with the most active EV charger contractors since 2022:
- Sacramento County: 429 contractors
- Berkeley: 209 contractors
- Encinitas: 203 contractors
- Oakland: 140 contractors
- Anaheim: 119 contractors
We took the top two jurisdictions and looked to see if the number of active EV charger contractors has been increasing over time. Indeed it has!
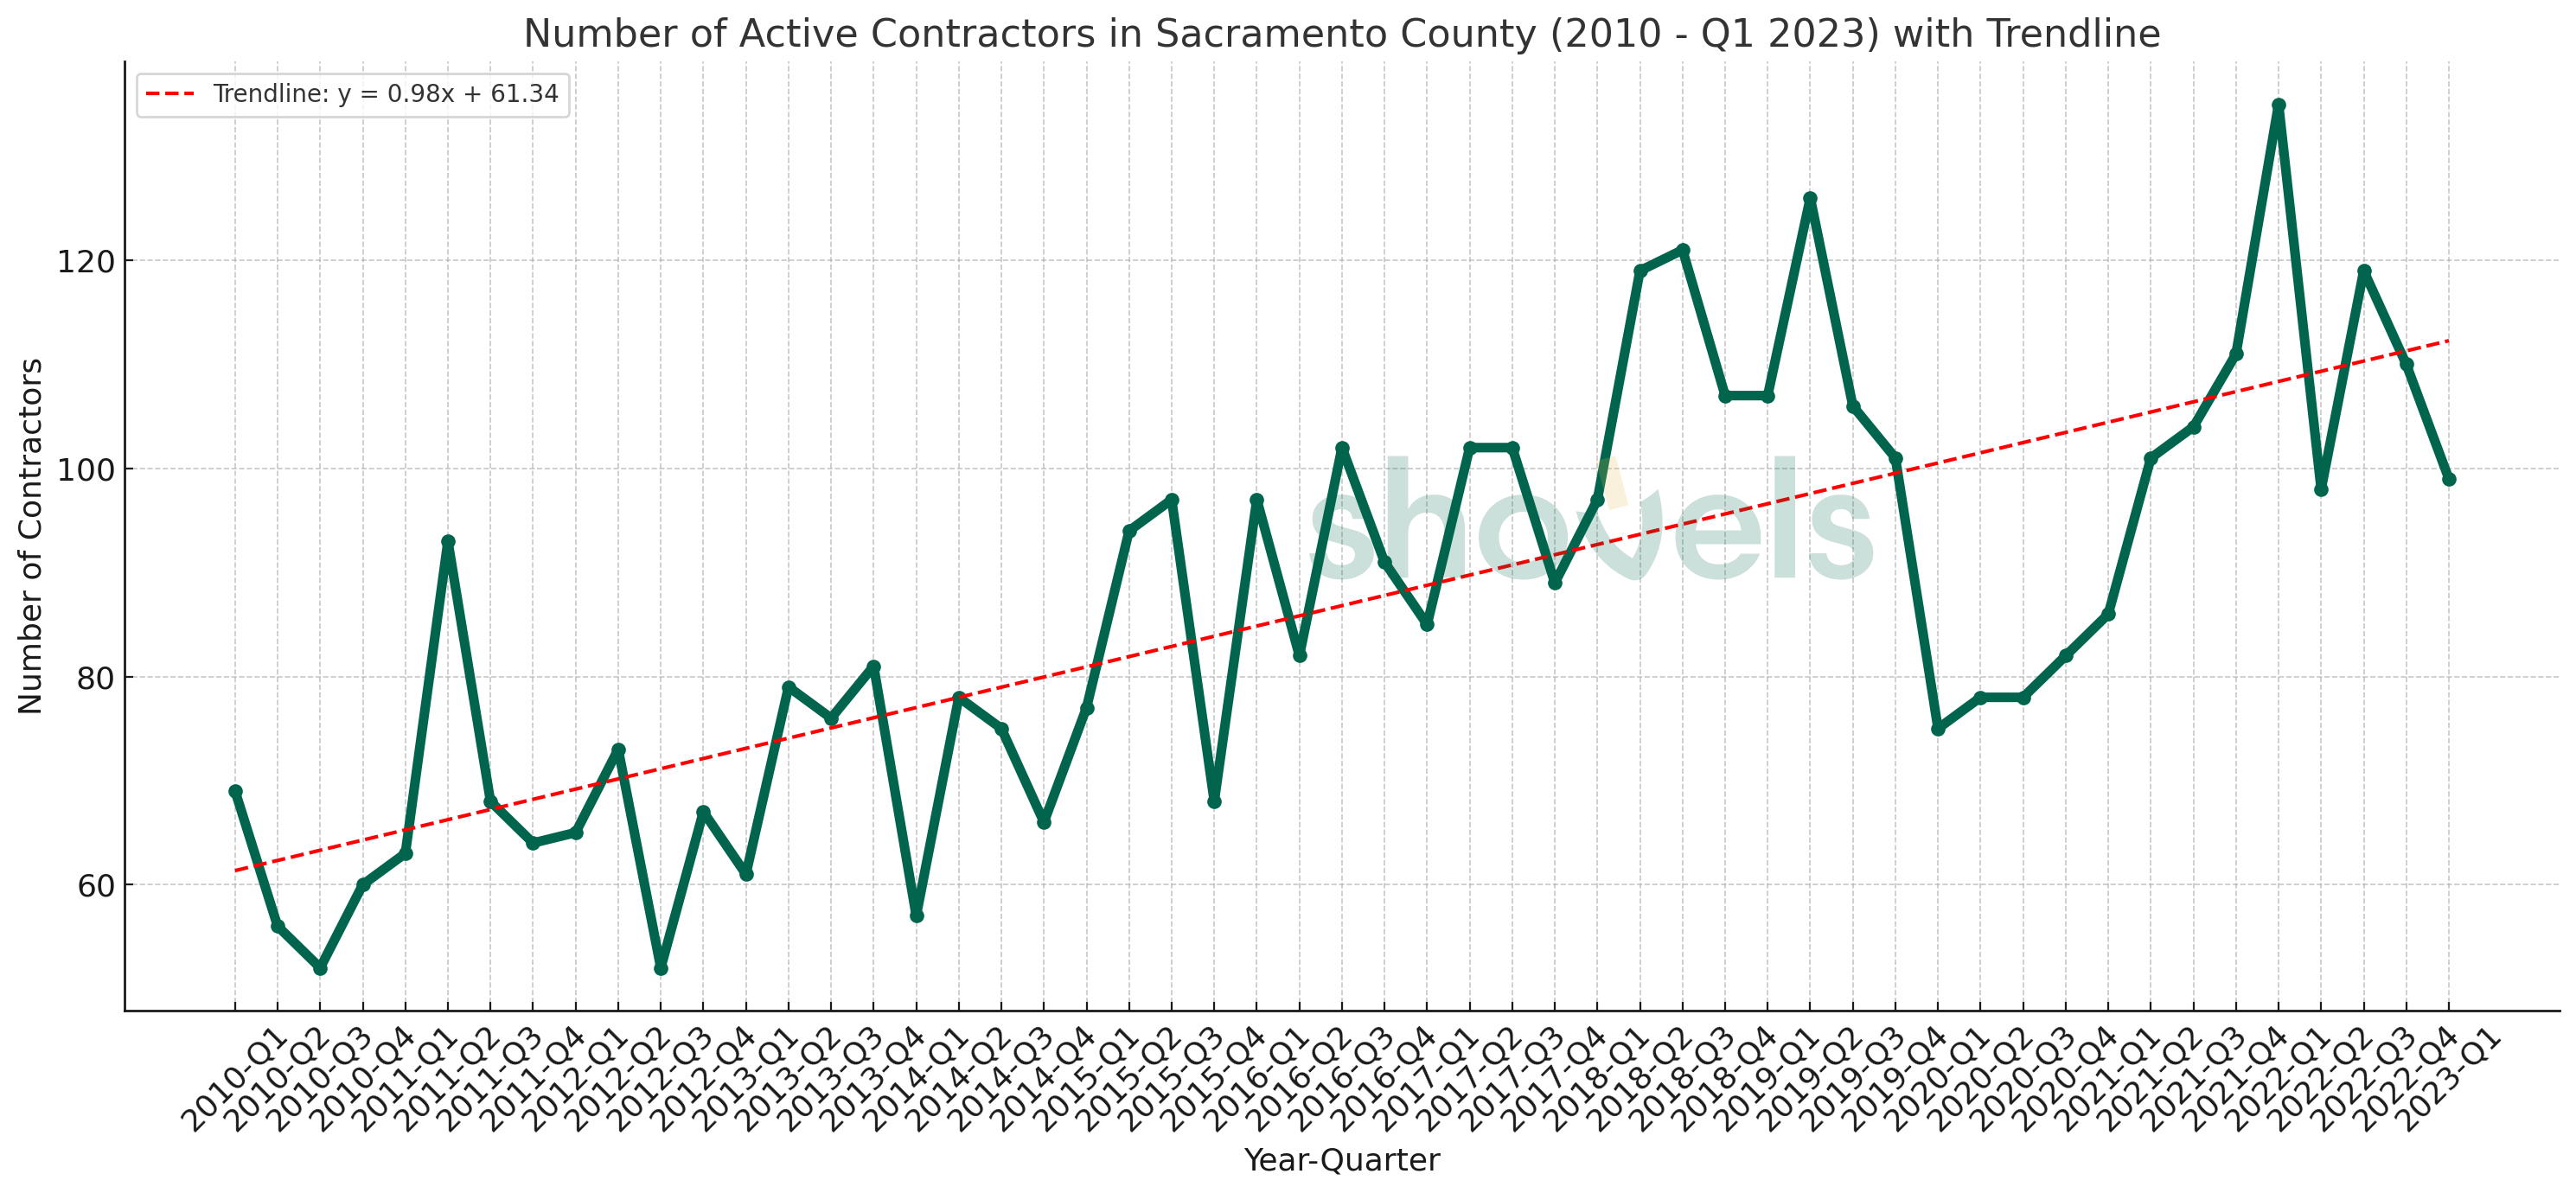
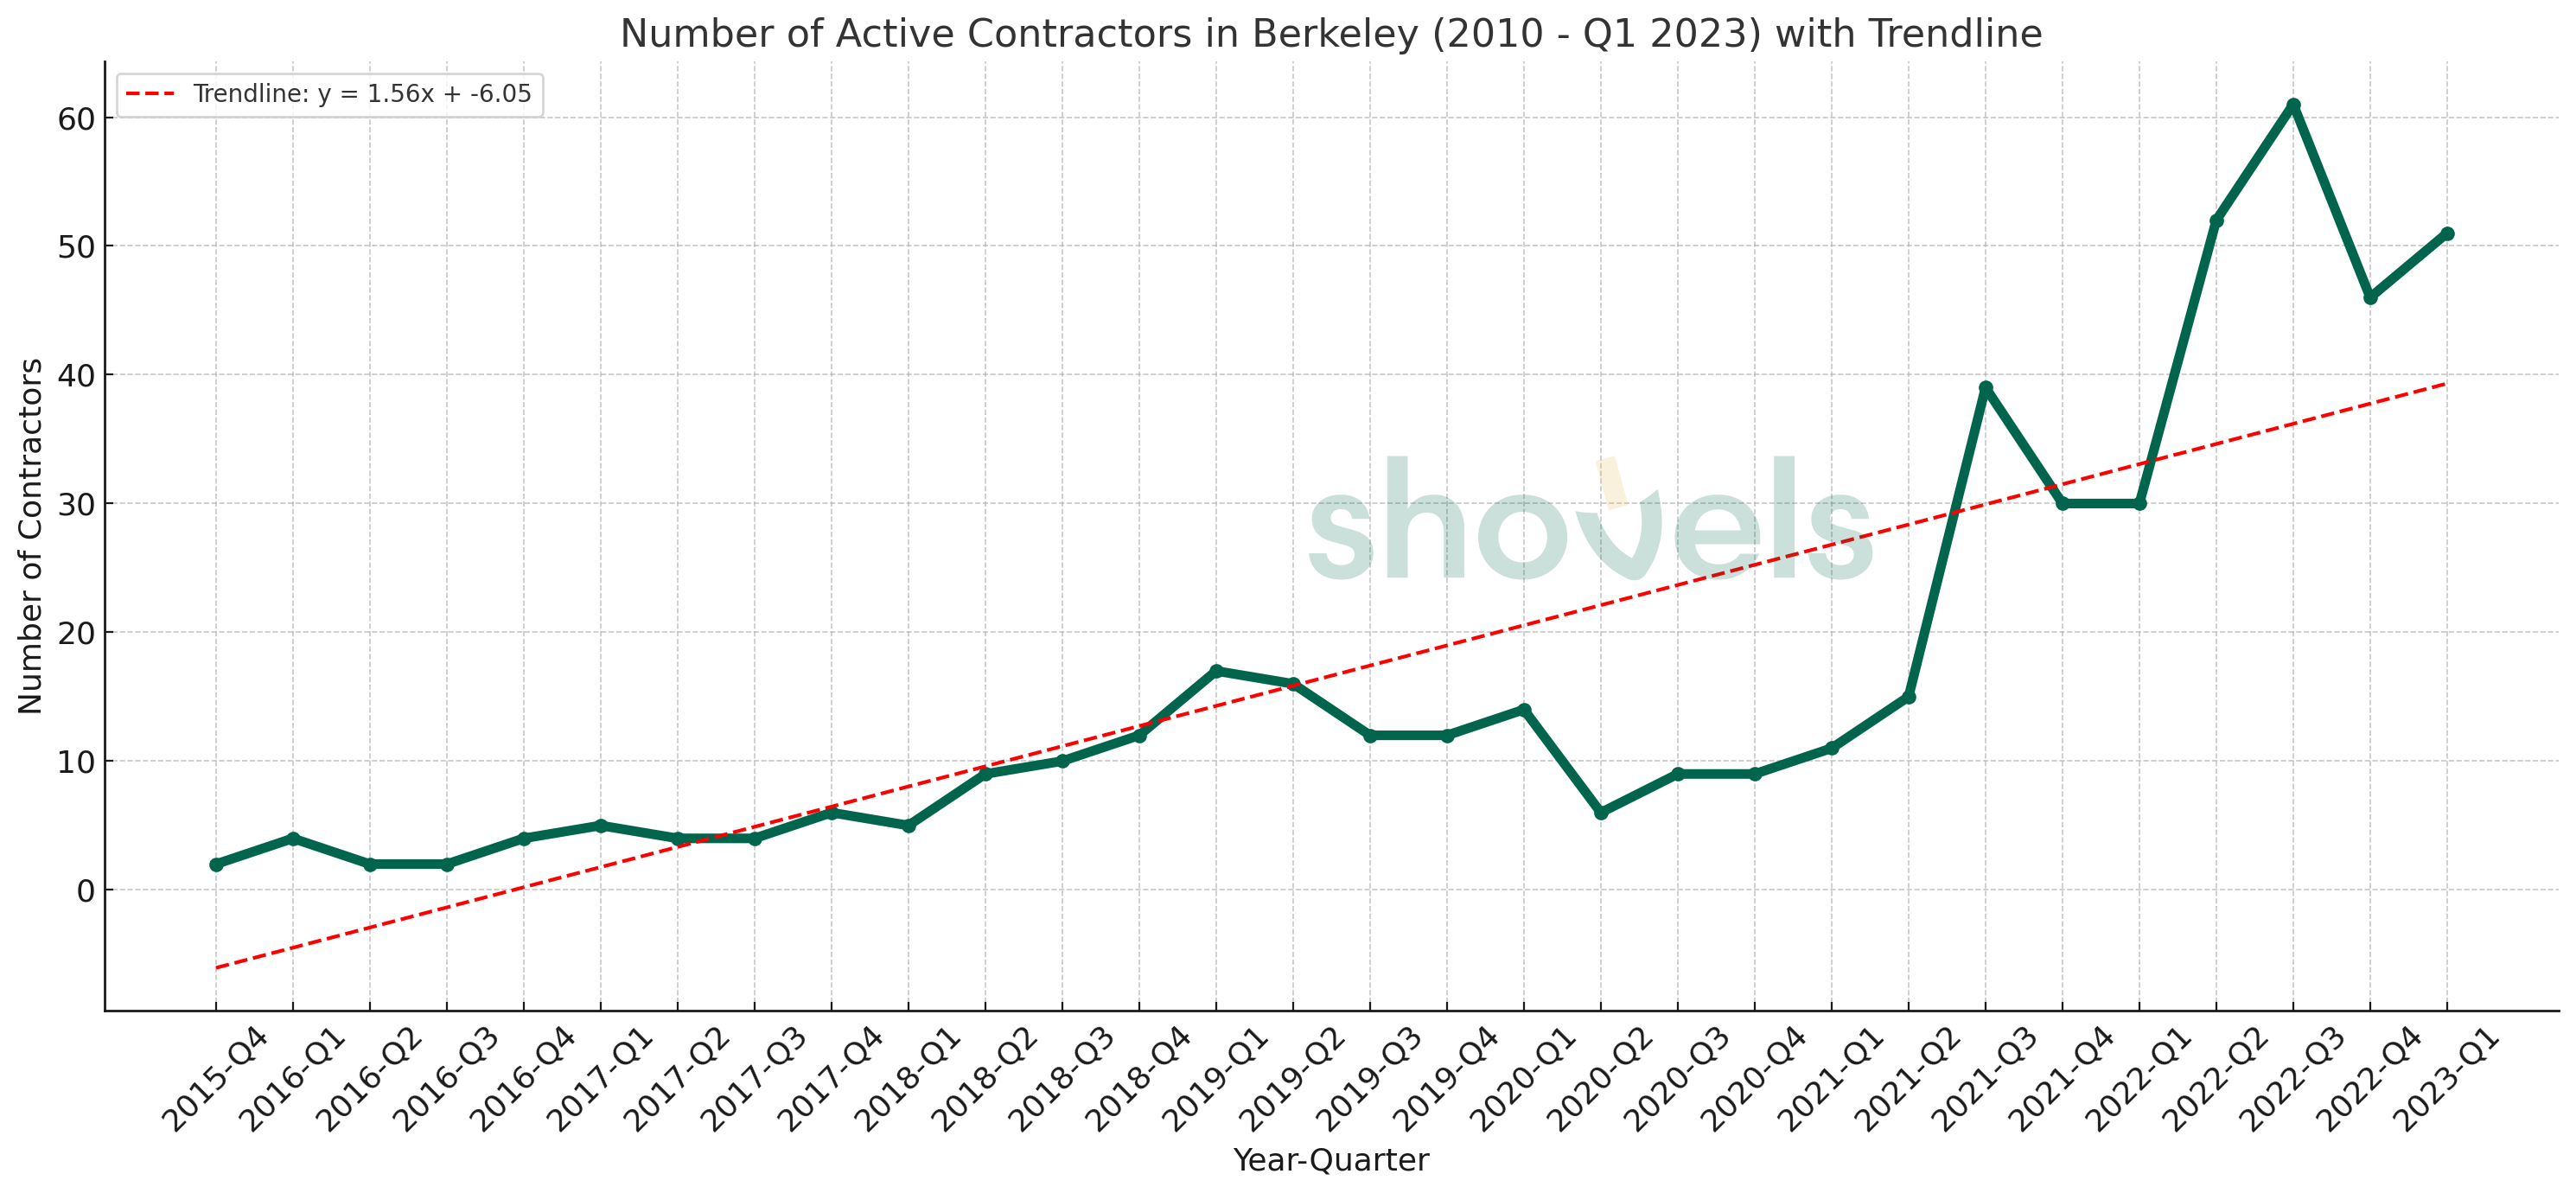
The trend line shows that in Sacramento, another EV charger contractor has become active every quarter. In Berkeley, it’s another 1.5 contractors active each quarter.
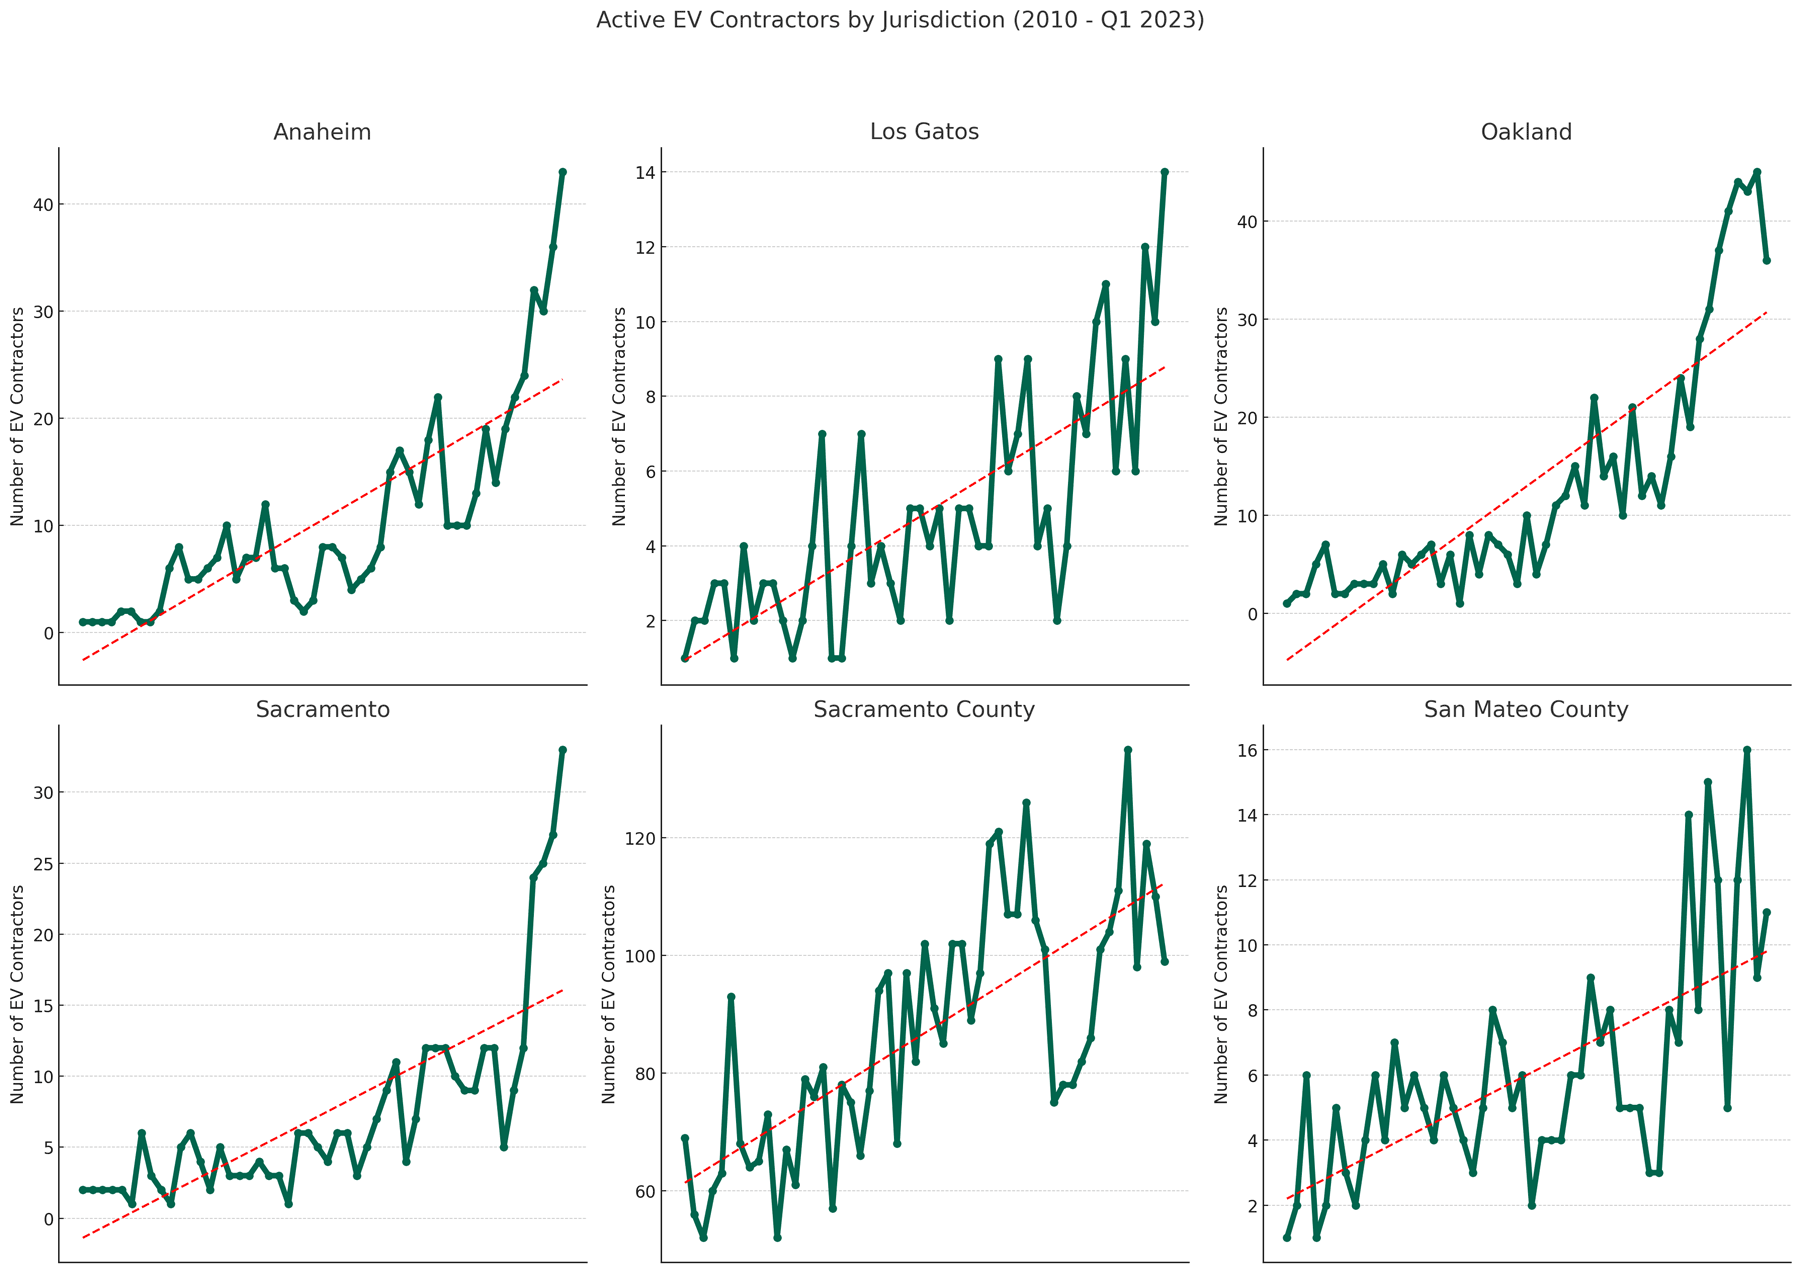
Berkeley and Sacramento have the most active contractors. In jurisdictions with fewer contractors, is the rate of new activity higher?
Yes, it is.

The lower the base, the higher the slope, with dramatic recent increases in contractor activity in Anaheim, Sacramento, and Oakland.
Note: Sacramento (City) and Sacramento County are different permitting jurisdictions, so there’s no overlap here in the charts.
The idea that there should be an increase in new EV charger contractors intrigued us, so we did that analysis, too.
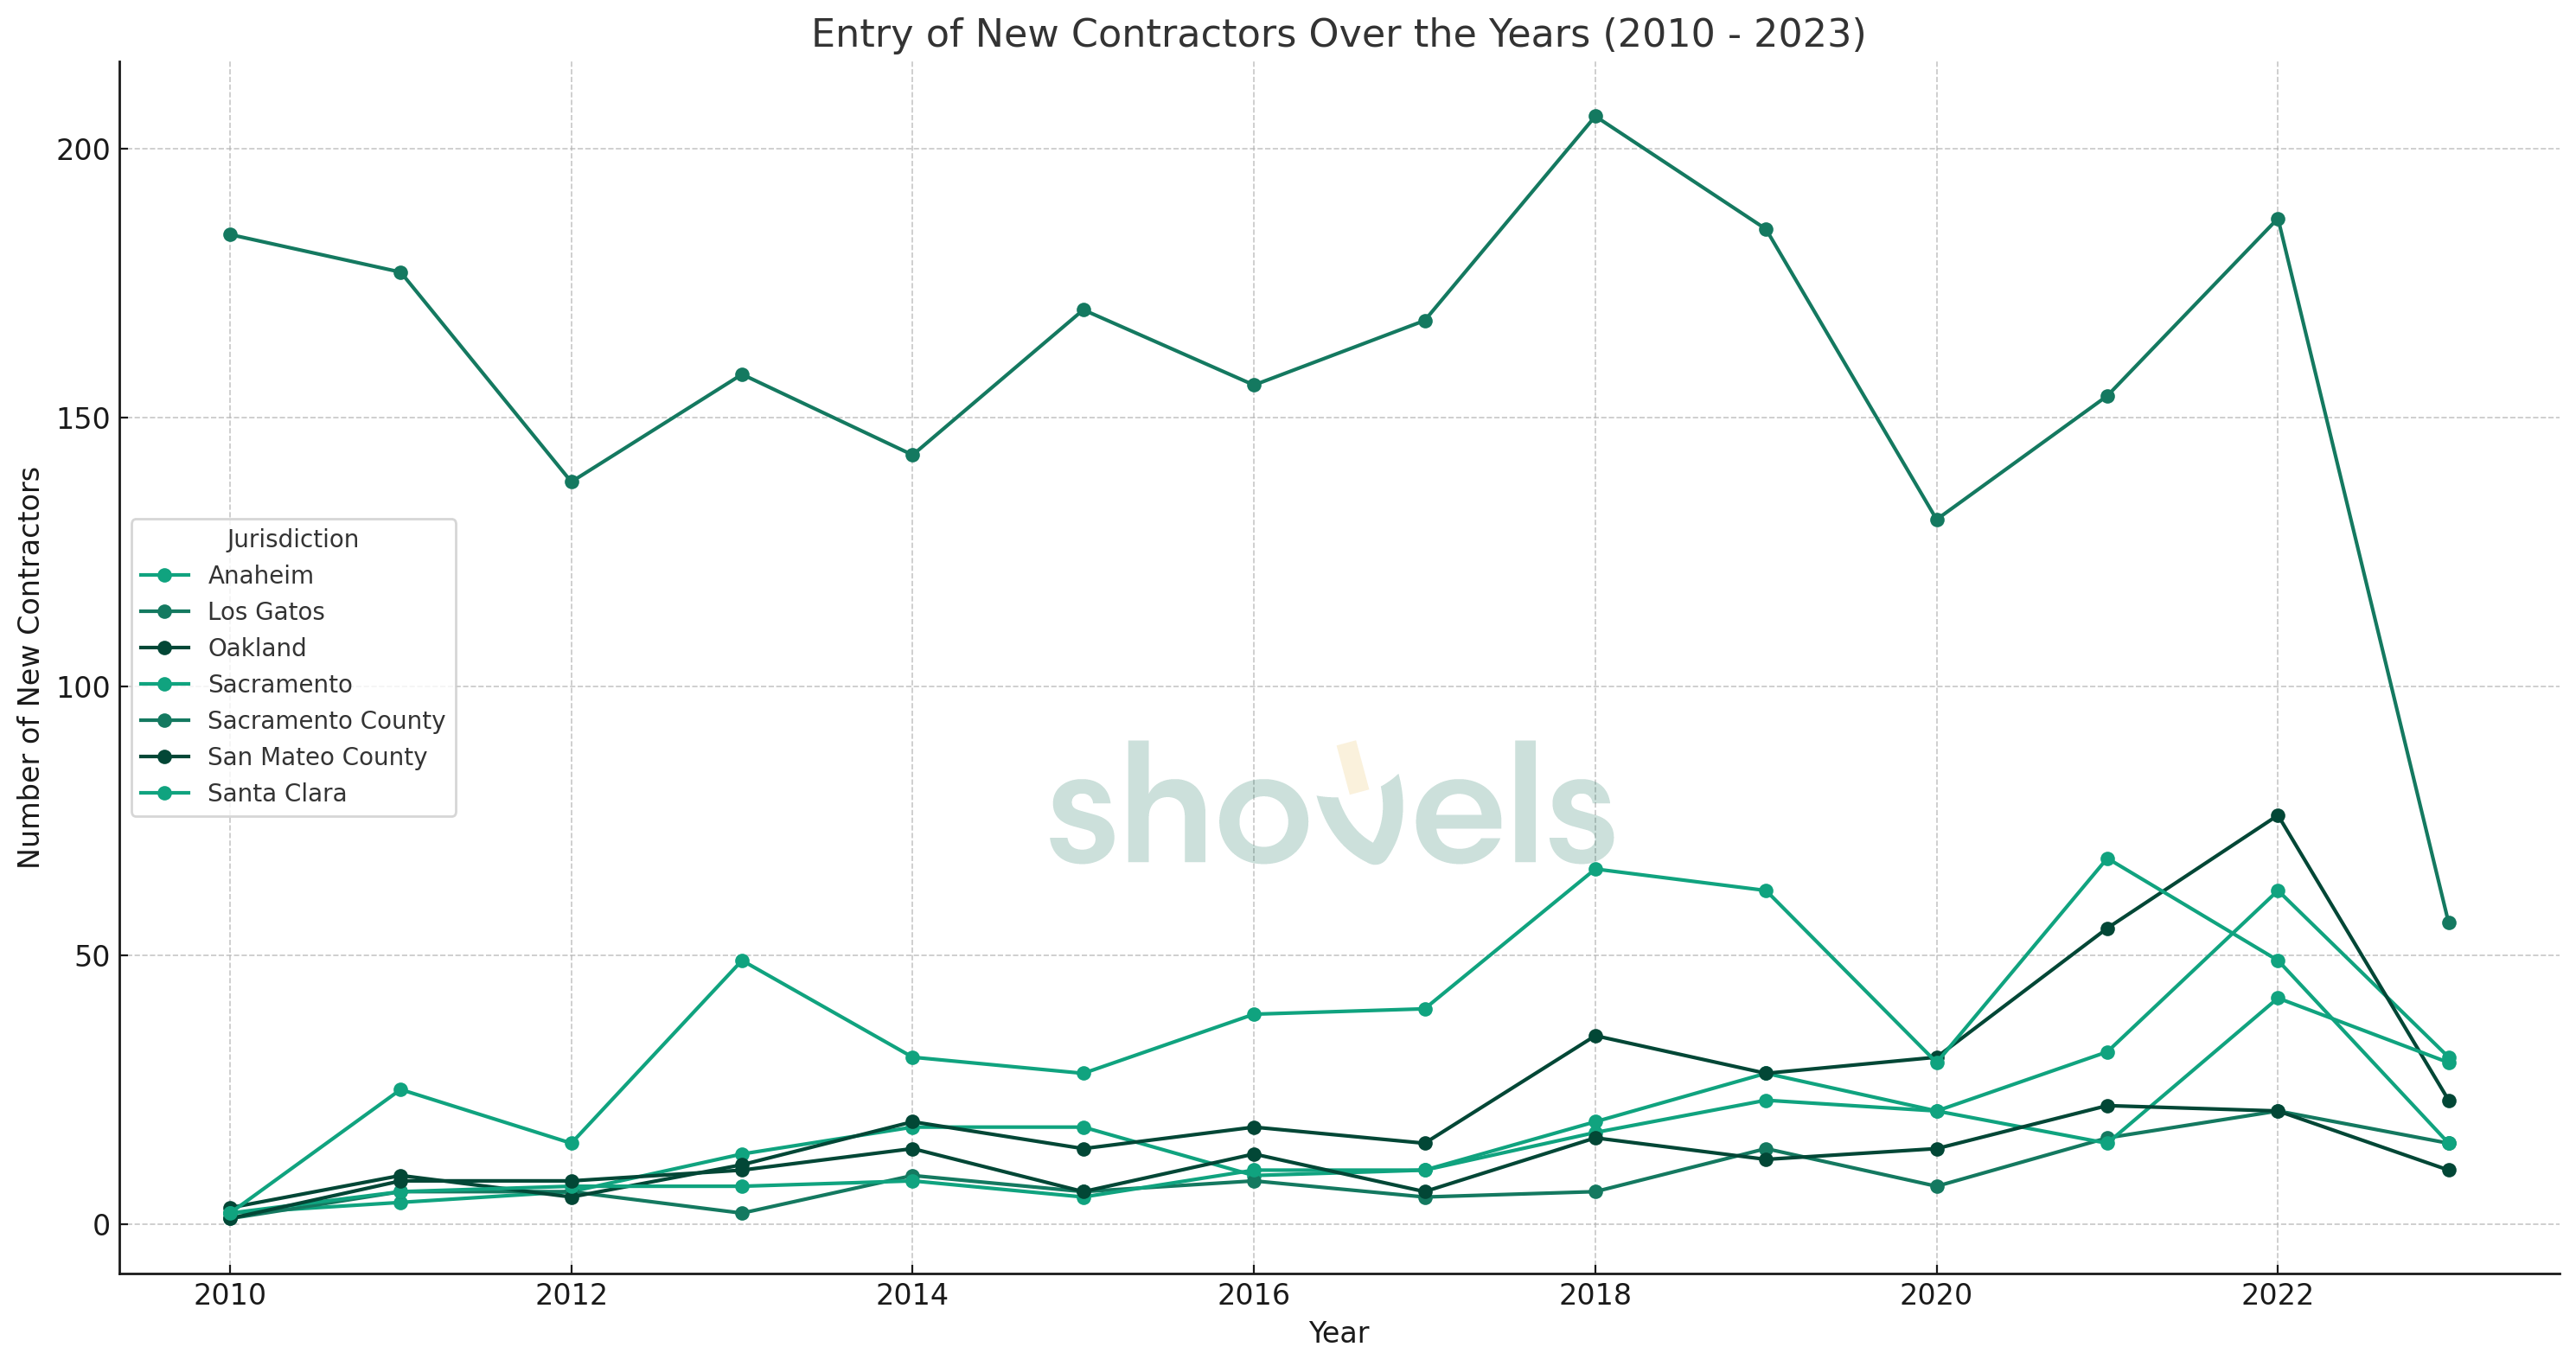
This chart shows the number of new contractors entering each of the jurisdictions each year. A new contractor is one that had no permit history in the years prior. You can see an acceleration happening between 2010 and 2022 as these jurisdictions add more new EV charger contractors each year. Anaheim is the outlier. They started high and stayed high.
The EV charger market is growing at an increasing rate. Supply of contractors (as well as hardware, software, and services) is responding to an increase in demand, and we can track this response using Shovels building permit data.
Finally, we figured that another sign of market growth could be EV contractors expanding their own territories. We decided to look at the percentage of EV contractors doing work in multiple jurisdictions each quarter.
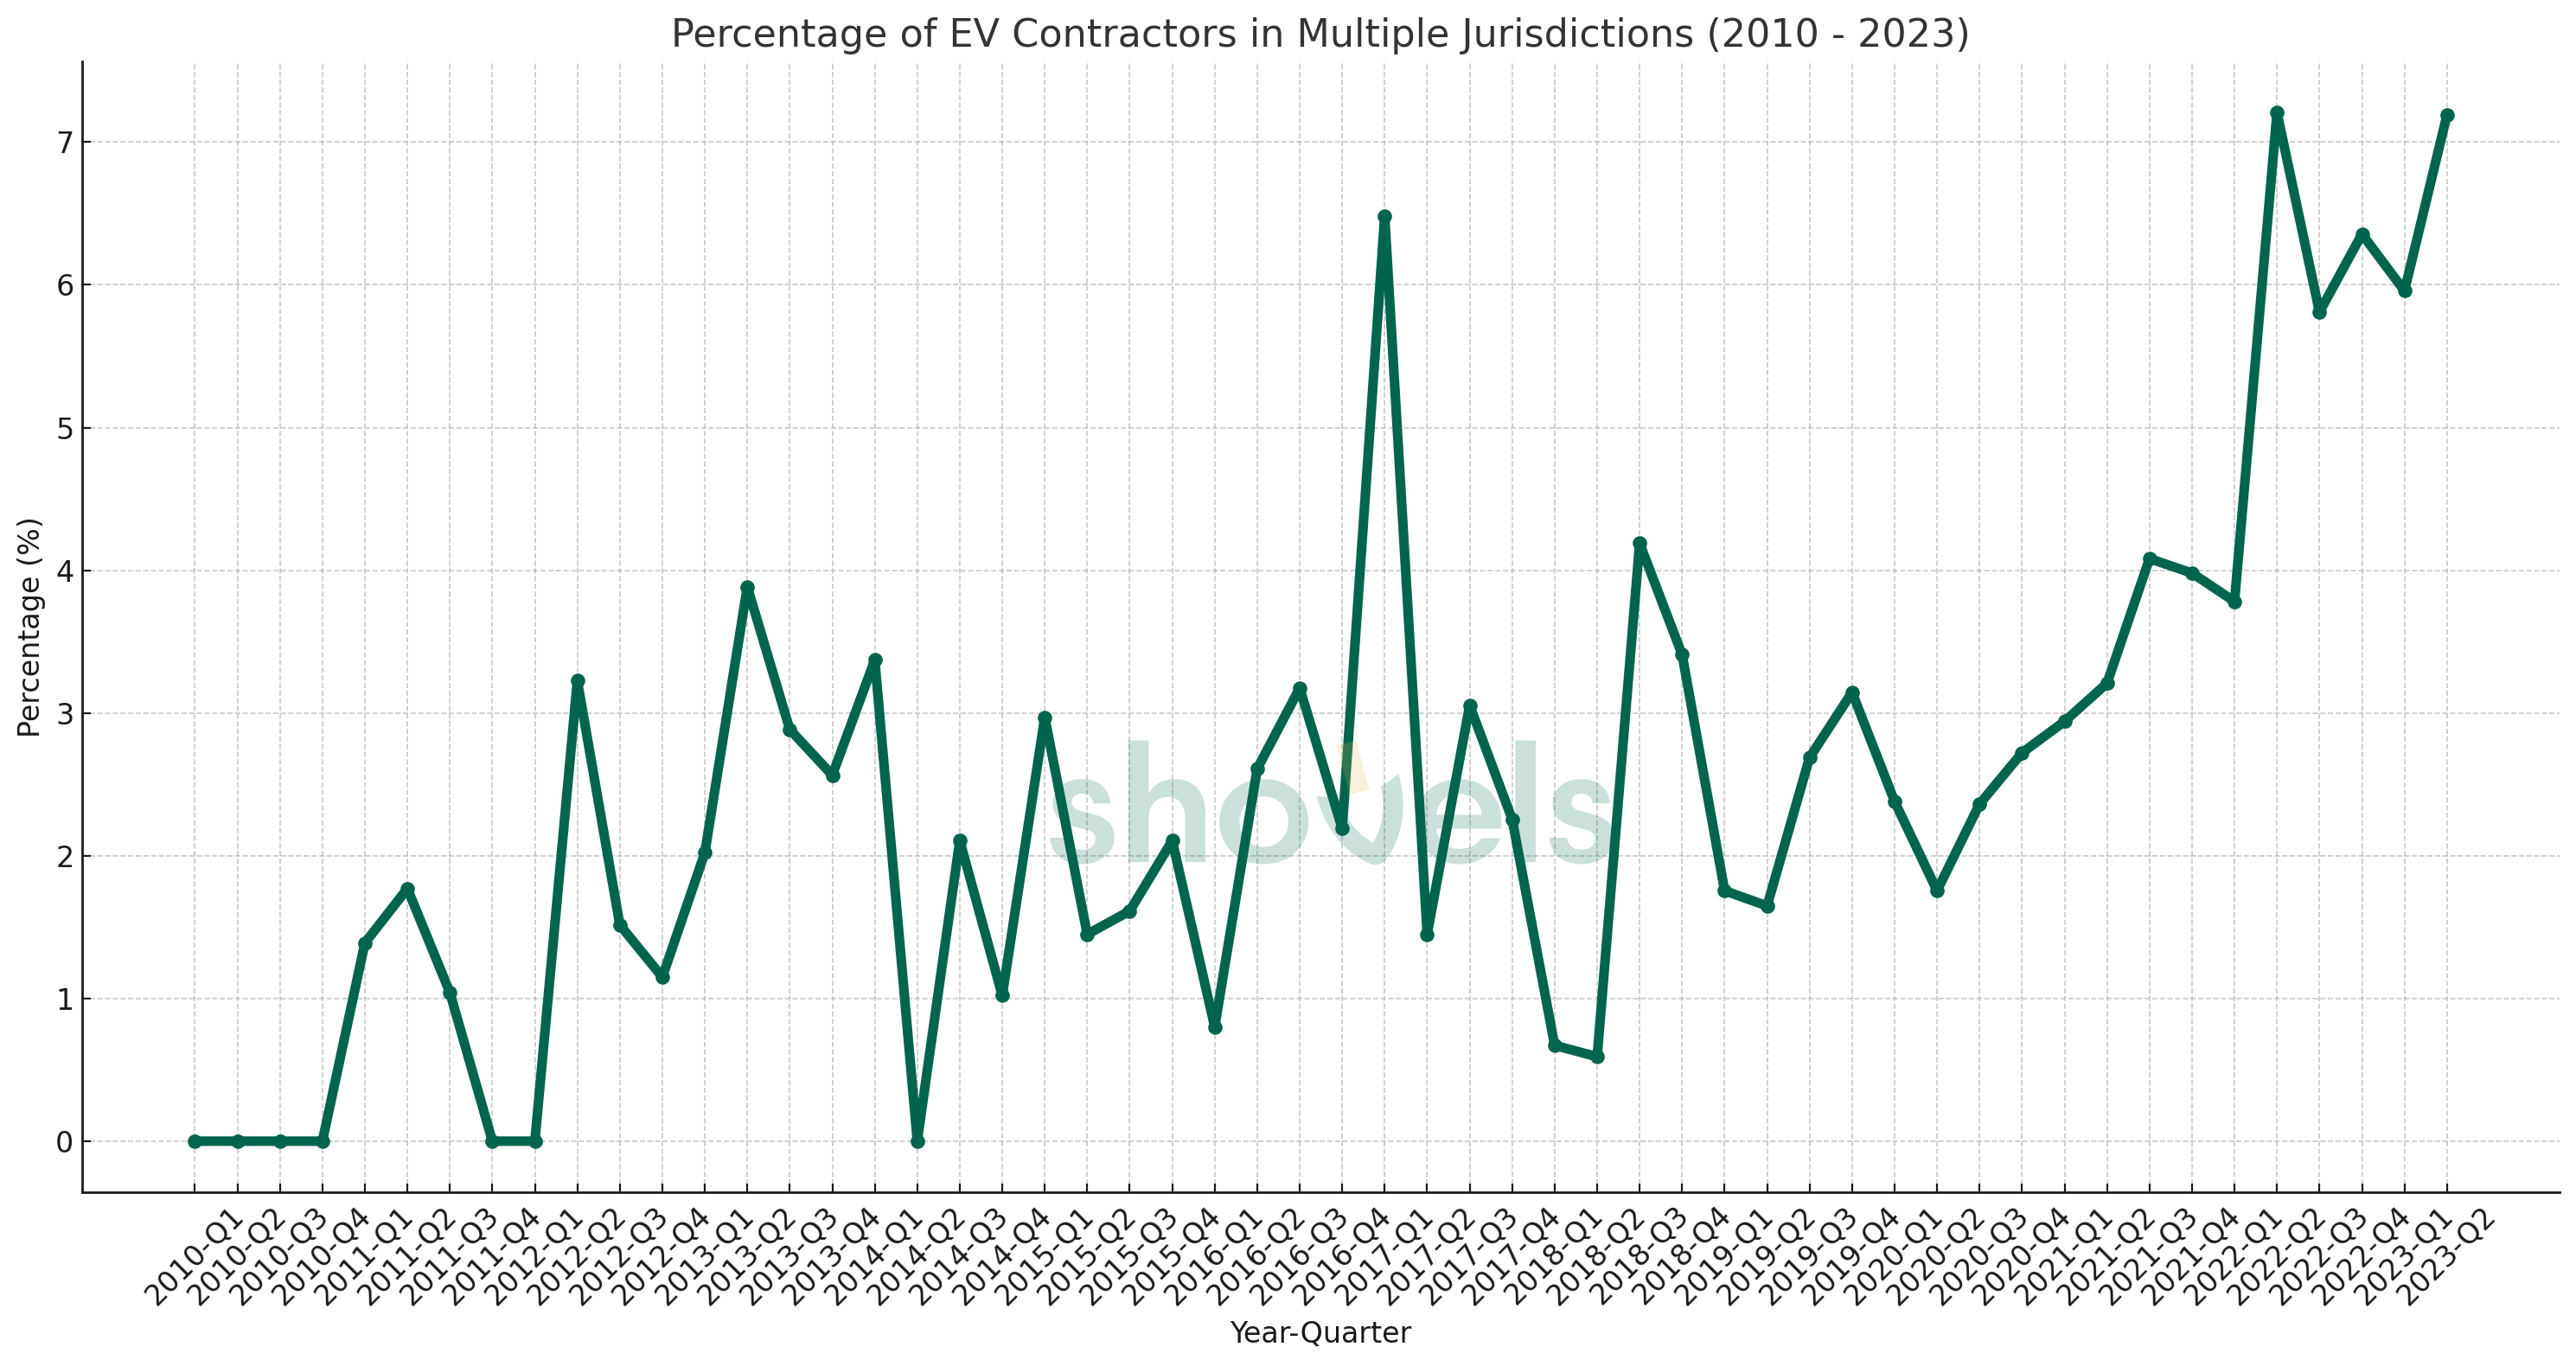
This geographical expansion is also trending up, with a big surge during COVID that sustained after the pandemic retreated.
Cool stuff, right? This means EV charging is hot. Dare we say electric. It's a good market to work and invest in.
We're excited by all of this data, and we want you to be excited too. Want to do your own epic analysis of the building trades? Get in touch: sales@shovels.ai.
Frequently Asked Questions
Q: Which California jurisdictions have the most active EV charger contractors?
A: Sacramento County leads with 429 active EV charger contractors since 2022, followed by Berkeley (209), Encinitas (203), Oakland (140), and Anaheim (119).
Q: Is the number of EV charger contractors in California growing?
A: Yes. In Sacramento, approximately one new EV charger contractor becomes active each quarter, and in Berkeley the rate is about 1.5 new contractors per quarter. Jurisdictions with fewer contractors are seeing even faster growth rates, with dramatic recent increases in Anaheim, Sacramento, and Oakland.
Q: What share of US EV chargers are installed in California?
A: Nearly 30% of all EV chargers in the US are installed in California. The next largest states by share are New York, Florida, Texas, Massachusetts, and Washington, which collectively account for about 25%.
Q: Are EV charger contractors expanding into multiple jurisdictions?
A: Yes. The percentage of EV contractors working across multiple jurisdictions has been trending upward, with a significant surge during COVID that sustained even after the pandemic subsided. This geographic expansion is another indicator of market growth.
--
Special thanks to David Kim from Monterra for contributing to this article!