
As the world embraces green energy solutions, electric vehicles (EVs) have become increasingly popular. This surge in EV adoption has driven a rapid expansion of the EV charging infrastructure – and now developers can use our building permit API to access monthly EV charger installation data.
Our EV charger permit data shows tremendous growth of EV charging infrastructure. We see where it's happening and who's doing the installations. To learn more about how to access this valuable data, check out our API documentation at https://docs.shovels.ai/api-reference!
Overview of EV charging infrastructure expansion
California's EV charging infrastructure is experiencing unprecedented growth as demand for electric vehicles continues to grow. Government policies, such as subsidies and tax incentives, which have created a favorable environment for the growth of the EV market have driven this surge in EV adoption. In addition, technology advancements have lowered the cost of EV charging systems, allowing consumers to easily charge electric vehicles at home.
For example, many cities have introduced curbside chargers that allow users to charge their cars while they are parked on the street or in parking garages. New public chargers are added daily across the country. Businesses and organizations are also making significant investments in EV infrastructure. Private companies are building large-scale networks of high-powered chargers that can charge multiple cars at once. These networks can be found in airports, shopping centers, and other areas with high traffic. Additionally, many municipalities are investing heavily in public charger networks, making it easier than ever before to find a charger when you need one.
These advancements in technology and policy initiatives have helped create an incredibly robust and rapidly growing EV charging infrastructure that is helping drive consumer adoption of EVs worldwide. Developers are now able to access detailed EV charger installation data through the Shovels API. We share historical trends and the exact places and companies who carried out the work.
Gathering and analyzing EV charger data
Gathering and analyzing EV charger data is essential for businesses, developers, and governments to understand the current state of the EV charging market and identify areas where it needs to be expanded. With the right tools, developers can accurately map out existing EV charger locations and explore geographic distribution of charger networks.
Geographic information systems (GIS) are powerful tools that enable developers to map out EV charger locations based on their lat/long coordinates or addresses. GIS can also be used to analyze existing infrastructure to identify areas with high demand for additional charging stations. Companies can use Shovels data to see residential EV charger activity, which could inform the location for commercial charging stations.
For utilities, this data will be helpful to perform stress test modeling on the electrical grid. For states that have put in place GHG reduction goals, understanding consumer adoption of EV chargers will provide more support for transitioning power sources to solar, wind, and other renewables.

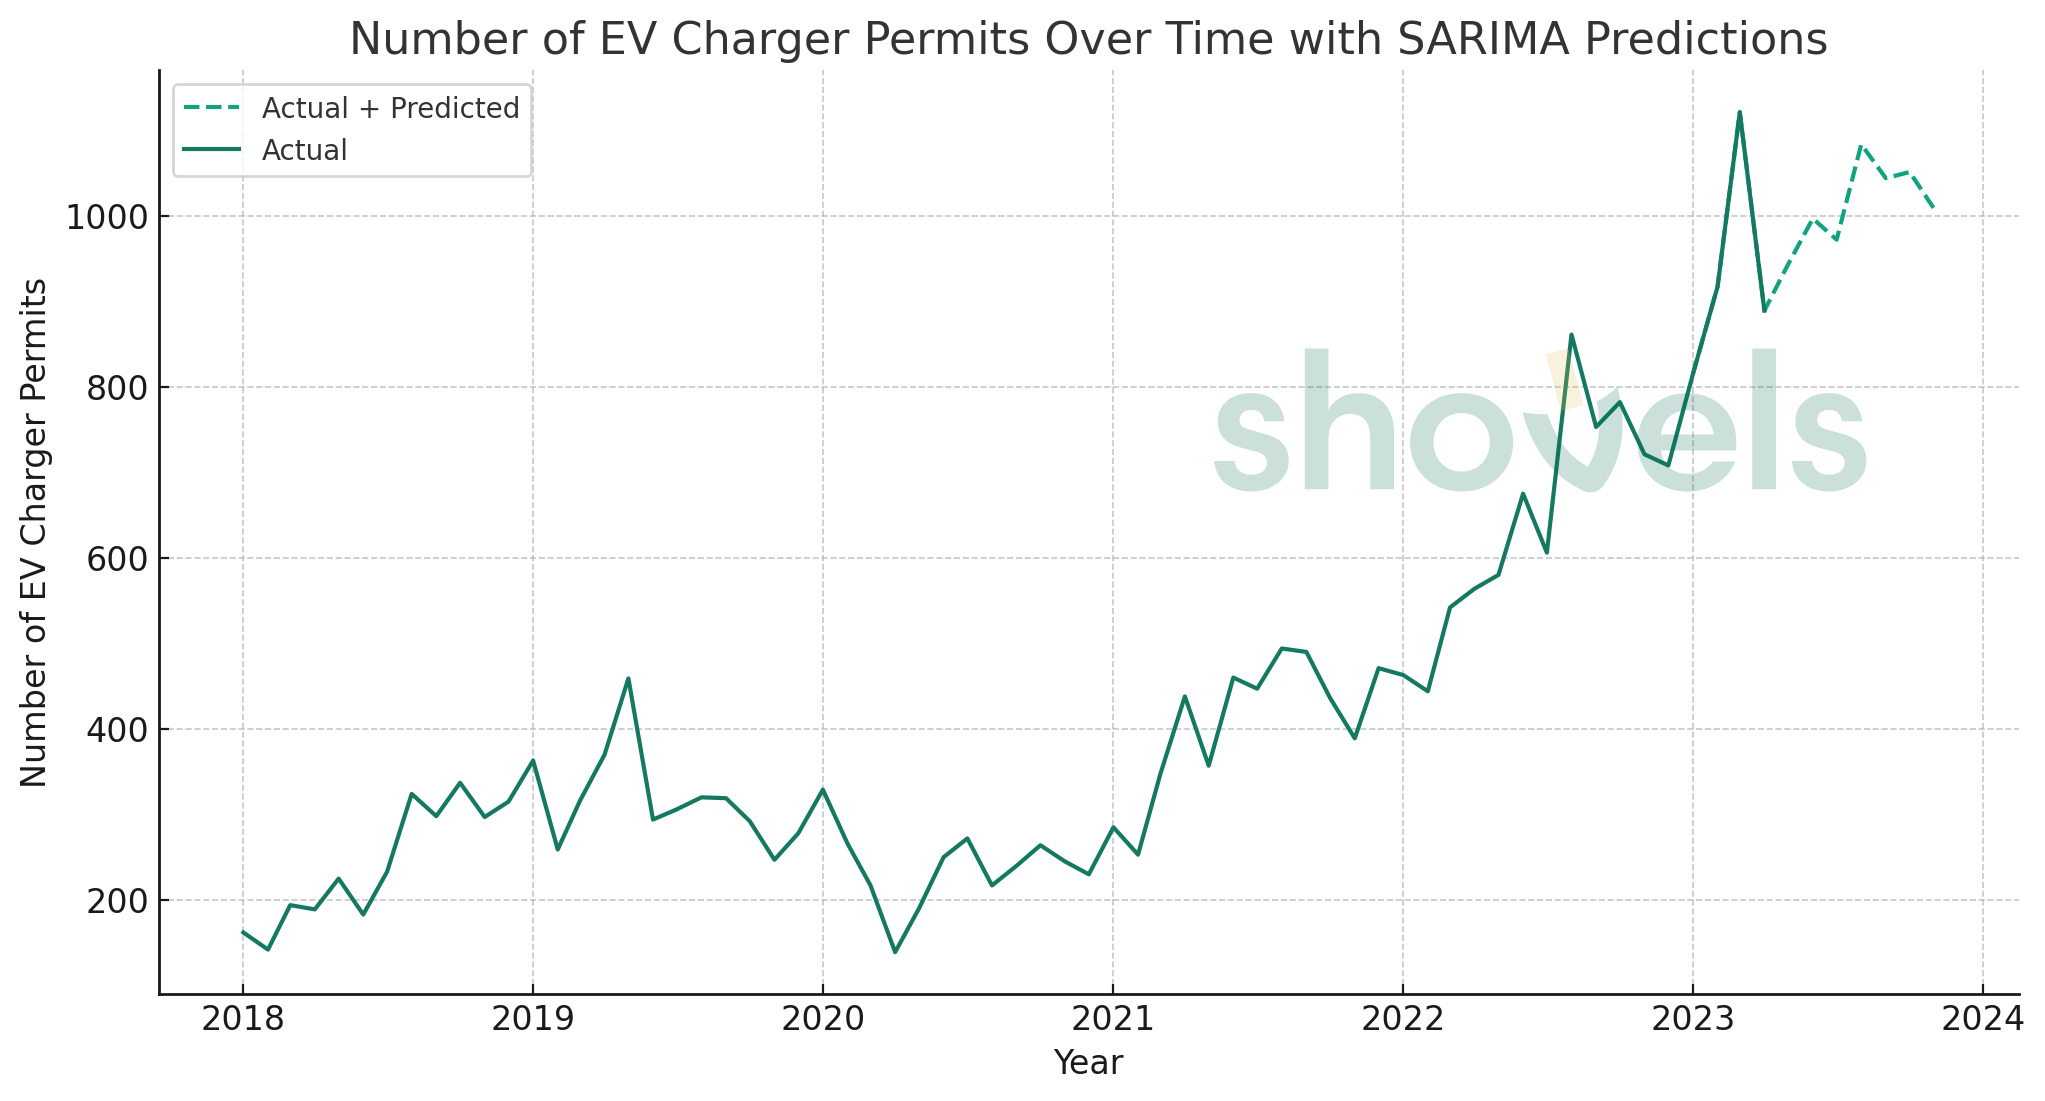
Insights from our EV charger permit dataset
By examining the EV charger data contained in our building permit API, we can gain a new level of insight into the expansion of EV charging infrastructure.
Here's the public link to this dataset on Kaggle.
Growth:
- The Compound Annual Growth Rate (CAGR) for the number of EV charger permits in California from 2012 to 2022 is approximately 38.76%.
- Based on monthly EV data going back to 2012, we predict California will see about 11,000 EV permits in 2023, roughly 40% more than 2022, and 13,000 EV permits in 2024, another 20% jump.
Seasonality:
- It appears that the months of August, October, and September have the highest average number of permits. Here are those monthly averages between 2012 and 2022:
- January: 184.00
- February: 150.91
- March: 186.91
- April: 192.64
- May: 201.73
- June: 211.18
- July: 203.18
- August: 239.64
- September: 236.00
- October: 240.55
- November: 214.45
- December: 229.00
- It's worth noting that the number of permits also seems to be lower in the beginning of the year and tends to increase as the year progresses.
- The number of permits issued each month varies significantly, indicating the presence of considerable volatility in the data. This could be due to various factors such as changes in governmental policies, market demand, technological advancements, and other external factors.
This is just one slice of our permit data. You can also read about EV charger permit processing times here. We also offer a comprehensive overview of current and future trends in all energy transition activities, including heat pumps and solar installations.
How to access building permit data with Shovels
Accessing building permit data is essential for developers, businesses, government, and researchers who want to understand the current state of energy transition infrastructure and identify areas where it needs expansion. To make this process easier, we have a building permit API that enables our customers to query building permits by the type of work involved.
For example, you can query for wall battery permits, heat pump HVAC conversions, solar panel installations, and EV charger networks. The data returned from these queries can be used for construction go-to-market activities, providing highly targeted leads for sales teams. Developers can also use this data to create applications related to energy transition activities, such as mapping out EV charger locations or predicting future demand for electric vehicles.
To learn more about how you can use the Shovels building permit API to access monthly energy transition activity data and build applications related to this area, check out our documentation at https://docs.shovels.ai/api-reference!
Frequently Asked Questions
Q: How fast is EV charger installation growing in California?
A: The compound annual growth rate (CAGR) for EV charger permits in California from 2012 to 2022 was approximately 38.76%. Based on monthly data, Shovels projected roughly 11,000 permits in 2023 (a 40% increase over 2022) and 13,000 in 2024 (another 20% jump).
Q: Is there a seasonal pattern to EV charger permit filings in California?
A: Yes. The months of August, September, and October tend to have the highest average number of permits. Permit volumes are generally lower at the start of the year and increase as the year progresses.
Q: What types of energy transition data does the Shovels building permit API cover?
A: Beyond EV charger installations, the Shovels API covers wall battery permits, heat pump HVAC conversions, solar panel installations, and other energy transition activities. Users can query by the type of work involved.
Q: How can businesses use EV charger permit data?
A: Businesses can use residential EV charger permit data to identify optimal locations for commercial charging stations, perform stress tests on the electrical grid, generate targeted sales leads, and predict future demand for electric vehicles.