
Background on EV charging in California
In keeping with our thinking about EV chargers, which you can read more about here, we're turning our attention now to how long it takes for jurisdictions to approve EV charger permits.
First, let's take a step back. This analysis is important because California has committed to deploying five million zero-emission vehicles (ZEVs) and building out 250,000 charging stations by 2025. This includes building a network of nearly 20,000 Level 2 and DC fast EV charging stations across the state. Additionally, the state plans to invest $2.5 billion over the next five years to expand the EV charging infrastructure and provide incentives for drivers to purchase electric vehicles.
Having more residential EV chargers would make it easier for California residents to own and use electric vehicles. This would also relieve the burden on public EV chargers. The more EV chargers we have in homes, the less strain on the public chargers required for people who live in multifamily housing and don't have a dedicated charger.
More residential EV chargers also creates more jobs and boost the economy. Installation and maintenance of these chargers increases demand for electricians, supporting many local businesses. Shovels tracks these installation trends as part of our broader climate and energy permit data, covering solar, heat pumps, and battery storage alongside EV chargers.
Potential for building permit reform
One way to get more EV chargers installed is to streamline the permitting process. EV chargers, because they are high-voltage, require a licensed electrician and a building permit to begin the installation, and an inspector must approve it.
While this process can be cumbersome, building permits exist to ensure that construction projects adhere to local safety and building codes. This is important for protecting the public and ensuring that buildings are safe and structurally sound. Building permits also provide a way for local governments to track construction projects and collect fees to help fund public services.
Some people advocate permitting reform because the current permitting process is overly burdensome, time consuming, and costly, leading to delays and inefficiencies. Permitting reform may reduce the time and cost of obtaining permits, and make it easier for businesses and homeowners to quickly obtain the necessary approvals to install appliances like EV chargers.
Okay, with that background, let's look at the data in California.
Shovels analysis of EV charger permit approval times
Shovels collects and analyzes building permit data. Two data points that we consistently see are the file date, or when the permit was submitted to the jurisdiction, and the issue date, or when the jurisdiction approved the permit. At this point, work can begin, and we'll eventually see the final date, or when the work was completed.
The file date and the issue date show how long it takes for a jurisdiction to process a permit. As anyone who has had work done knows, this can be an agonizing process. The longer the delay, the more likely your contractor will get busy or supply costs will increase. Homeowners and contractors both want faster permit approval times.
With that in mind, we set out to ask a few questions:
Differences between jurisdictions
Jurisdiction comparison: Which jurisdictions have the fastest and slowest average EV permit approval times? How do they compare to each other?
Are there differences in permit approval times between Northern and Southern California?
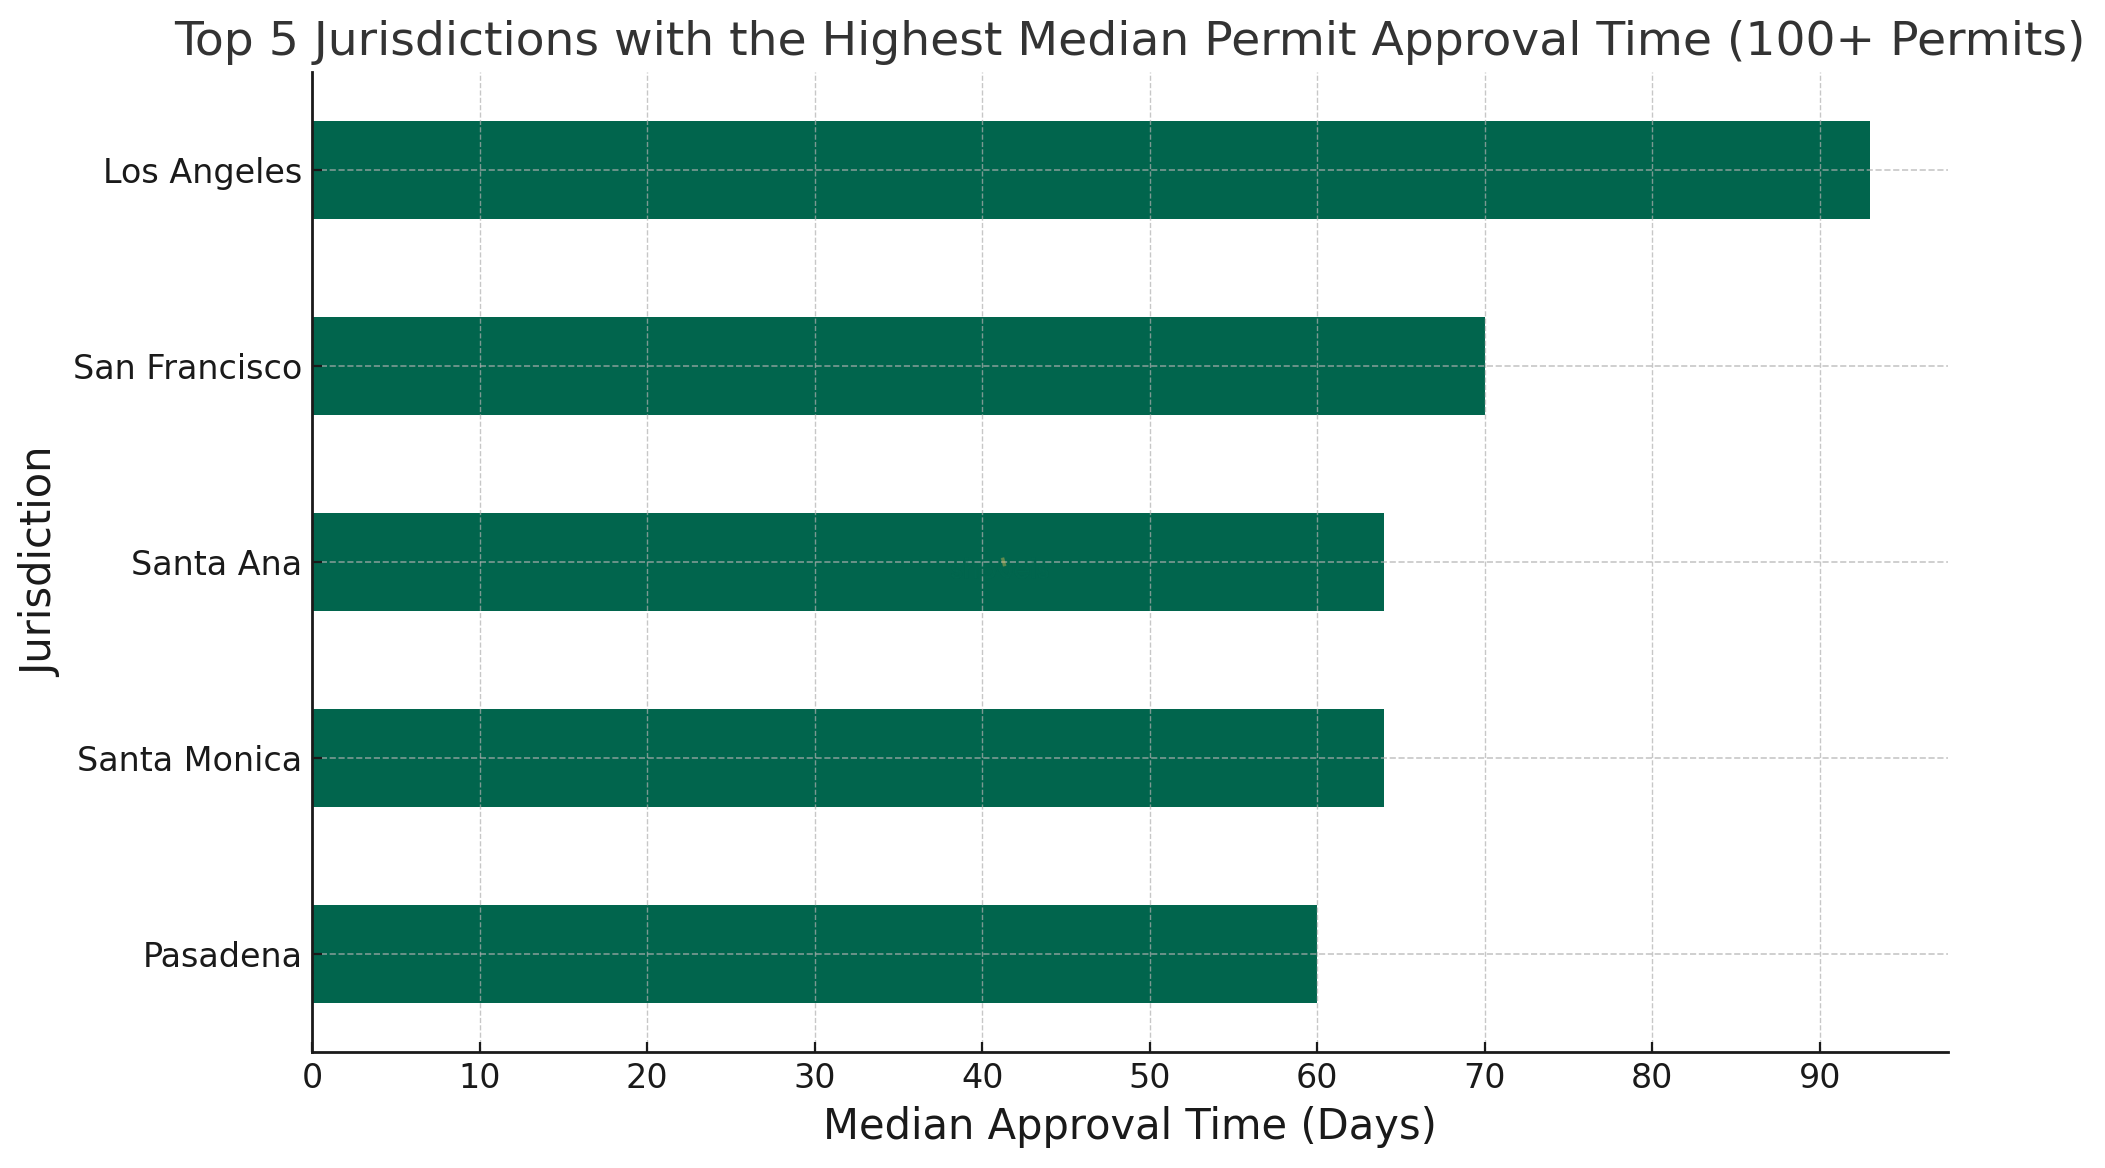
Here are the jurisdictions with the SLOWEST EV median charger permit approval times. We go with the median because there are outliers in the data that will skew the mean. You can see this in the table below, which shows that the mean is greater than the median in each case. The standard deviation and IQR (interquartile range) also demonstrate the skew. Therefore, the median is our best way to compare jurisdictions.
It's interesting that four of the five slowest permitting jurisdictions are in Southern California. The median approval times are at least two months. That's too long!
| Jurisdiction | Count | Mean | Standard Deviation | Median | Q1 | Q3 | IQR |
|---|---|---|---|---|---|---|---|
| Los Angeles | 402.0 | 151.36 | 152.31 | 93.0 | 37.25 | 227.0 | 189.75 |
| San Francisco | 68.0 | 194.26 | 460.07 | 70.0 | 11.0 | 203.25 | 192.25 |
| Santa Ana | 72.0 | 99.71 | 117.26 | 64.0 | 31.0 | 103.0 | 72.0 |
| Santa Monica | 235.0 | 96.28 | 88.62 | 64.0 | 41.0 | 121.0 | 80.0 |
| Pasadena | 80.0 | 100.08 | 111.54 | 60.0 | 35.5 | 125.25 | 89.75 |

Looking now at the FASTEST EV charger timing jurisdictions, we see median times of less than a week. Interstingly, all but one of the jurisdictions is in Northern California. Even the averages here are reasonable, coming in at less than a month in the top four, but jumping to nearly three months average in San Diego.
| Jurisdiction | Count | Mean | Standard Deviation | Median | Q1 | Q3 | IQR |
|---|---|---|---|---|---|---|---|
| Oakland | 817.0 | 17.20 | 40.06 | 3.0 | 1.0 | 10.0 | 9.0 |
| Dublin | 94.0 | 36.00 | 108.14 | 4.0 | 1.0 | 17.75 | 16.75 |
| El Dorado County | 266.0 | 13.96 | 34.67 | 5.0 | 2.0 | 11.0 | 9.0 |
| Sacramento | 846.0 | 21.29 | 48.47 | 5.0 | 2.0 | 16.0 | 14.0 |
| San Diego County | 89.0 | 89.07 | 151.01 | 5.0 | 1.0 | 119.0 | 118.0 |
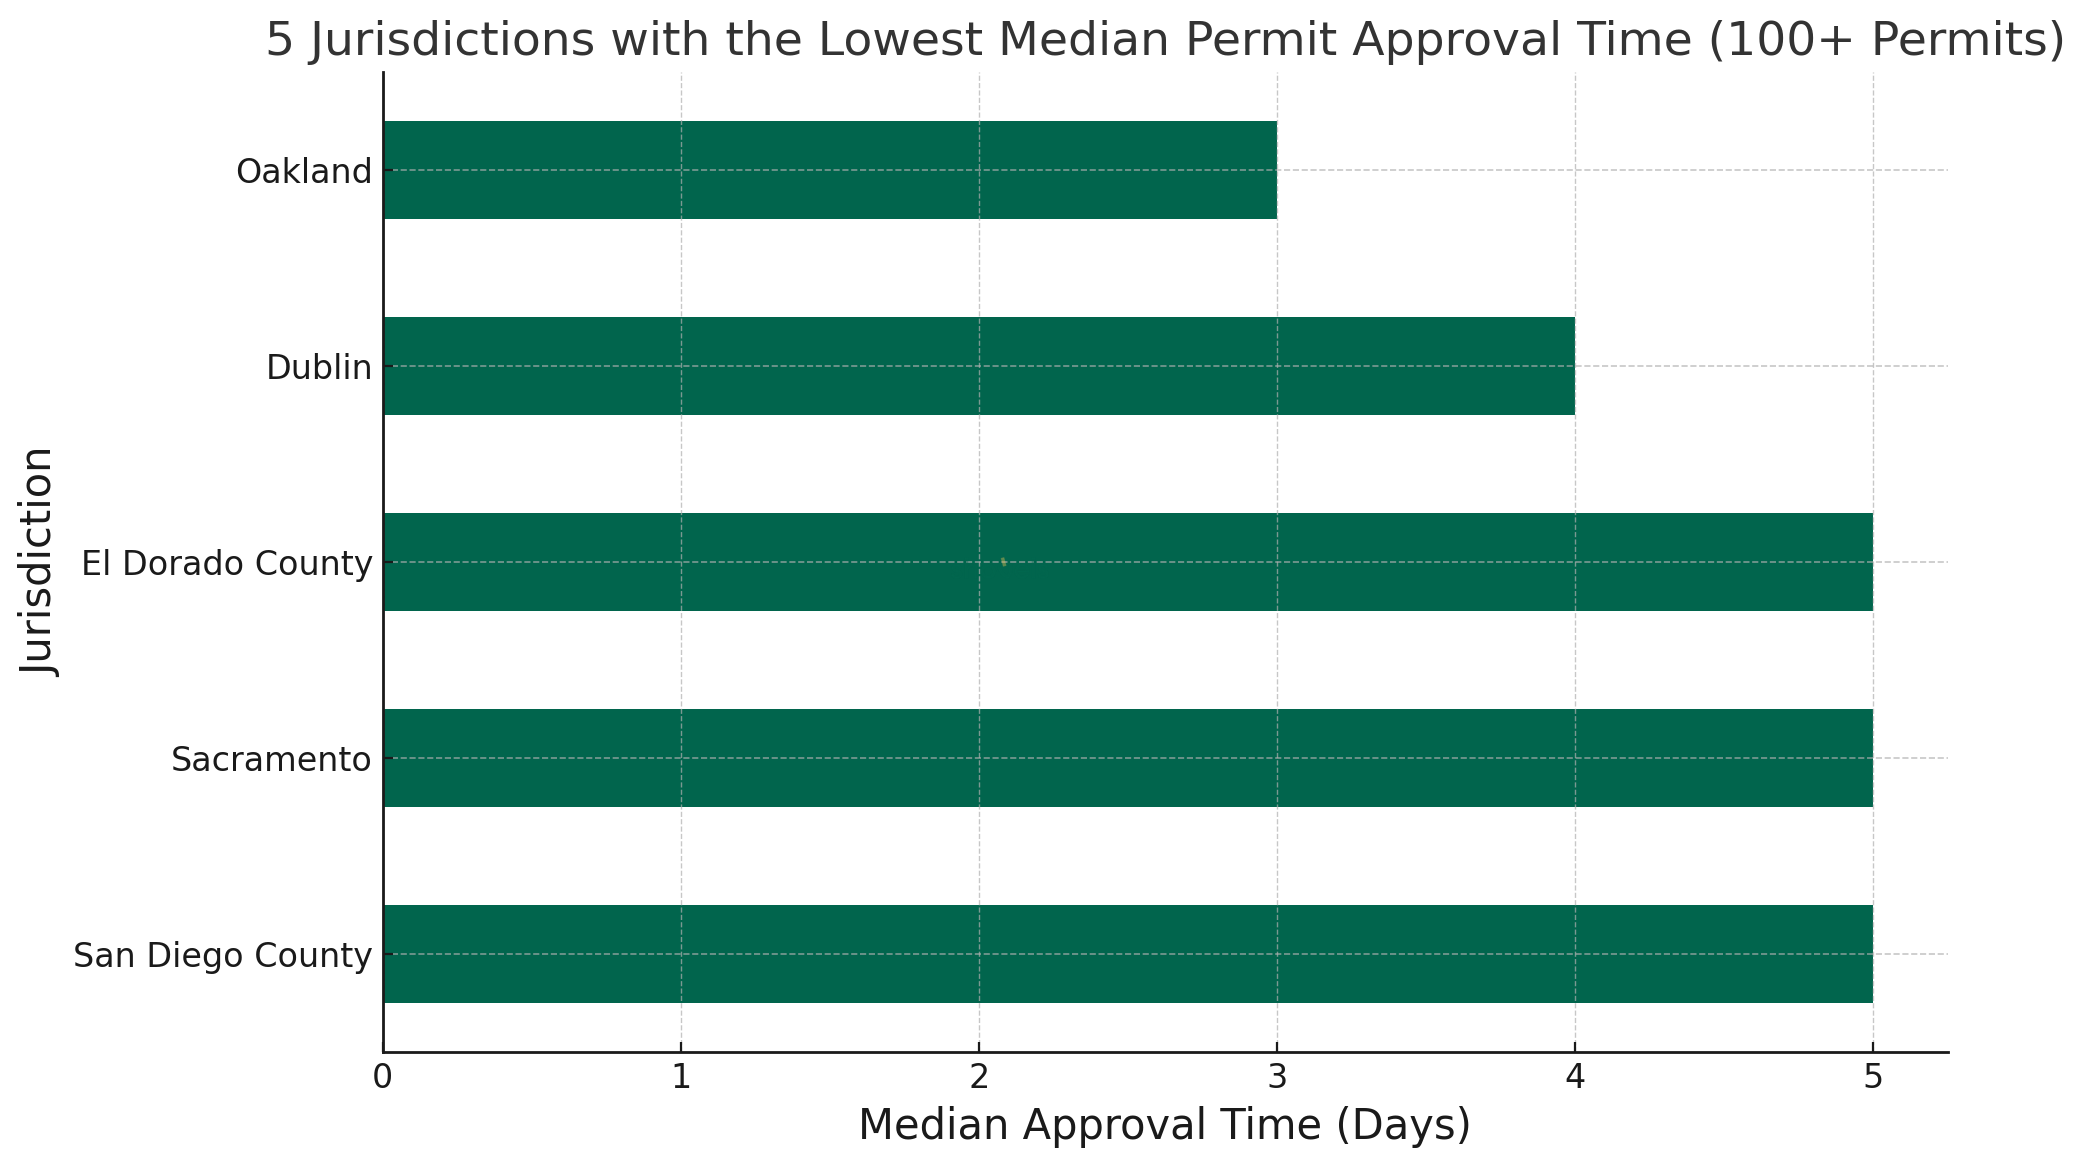
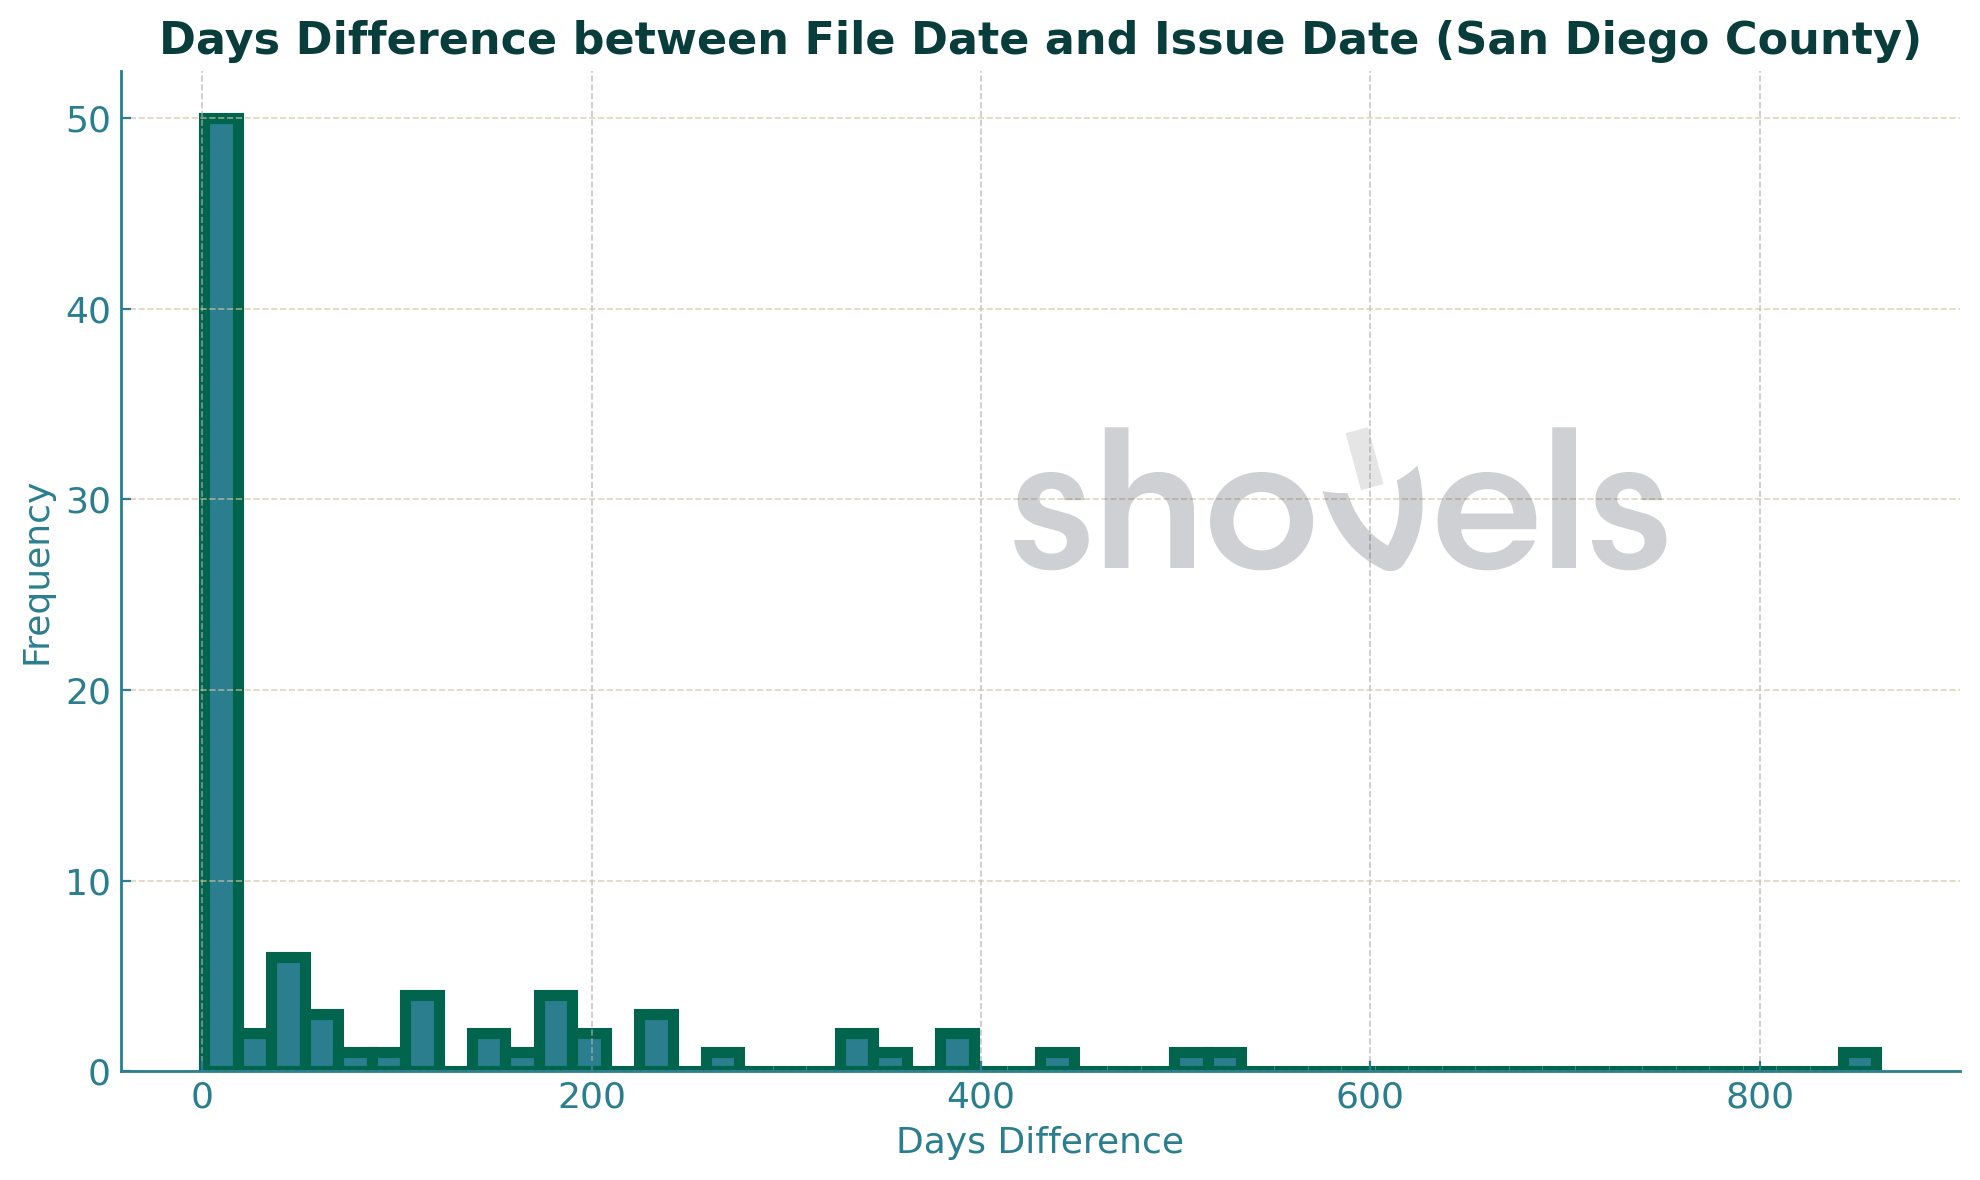
Here again, we see the apparent impact of outliers. San Diego has a media approval time of five days, but an average of three months. A few crazy long wait times down there are pulling the average away from the median.
Just because it was interesting, to further investigate this distinction between Northern California and Southern California, we made one more chart. It tells the story that emerged just by looking at the top 5 and bottom 5 jurisdictions: Northern California issues EV charger permits faster than Southern California.
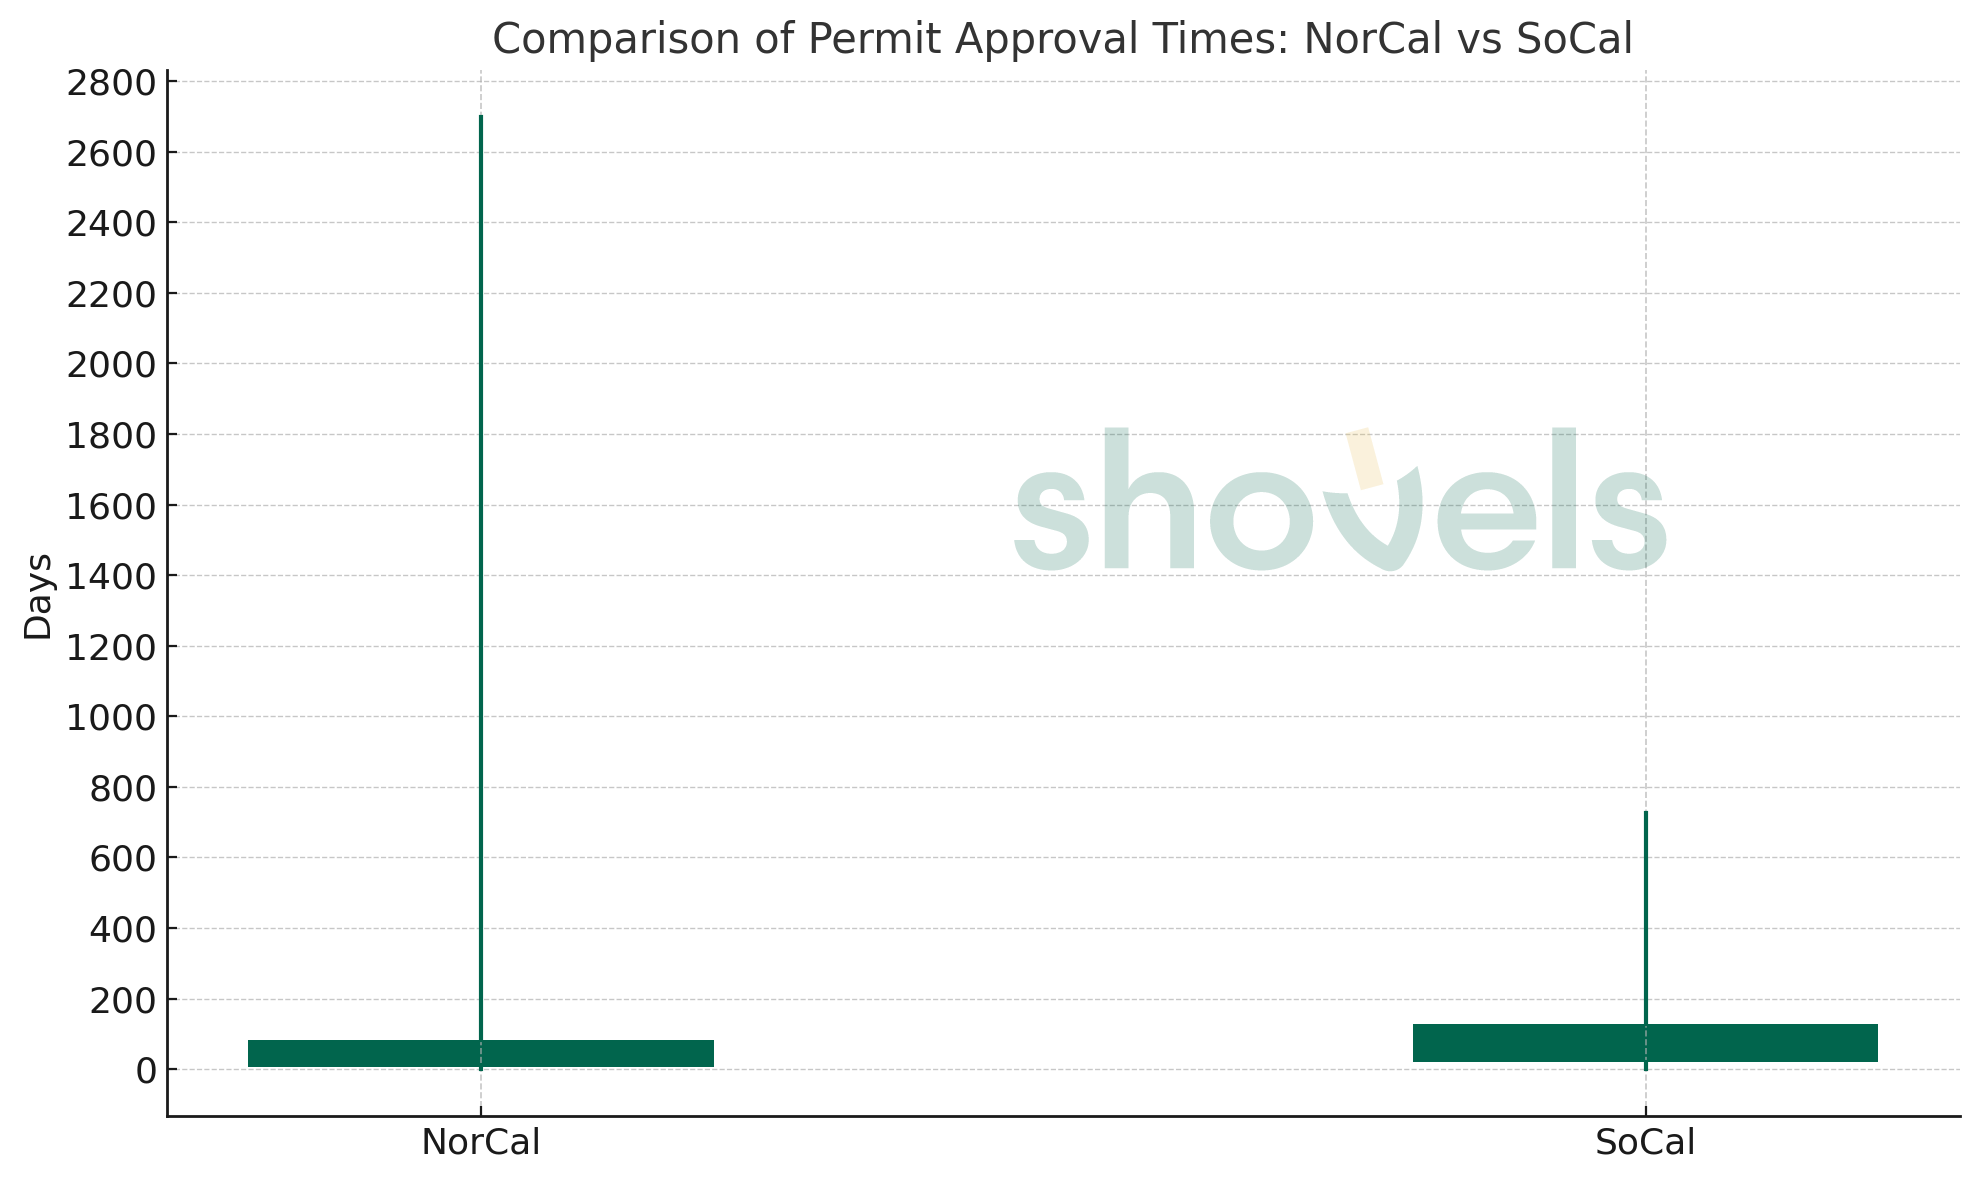
The fatness of the bottom of the candlestick shows the bottom and top quartile wait times. A smaller candle is better.
Trends over time
How has the average EV permit approval time changed over the years for each jurisdiction? Are there any jurisdictions where the approval time is consistently getting faster or slower?
Are there certain times of the year when EV permit approval times are generally faster or slower? This could indicate seasonal workload fluctuations in permit offices.
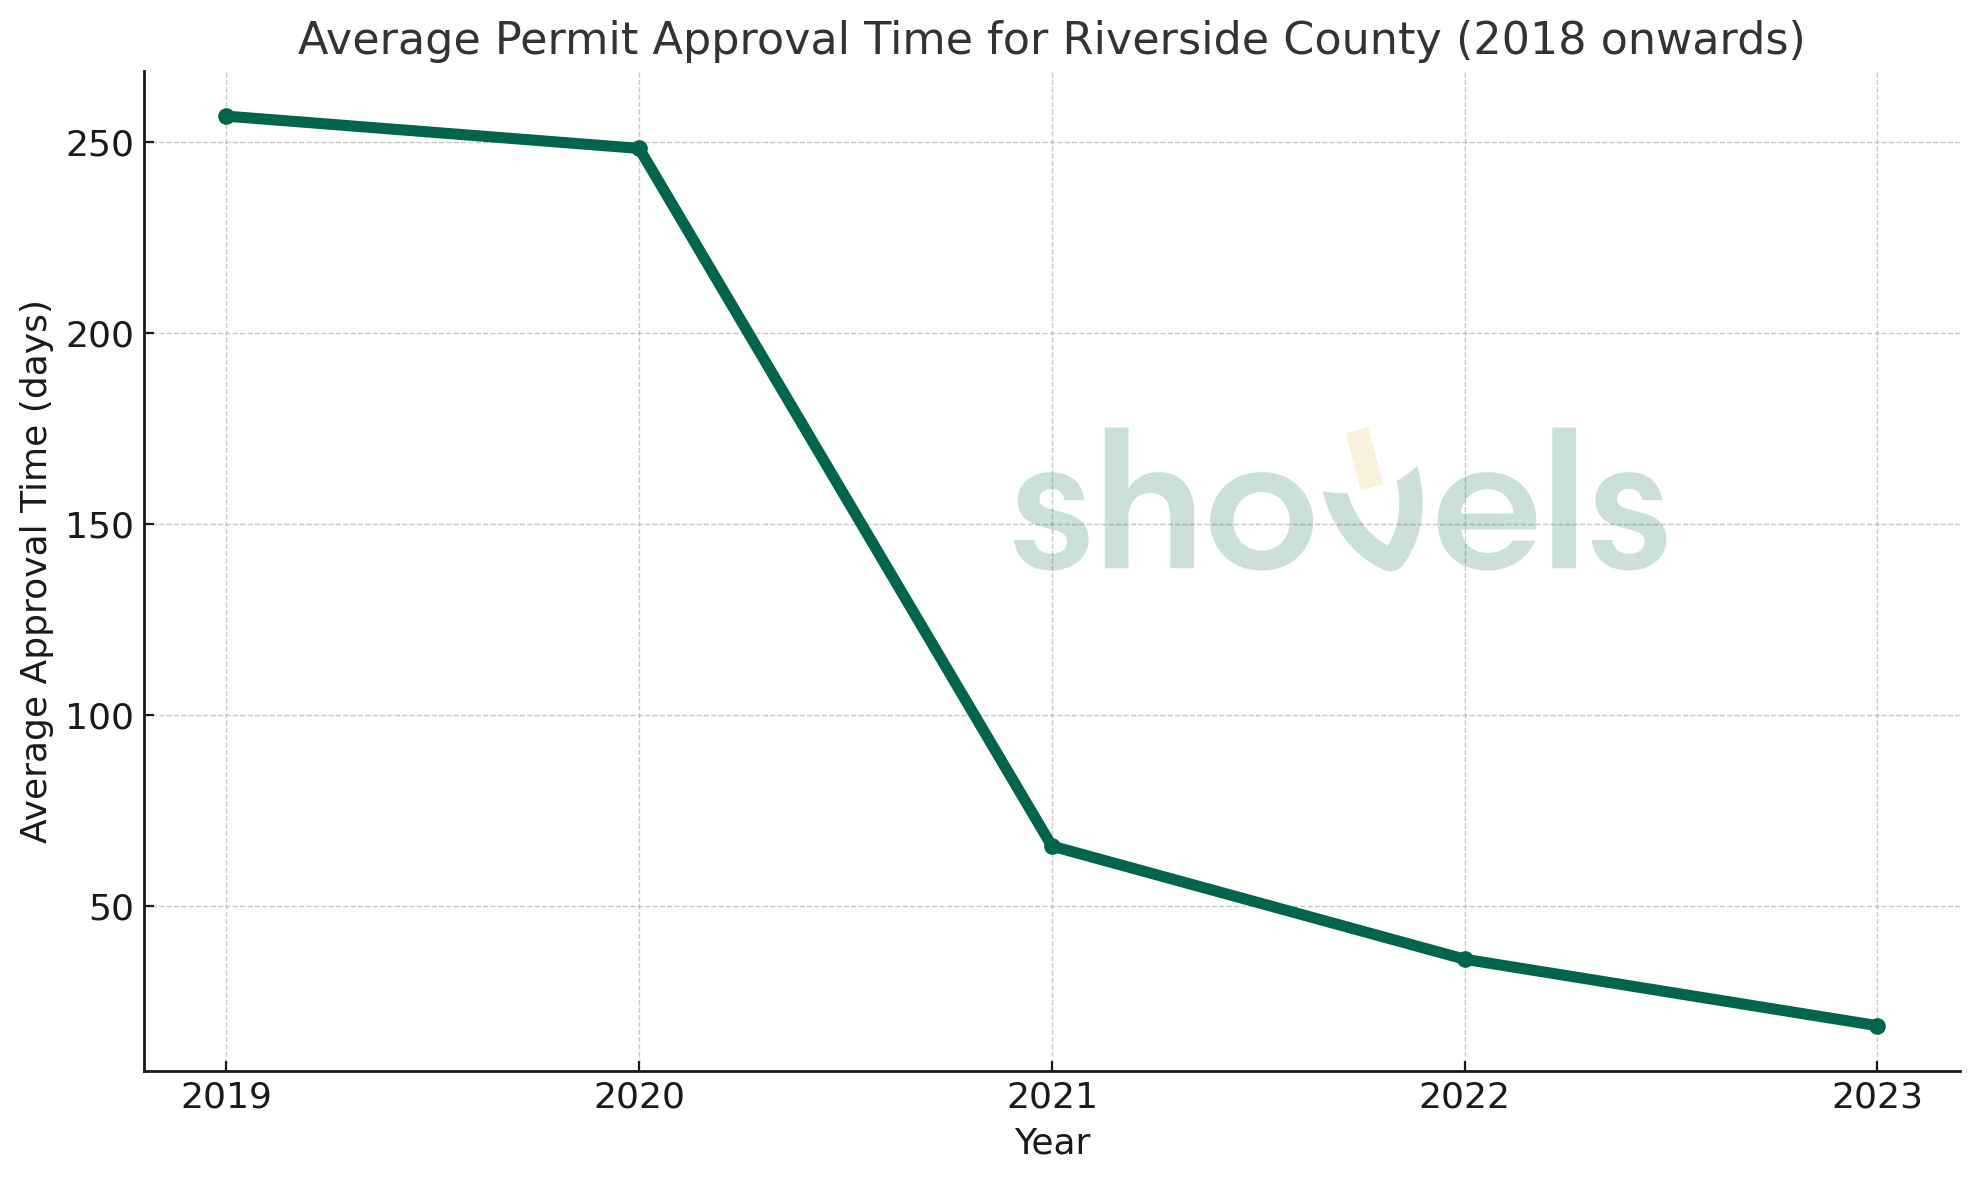
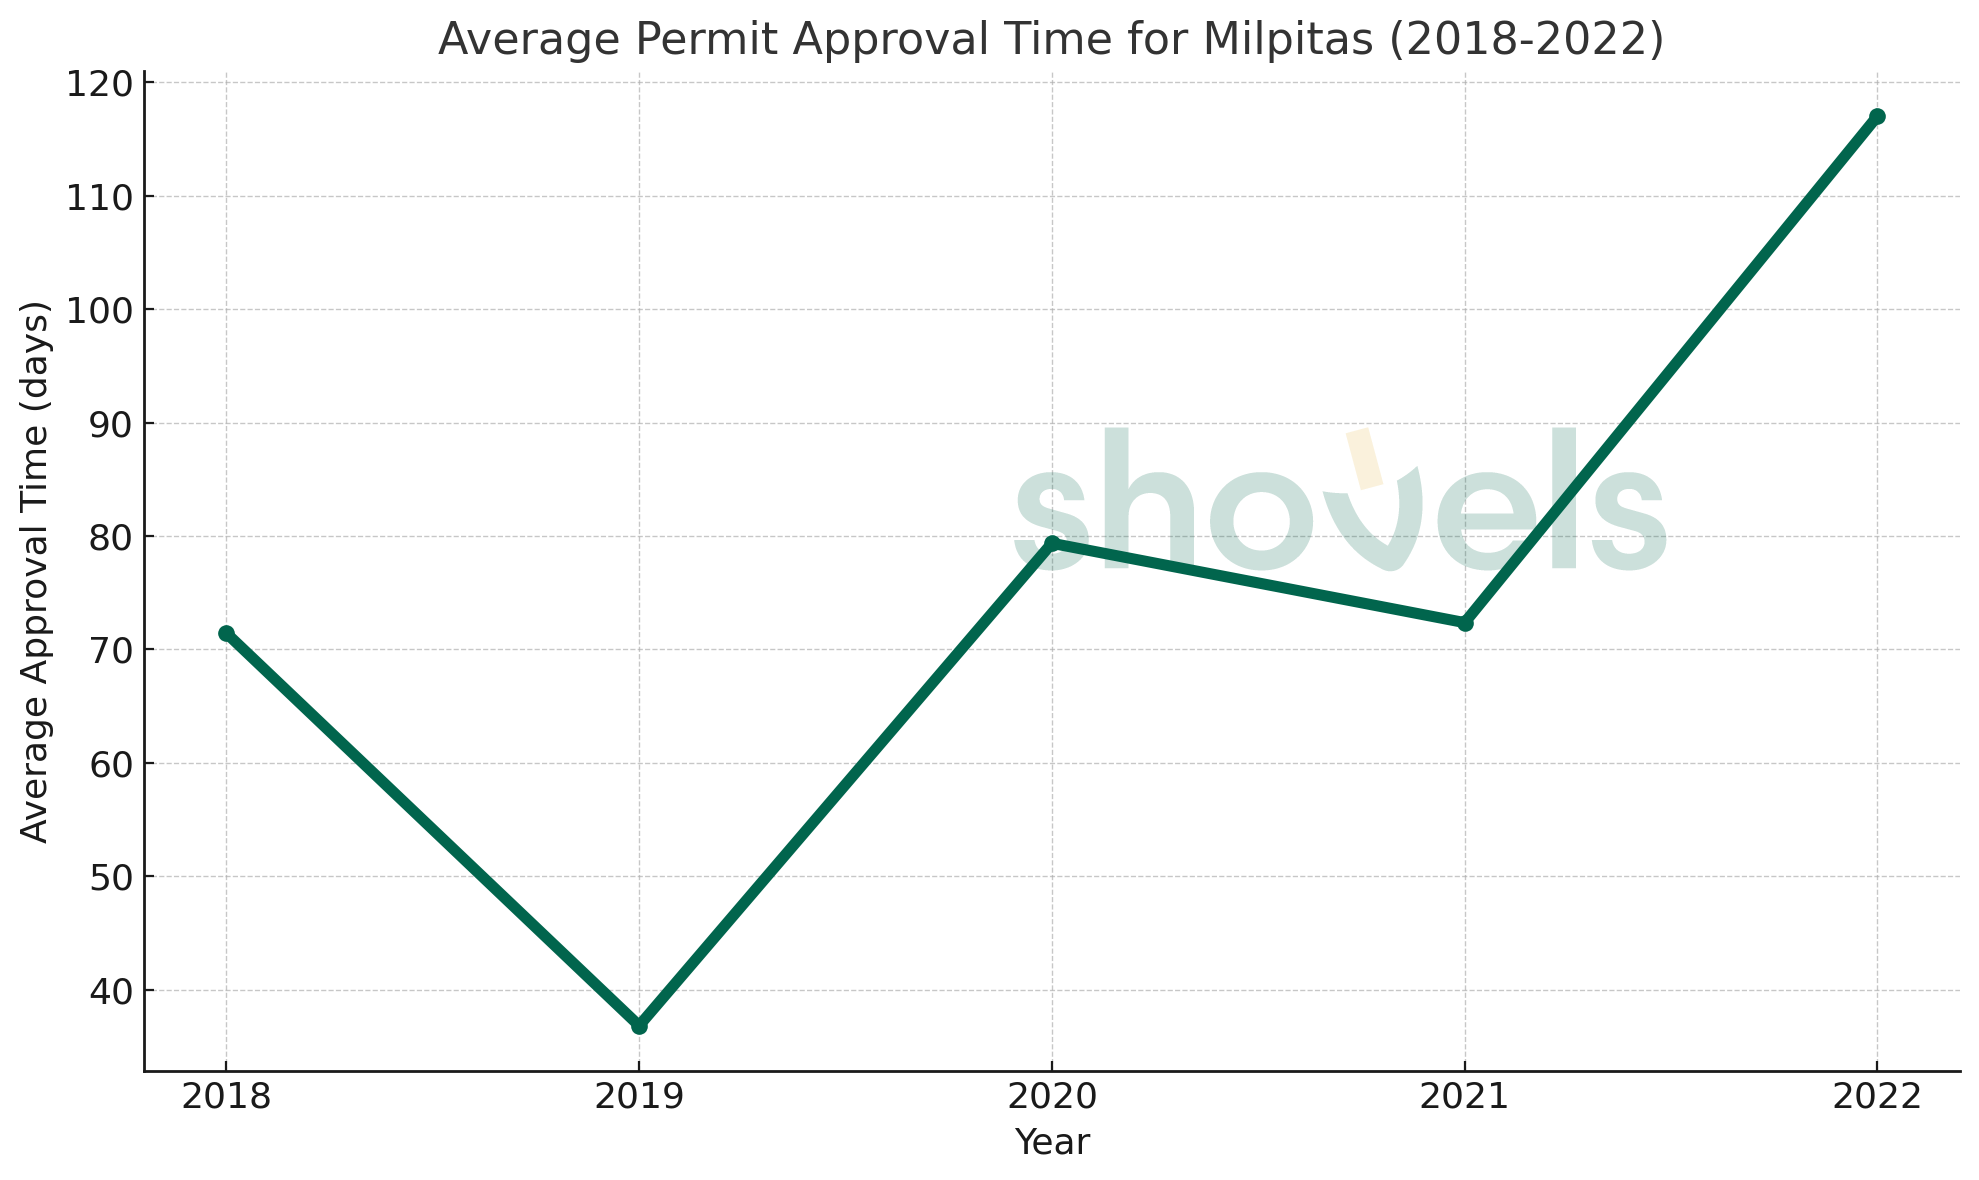
To answer these questions, we looked for jurisdictions where permit approval times are getting worse and others where they are getting better. Bucking the NorCal/SoCal trend described above, we found that permit times are getting better in Riverside County and worse in Milpitas.
The permit counts by year for each county might give some clues as to what's going on.
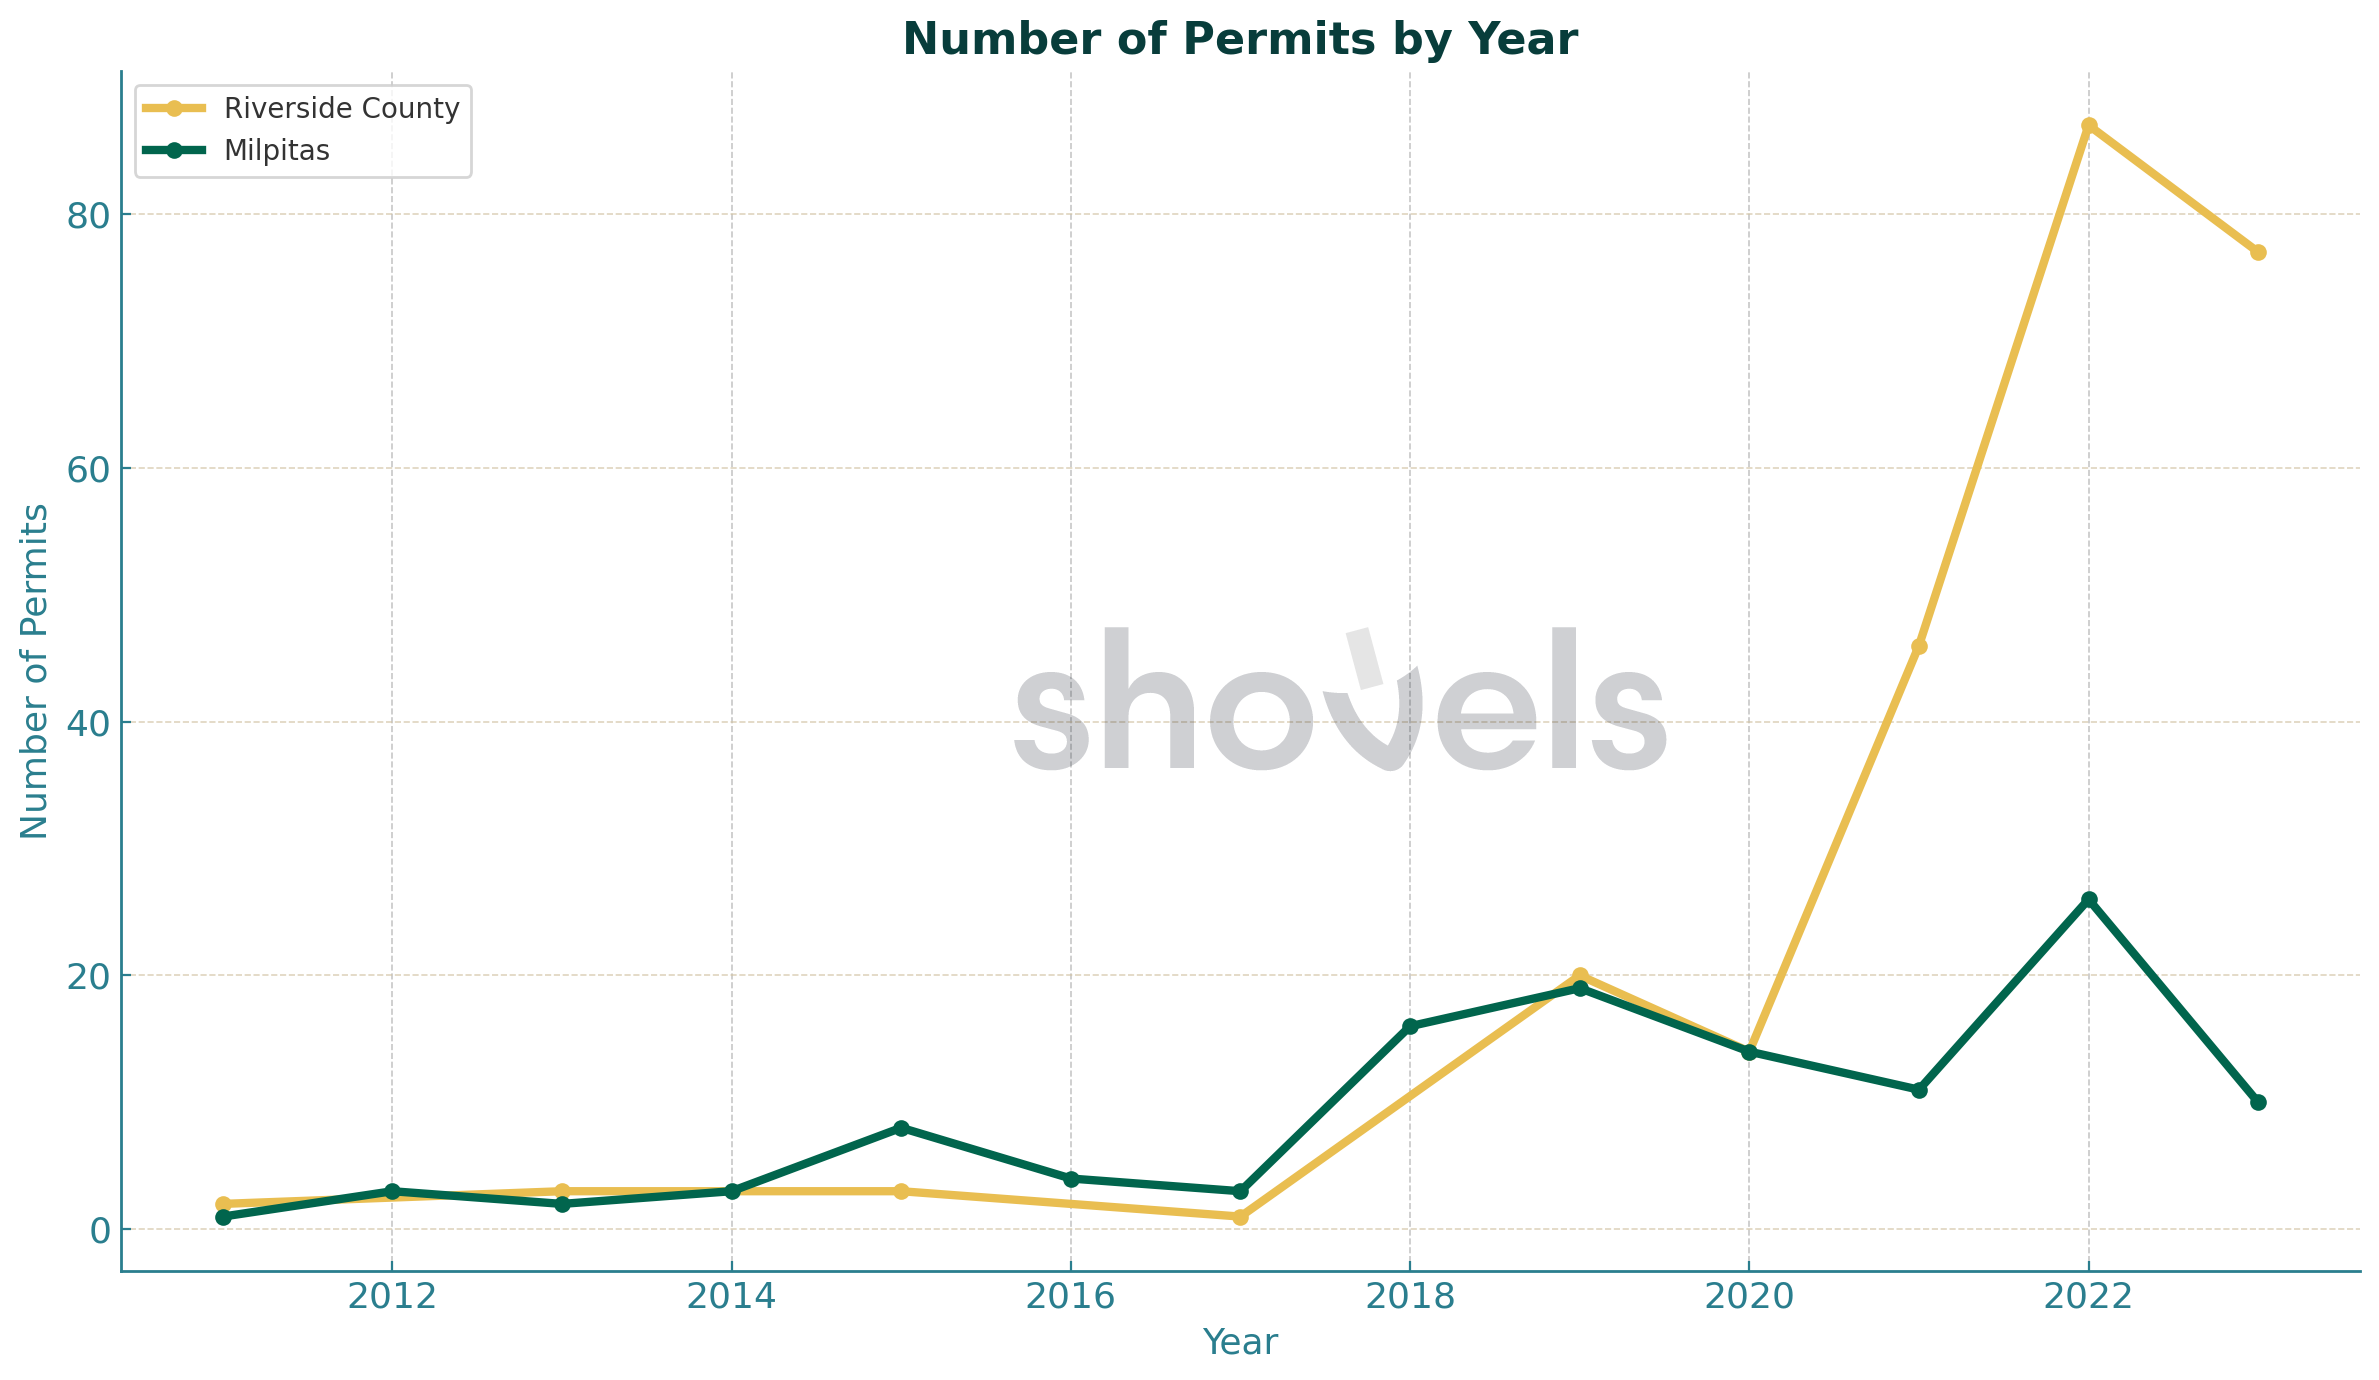
By the looks of these three charts, we find that the number of EV charger permits in Riverside County skyrocketed during the pandemic, and the jurisdiction must have put some permit streamlining reforms in place because despite the higher volume, they kept the processing times down. This combination led to a precipitous drop in permit approval times.
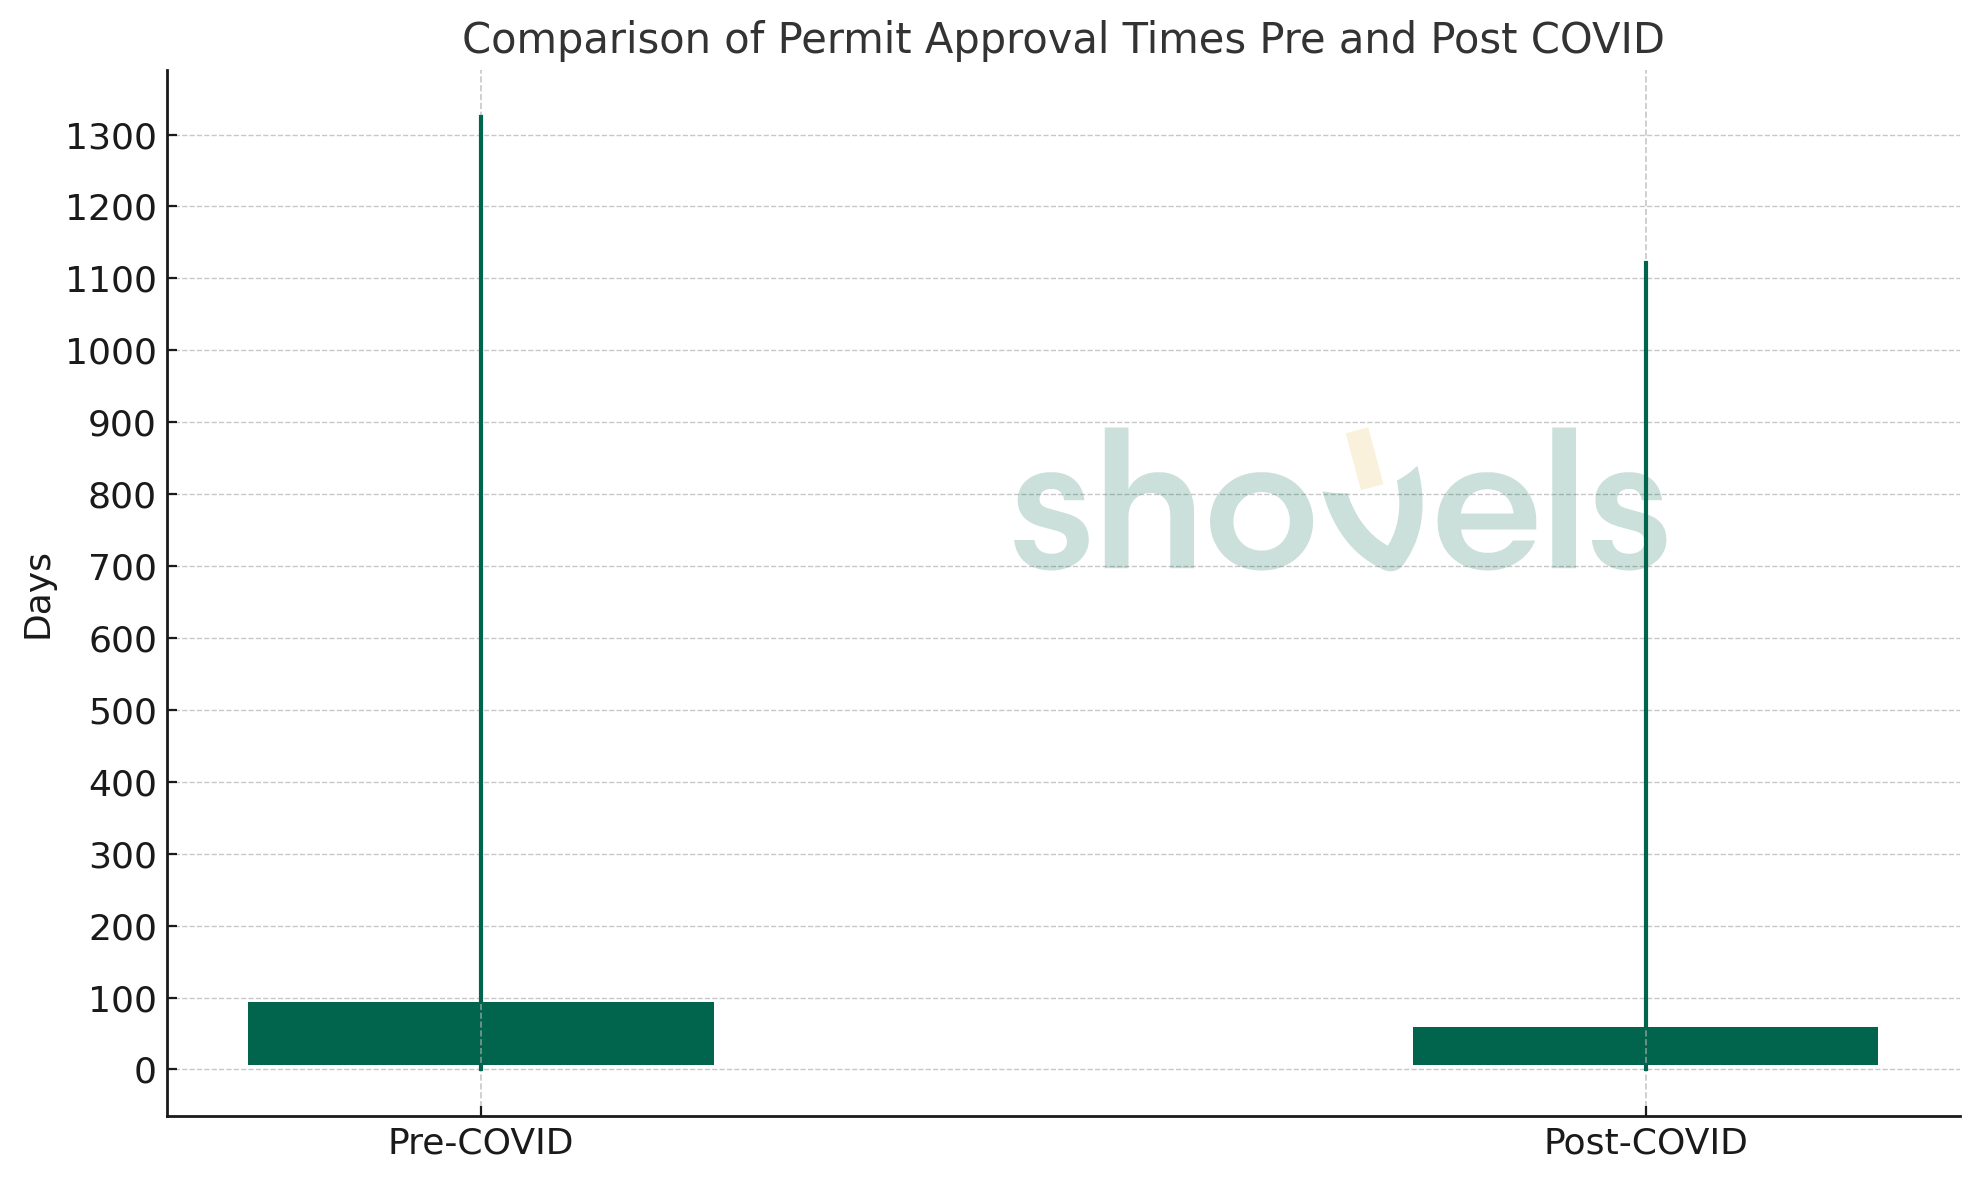
In fact, the COVID question was interesting, so we looked across the board and came up with this chart. The processing times actually improved after COVID.
The relationship between permit volume and approval times
Is there a correlation between the number of permits a jurisdiction processes and the speed of approval? In other words, do jurisdictions that process more EV permits tend to approve them faster or slower?
This result surprised us. We assume that bureaucratic government departments are easily overwhelmed. As the number of permit applications increases, we expect that approval times would get slower. In fact, there's no relationship between the volume of permits and the processing times across the jurisdictions in California.
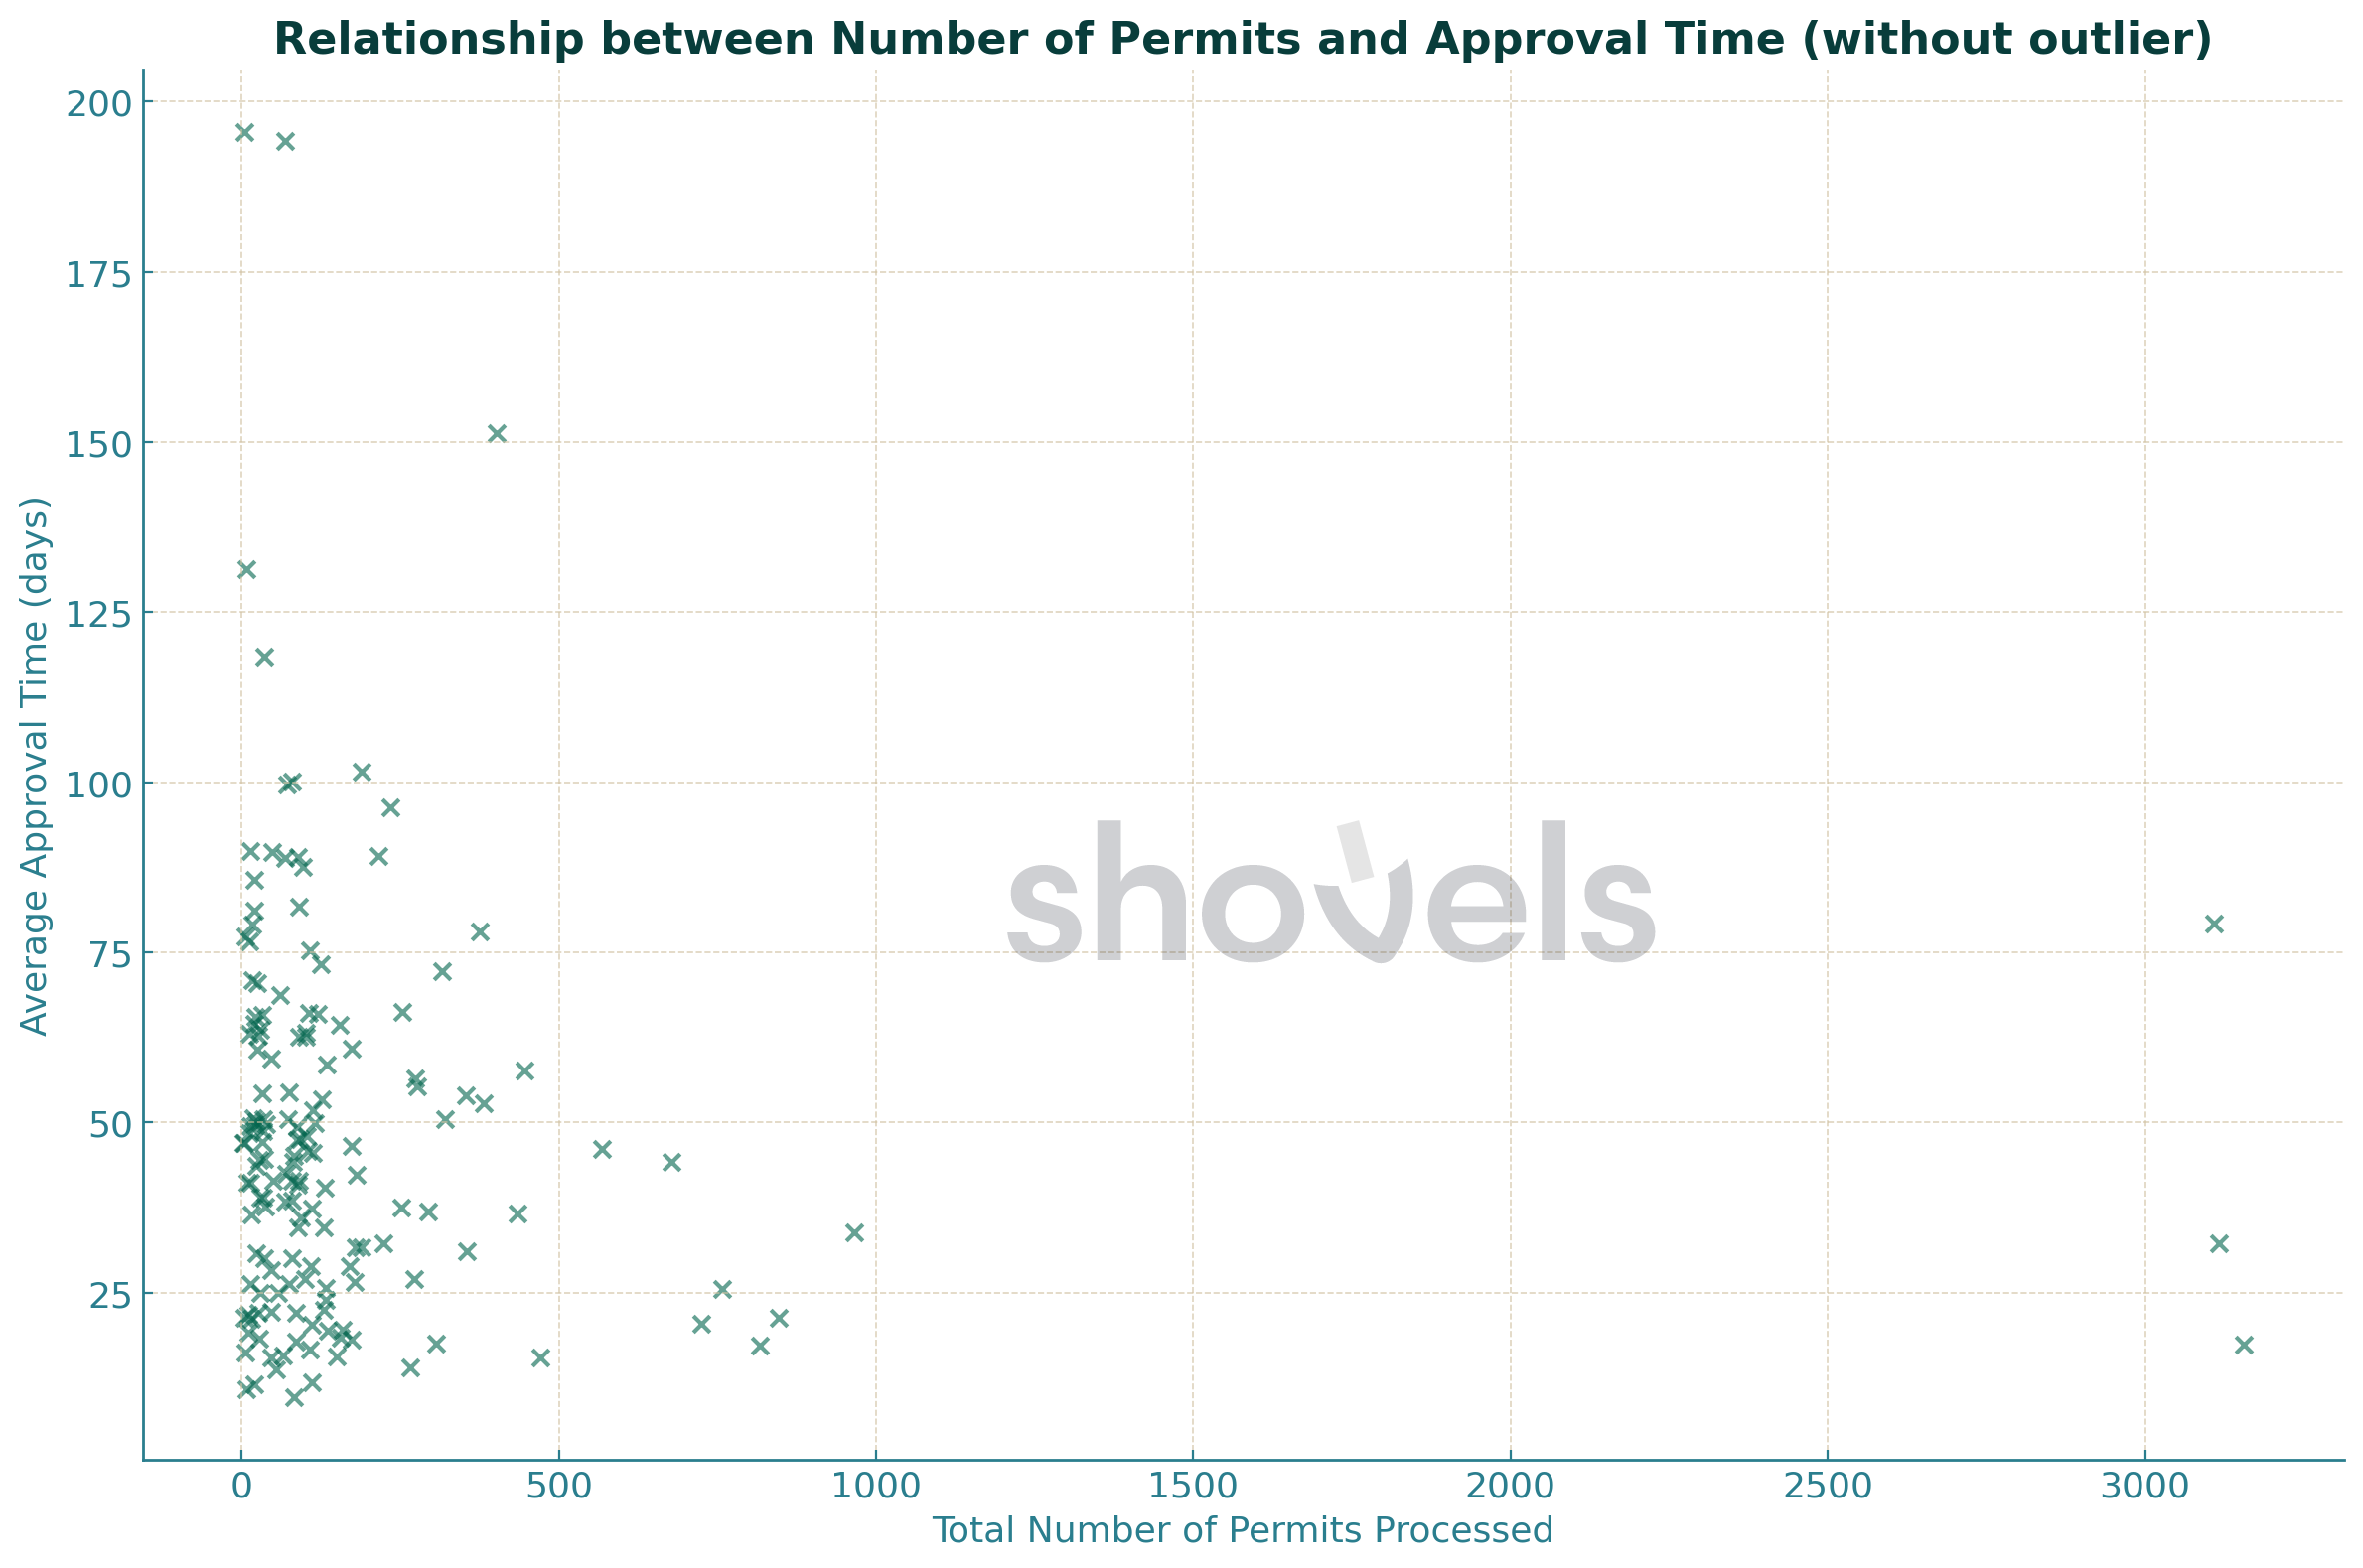
The Pearson correlation coefficient here is −0.0730. This value indicates a very weak negative relationship. In other words, there's actually a slight tendency for jurisdictions that process more EV permits to approve them a bit faster, but the relationship is weak.
Phew! That was a lot of information about EV charger approval times. It seems we're still just scratching the surface. If you want to do more analysis, let us know. We have lots of data.
Frequently Asked Questions
Q: Which California jurisdictions have the fastest EV charger permit approval times?
A: Oakland leads with a median approval time of just 3 days, followed by Dublin (4 days), El Dorado County (5 days), Sacramento (5 days), and San Diego County (5 days). Most of the fastest jurisdictions are in Northern California.
Q: Which California jurisdictions have the slowest EV charger permit approval times?
A: Los Angeles has the slowest median approval time at 93 days, followed by San Francisco (70 days), Santa Ana (64 days), Santa Monica (64 days), and Pasadena (60 days). Four of the five slowest jurisdictions are in Southern California.
Q: Is there a difference in EV charger permit approval times between Northern and Southern California?
A: Yes. The data shows a clear regional pattern: Northern California jurisdictions issue EV charger permits significantly faster than Southern California jurisdictions.
Q: Does processing more permits cause longer approval times?
A: No. The analysis found essentially no correlation between the volume of permits a jurisdiction processes and its approval speed. The Pearson correlation coefficient was -0.073, indicating a very weak relationship. Jurisdictions that handle more permits do not necessarily take longer to approve them.
Q: Did COVID-19 affect EV charger permit approval times in California?
A: Surprisingly, permit processing times actually improved after COVID across California jurisdictions. Some areas like Riverside County saw skyrocketing permit volumes during the pandemic but managed to keep processing times down, suggesting they implemented streamlining reforms.