📊 All data in this index was pulled from Shovels proprietary platform for 2025-Q3 (July 1 - September 30). While we strive for 100% permit coverage, we just aren't there yet for a myriad of reasons. We currently have 85% population coverage and add hundreds of new jurisdictions each month. Dig into our data with a free account and keep an eye on our coverage dashboard.
Welcome to the Shovels Quarterly Permit Index for Q3 2025. Three major trends emerged this quarter: 1) AI data centers are being built at an incredible pace, with Virginia's Loudoun County alone pulling 84 data center related permits—over one third the national total. 2) California continues its renewable energy dominance with 6,764 battery storage permits (74% nationwide). 3) And when you look at where construction is happening most intensely per capita, some surprising states are leading the pack: North Carolina tops the nation at 452 permits per 100K residents, followed by Virginia, Nevada, and Nebraska.
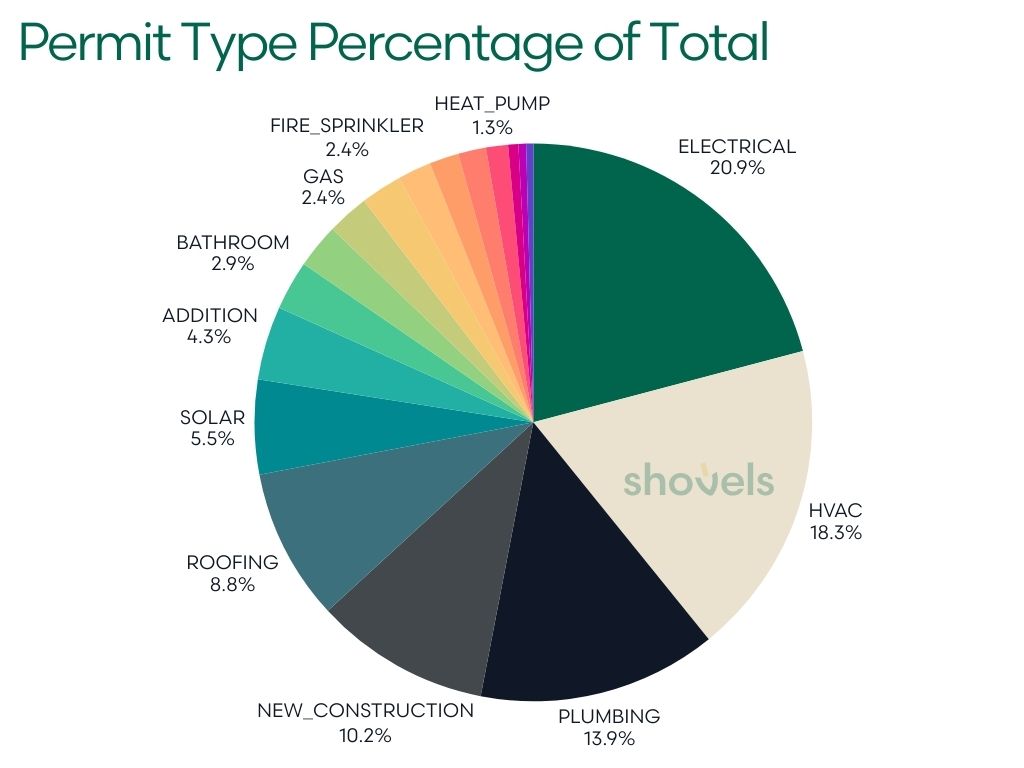
We've also noticed something interesting in what's getting built. Electrical permits (20.9% of activity), HVAC (18.3%), and plumbing (13.9%) are dominating the mix; people are investing in essential infrastructure and systems upgrades, not just cosmetic improvements.
In this report, you'll find deep dives into data center construction, EV charging infrastructure, battery storage deployment, regional building patterns, and the contractors winning market share in key categories. Whether you're a builder trying to spot opportunities, an investor tracking capital flows, or just someone curious about where America is building, we think you'll find something valuable here.
Let's dig in.
2025-Q3: The Big Picture
Q3 2025 presents a interesting snapshot of America's construction industry navigating a period of recalibration. Shovels recorded a total of 515,912 permits during the quarter. For clarity, Q3 contains permits with an ISSUE_DATE BETWEEN '2025-06-01' AND '2025-09-30'. Learn more about permit statuses and timelines.
What we glean is an industry adjusting to higher interest rates, ongoing labor constraints, and increased materials costs while maintaining focus on essential infrastructure and strategic development. Of the 515,912 permits issued in Q3, here's the breakdown by status:

| STATUS | COUNT | PERCENT | DETAIL |
|---|---|---|---|
| Active | 433,036 | 83.94% | Represents ongoing or in-progress permits. Higher this quarter compared to Q2. |
| Final | 74,343 | 14.41% | Indicates permits that have been fully processed and closed. |
| In Review | 4,342 | 0.84% | Permits currently being evaluated. |
| Null Status | 3,467 | 0.67% | No status assigned. |
| Inactive | 723 | 0.14% | Likely stagnant, cancelled or abandoned permits. |
The shift toward active permits (84% vs. Q2's 58%) suggests projects are taking longer to complete, possibly due to labor constraints or increased project complexity.
Permit Types: Infrastructure Takes Center Stage
Q3 2025 reveals a clear priority shift toward essential building systems and infrastructure. The top five permit categories evoke an industry focused on core functionality and critical upgrades.

| PERMIT_TYPE | TOTAL_PERMITS | % OF TOTAL | MEDIAN_PROCESSING_DAYS |
|---|---|---|---|
| Electrical | 81,230 | 20.9% | 5 |
| HVAC | 71,148 | 18.3% | 1 |
| Plumbing | 53,901 | 13.9% | 10 |
| New Construction | 39,524 | 10.2% | 30 |
| Roofing | 34,260 | 8.8% | 5 |
Note: we excluded the "unknown" permit category.
🔌 Key Insights:
- Electrical Dominance: Leading at 21% of all permit activity, electrical permits continue to signal America's infrastructure modernization, supporting everything from EV charging to data center expansion.
- Essential Systems Priority: The trifecta of electrical, HVAC, and plumbing represents 53% of all permits, emphasizing critical infrastructure over discretionary projects.
- Processing Efficiency: Most essential systems show impressive median turnaround times: HVAC (1 day), electrical (5 days), and roofing (5 days), while complex projects like new construction (30 days) and ADUs (90 days) require more review.
- Emerging Technologies: Solar permits (6%, 21,326 total) and heat pumps (1%, 4,969 total) maintain steady presence despite policy headwinds, while battery storage shows steady regional growth.
- Adaptive Spaces: ADUs (3%, 10,040 permits) and additions (4%, 16,608 permits) demonstrate continued demand for flexible housing solutions. Learn more about ADU permits: America's ADU Boom: What 2.8 Million Permits Reveal About the Housing Solution
Regional Distribution: Sunbelt Strength Persists
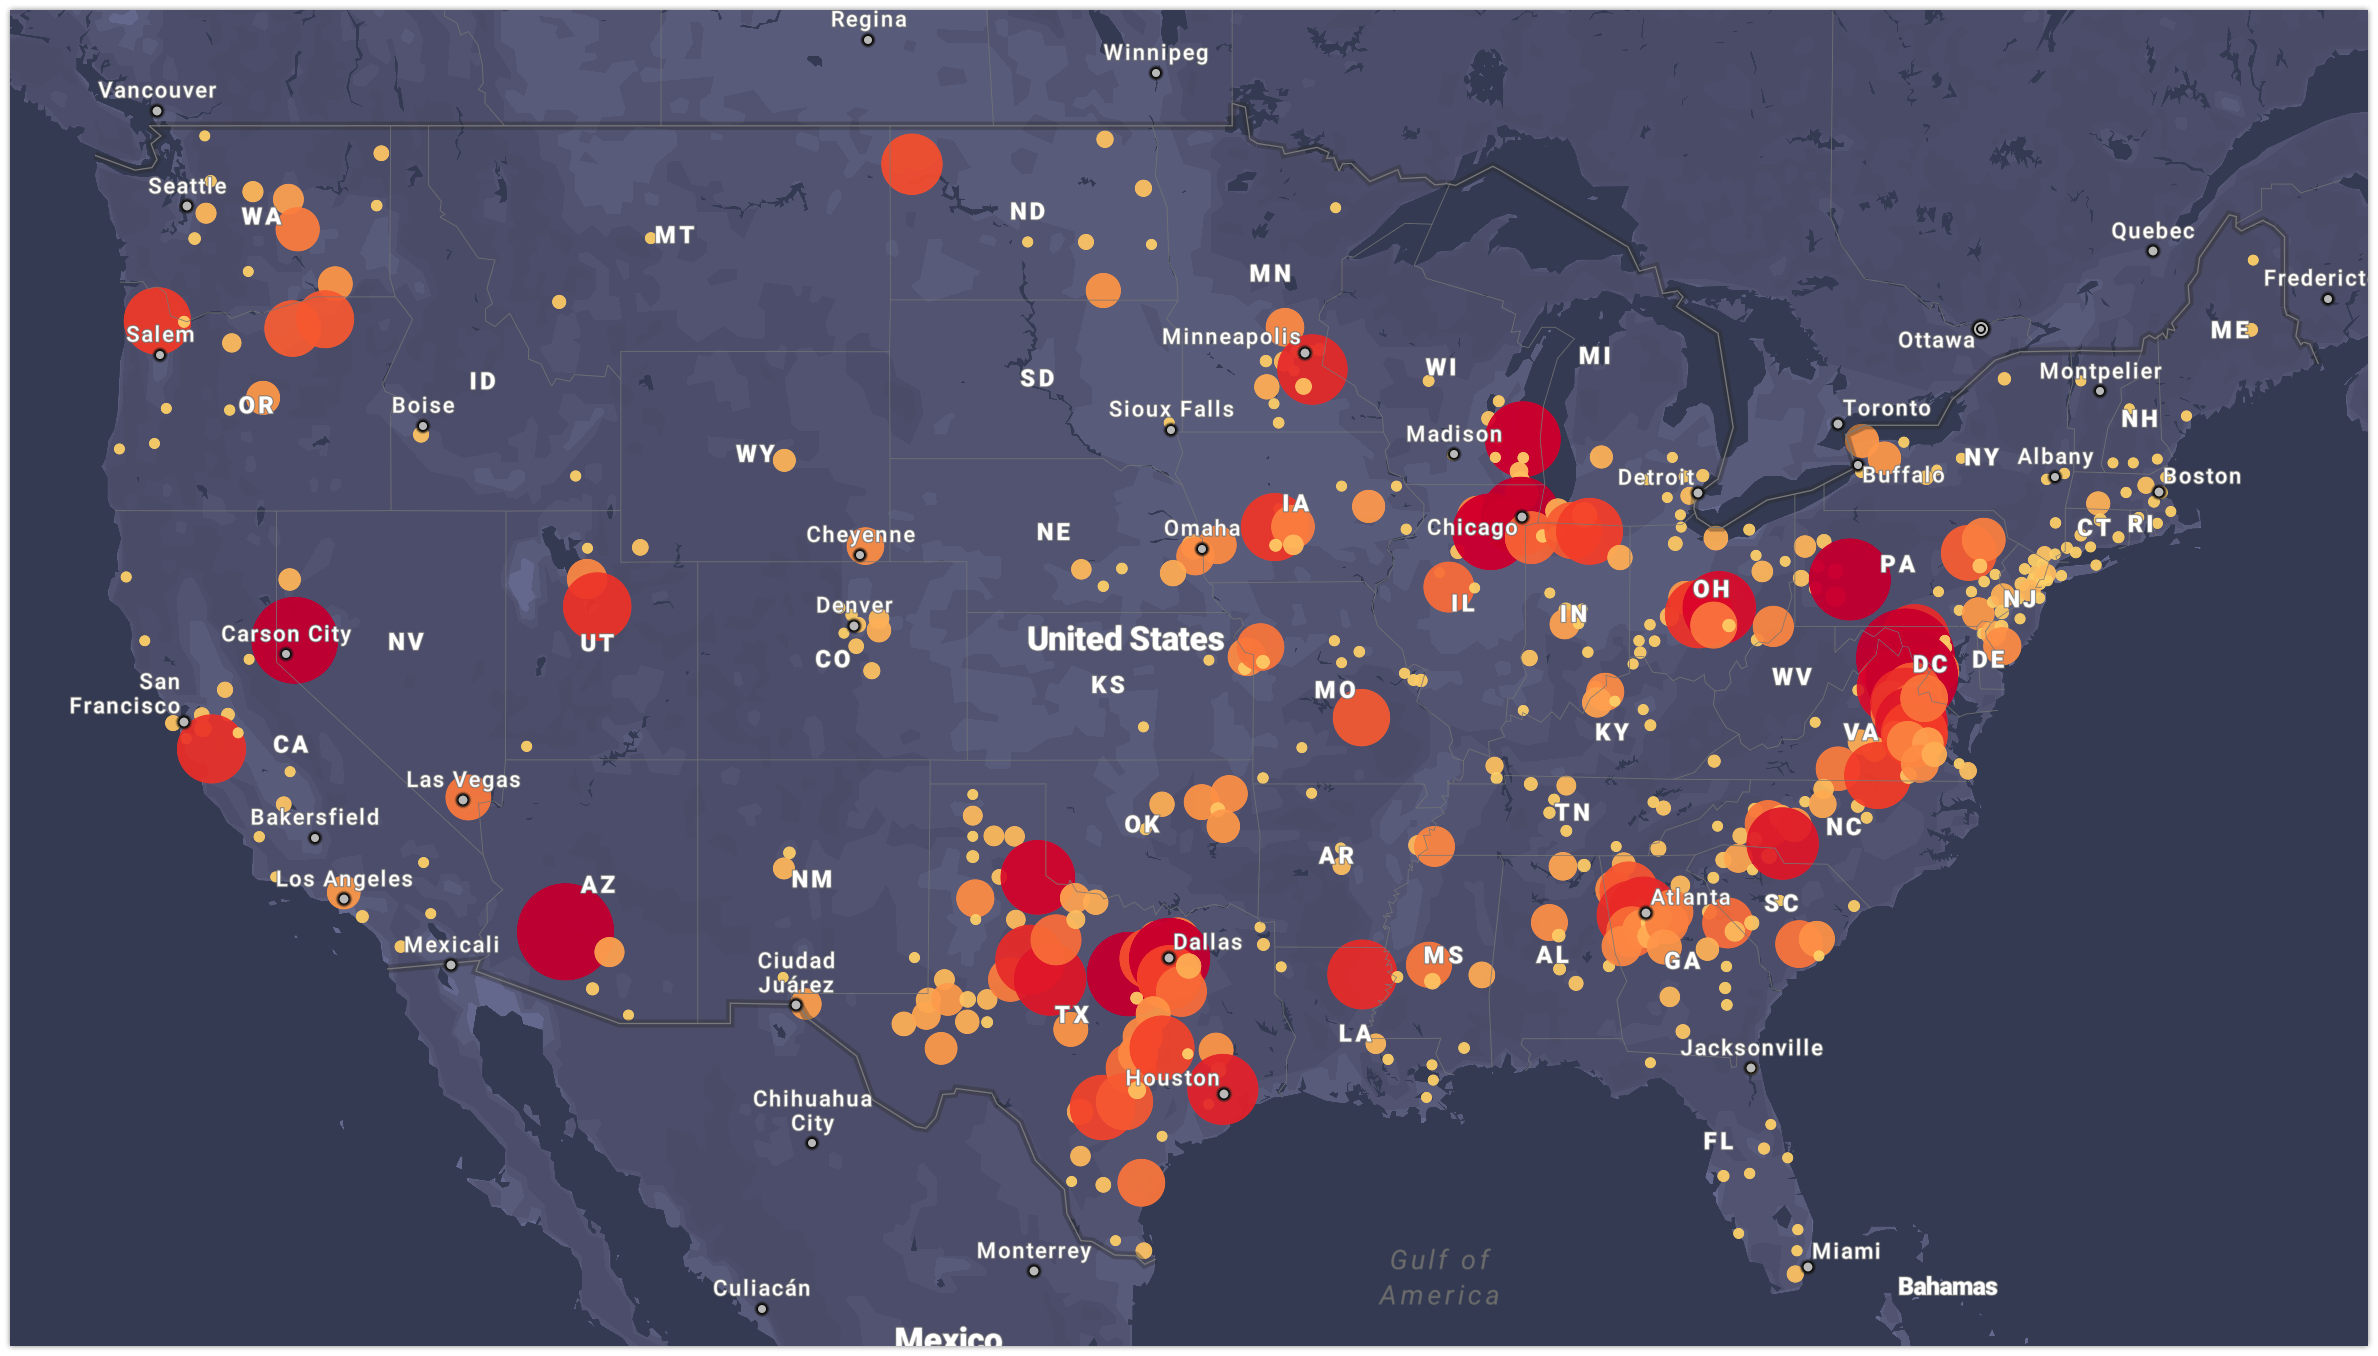
The geographic concentration of permit activity remains stable, with familiar leaders maintaining dominance. California, Florida, Texas, and North Carolina collectively account for 54% of all national permits, demonstrating the persistent concentration of construction activity in these major markets.
📍Interactive map:
| STATE | % OF_TOTAL_PERMITS | STATE_RANK |
|---|---|---|
| California | 16.67 | 1 |
| Florida | 15.58 | 2 |
| Texas | 11.7 | 3 |
| North Carolina | 9.68 | 4 |
| Virginia | 6.71 | 5 |
| Washington | 4 | 6 |
| Colorado | 3.08 | 7 |
| Georgia | 3 | 8 |
| Missouri | 2.28 | 9 |
| Nevada | 2.23 | 10 |
Per Capita Perspective: Where Construction Intensity Really Lives
While absolute permit counts reveal market size, per capita analysis exposes the true construction intensity, showing which states are building relative to their population. The rankings shift when adjusting for population, revealing a different story about America's most active construction markets.
| STATE | POPULATION* | PERMITS_PER_100K_RESIDENTS | RANK |
|---|---|---|---|
| North Carolina | 11,046,024 | 452.31 | 1 |
| Virginia | 8,811,195 | 392.97 | 2 |
| Nevada | 3,267,467 | 352.41 | 3 |
| Nebraska | 2,005,465 | 344.51 | 4 |
| Florida | 23,372,215 | 343.99 | 5 |
| South Dakota | 924,669 | 339.15 | 6 |
| Colorado | 5,957,493 | 267.06 | 7 |
| Washington | 7,958,180 | 259.28 | 8 |
| California | 39,431,263 | 218.11 | 9 |
| Texas | 31,290,831 | 192.9 | 10 |
* Source: United States Census Bureau, Population Division. https://www.census.gov/data/tables/time-series/demo/popest/2020s-state-total.html
📊 Key Insights:
North Carolina Dominates Across Every Metric: At 452 permits per 100K residents, North Carolina isn't just the fourth-largest market by absolute permits, it's the nation's most construction-intensive state. This double dominance (ranked #4 in total permits, #1 per capita) reflects streamlined permitting processes, robust population growth, and strong economic fundamentals attracting both residential and commercial development.
Small States Punch Above Their Weight: Nebraska (#4 per capita, #19 by total), South Dakota (#6 per capita, #28 by total), and Nevada (#3 per capita, #12 by total) demonstrate that construction intensity doesn't require massive population centers. These states' high per-capita rankings suggest migration-driven growth, favorable business climates, and efficient permitting environments that attract disproportionate development.
The Sunbelt Giants Retain Strength: Florida (#5 per capita, #1 by total) and Texas (#10 per capita, #2 by total) maintain top-10 positions in both rankings, showcasing sustained construction momentum driven by population growth, corporate relocations, and climate-driven replacement cycles. California (#9 per capita, #3 by total) similarly shows balanced strength across both metrics.
Virginia's Data Center Effect: Virginia's #2 per capita ranking (393 per 100K)—far exceeding its #5 position in absolute permits—reveals the outsized impact of data center development in Loudoun and Fairfax counties. While these projects represent relatively few permits, their complexity and economic scale dramatically elevate Virginia's construction intensity.
The Missing Megastates: New York (#45 per capita, 7.58 per 100K despite 1,506 total permits) and Pennsylvania (#50 per capita, 2.32 per 100K despite 303 permits) reveal mature, slower-growth markets where construction activity lags far behind population size. These states' regulatory complexity, high costs, and established building stock reduce relative construction intensity compared to growth-oriented Sunbelt and Western markets.
Note: This likely also reflects our data coverage. Gathering permit data from Northeastern AHJs presents unique difficulties due to fragmented systems and varying digitization levels—some of which remain offline, making comprehensive data collection challenging. We are working on it!
Regional Construction Cultures Emerge: The per capita rankings reveal distinct regional construction patterns: the Southeast (NC, VA, SC, GA) demonstrates permitting efficiency and growth accommodation, the Interior West (NV, CO, ID, WY) shows migration-driven intensity, and the Midwest (NE, SD, MO, IA) reflects steady, population-proportionate development. Meanwhile, legacy metros in the Northeast and industrial Midwest show significantly lower construction intensity relative to population.
This per capita perspective matters for market positioning. For contractors, it reveals where competition for projects is most intense (NC, VA, NV) versus where opportunities may exist relative to market size. For suppliers, high per-capita states represent concentrated demand requiring strategic inventory positioning. For investors and policymakers, these rankings illuminate which states have created regulatory and economic environments that facilitate construction at scale, offering playbooks for regions seeking to accelerate development.
Data Center Boom: The AI Infrastructure Gold Rush
Source: U.S. Department of Energy data center map - planned, operating, or in construction. https://maps.nrel.gov/speed-to-power/data-viewer/data-library/
Global data center demand is expected to triple by 2030, with Artificial Intelligence (AI) workloads driving nearly 70 percent of this demand. AI is increasingly seen as a technology that will influence geopolitics, reorder the global economy, and transform human lives.
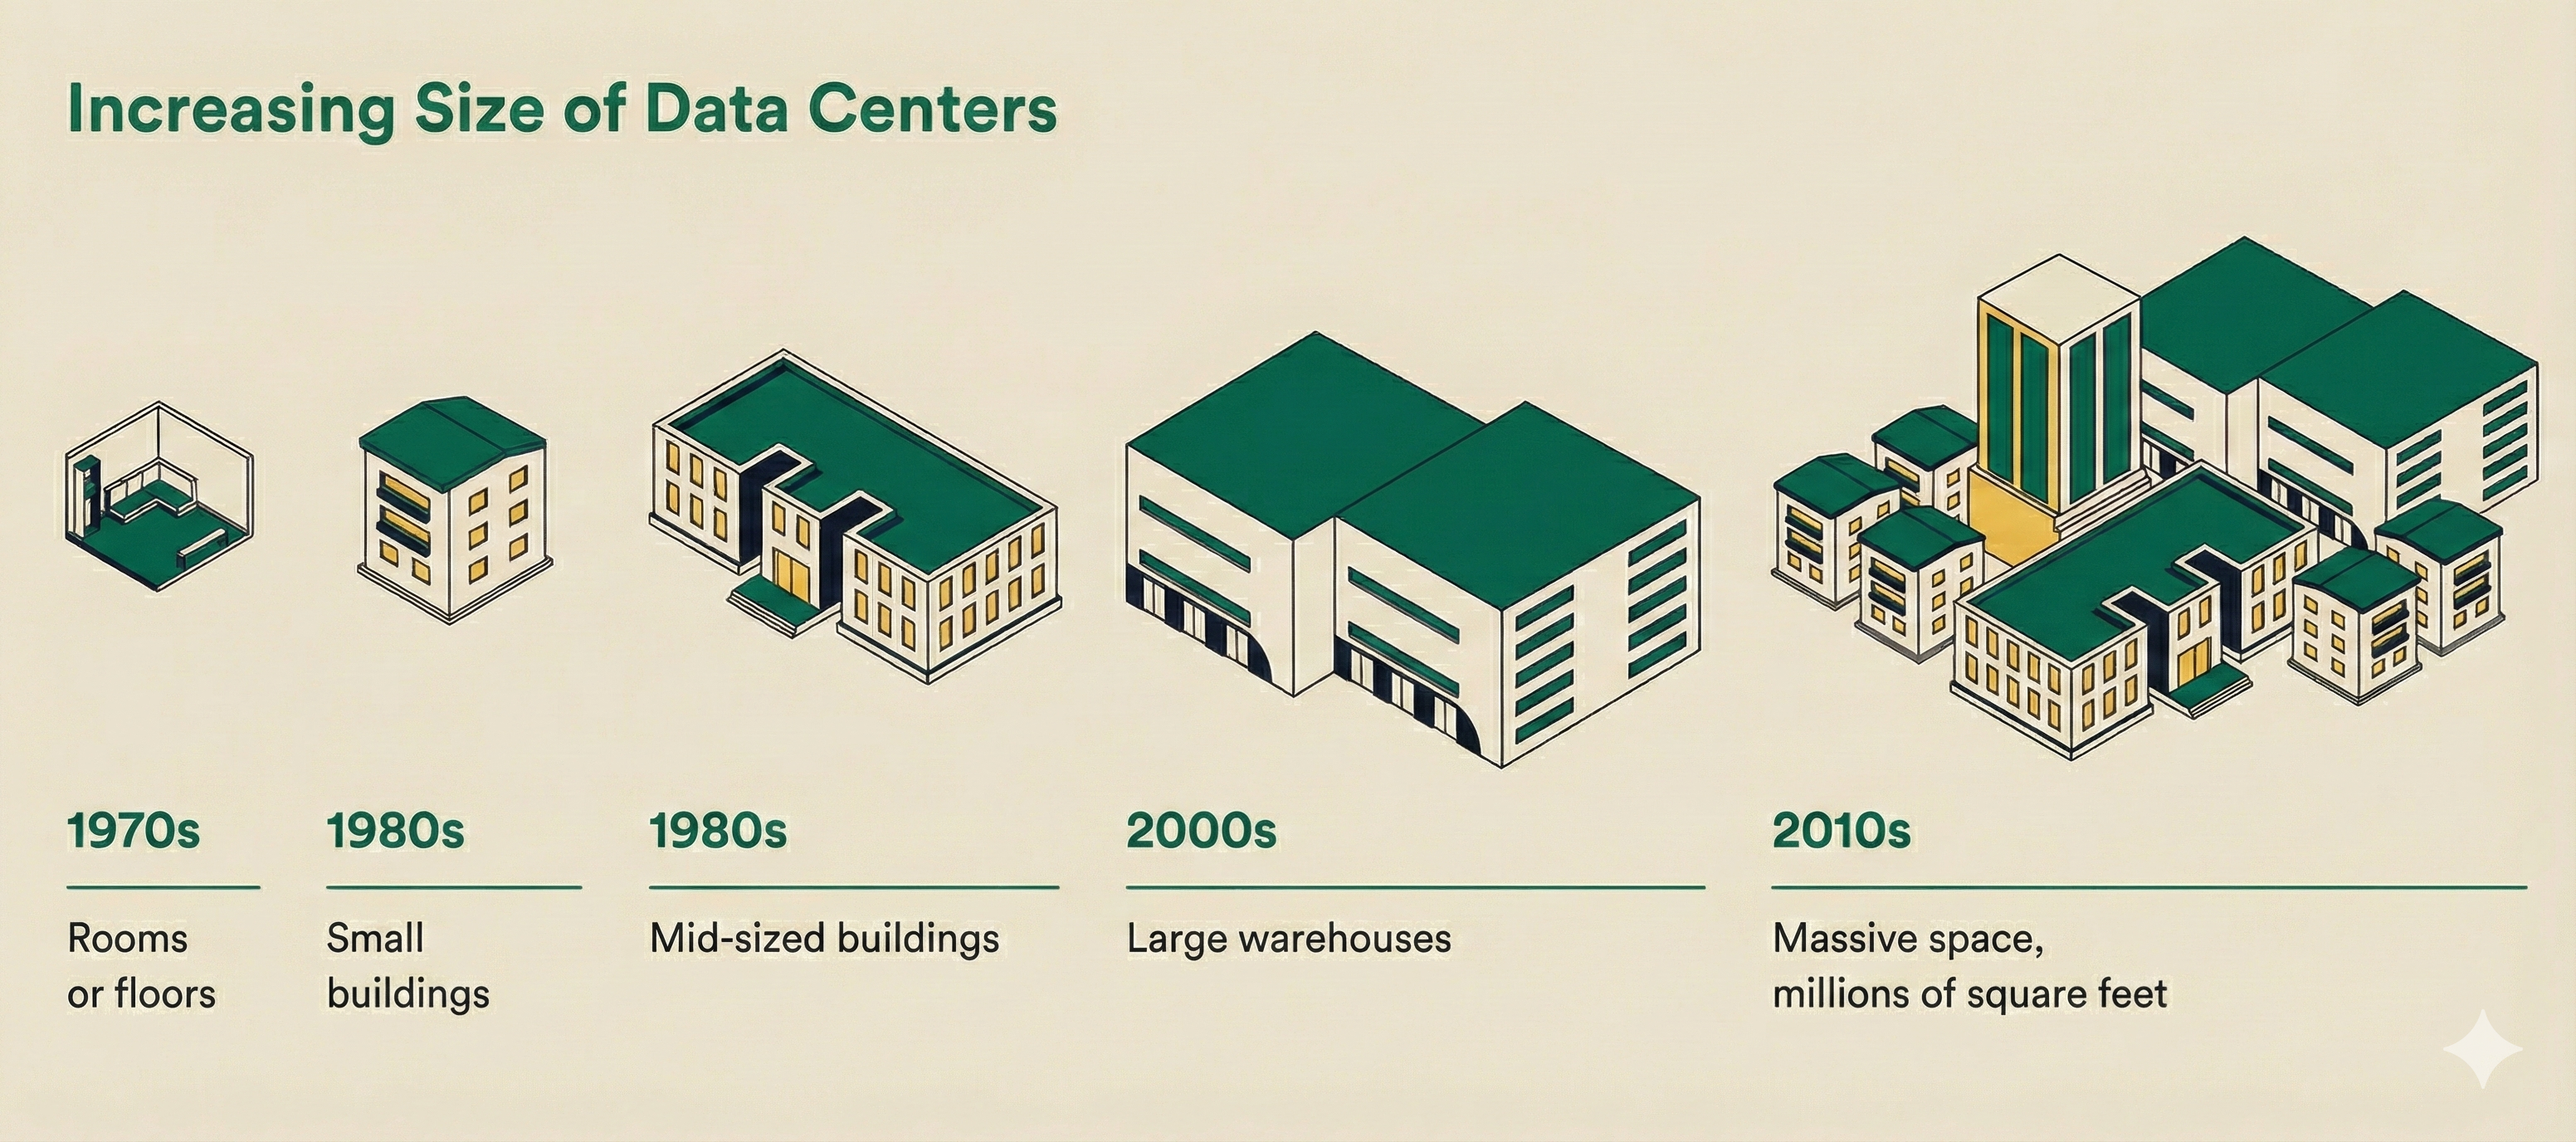
Data centers have evolved from small rooms in the 1970s to massive facilities spanning millions of square feet today. This expansion is clearly visible in permit data. About 50% of U.S. data centers are clustered in Northern Virginia, Northern California, and Dallas, Texas—locations chosen to minimize latency. According to a report by newamerica.org, newer AI data centers, especially those used for training, are being constructed in more remote areas like Indiana, Iowa, and Wyoming. This shift brings facilities closer to power plants and farther from cities to avoid straining urban power grids.
Let's see if permit data validates this.
In Q3 of 2025, we recorded 18 states that issued permits related to data centers. Virginia alone accounted for 52.6% of all data center permits for the quarter. This was followed by Texas (6.8%) and Arizona (6%). Digging a little deeper to the county level, we find the following.
Top 10 Counties for Q3 Data Center Permits
| STATE | COUNTY | PERMIT_COUNT | DATA_CENTER_PERCENTAGE | RANK |
|---|---|---|---|---|
| VA | LOUDOUN | 84 | 35.9 | 1 |
| VA | FAIRFAX | 30 | 12.82 | 2 |
| AZ | MARICOPA | 14 | 5.98 | 3 |
| IA | LINN | 12 | 5.13 | 4 |
| IN | ALLEN | 10 | 4.27 | 5 |
| TX | DALLAS | 9 | 3.85 | 6 |
| VA | MANASSAS | 6 | 2.56 | 7 |
| GA | FULTON | 5 | 2.14 | 8 |
| CO | DENVER | 5 | 2.14 | 9 |
| WA | SNOHOMISH | 4 | 1.71 | 10 |
Q3 2025 marks a watershed moment for data center development, with 234 data center related permits issued nationwide, driven by explosive demand for AI computing infrastructure. Virginia's Loudoun County issued 84 data center related permits (35.9% of national total), cementing its status as the world's data center capital. Coupled with neighboring Fairfax County (racking up 30 more data center related permits), VA accounts for nearly half of all permits in the category. For a deeper dive, see: Virginia's Data Center Dominance: A Deep Dive into Permit Trends.
Data Center Permit Analysis
While we work on adding a DATA_CENTER permit category to the Shovels Data Dictionary, we had to manually deep dive into the data set to derive our conclusions. Here's how we analyzed data center permits and what we discovered:
- Keyword searches don't work reliably. "Data center" appears in corporate IT closets, while real facilities use varied terminology like "data hall," "computer room," or just "tenant improvement".
- Geographic clustering proved more effective. Northern Virginia's Ashburn/Sterling area had multiple facilities within blocks of each other, suggesting location-based searches outperform keywords. 👋 Hello Esri ArcGIS integration!
- Technical infrastructure revealed true data centers. We looked for specialized equipment like CRAH/CRAC cooling systems, massive electrical infrastructure (megawatt generators), industrial voltage + UPS systems, raised floors, pre-action fire suppression, and VESDA detection systems.
- Property classifications can be unreliable. Some data centers were misclassified as "Department Store" or "Commercial - General", showing property records lag behind actual use.
- Permit volume patterns matter. We found 50-150 permits in 1-2 years typically indicates new data center construction.
From Permits to Power: Who's Building Data Centers
Data centers consume massive electrical power, historically sourced from the electric grid. As AI drives new data center construction, electricity demand is surging. A 2024 DOE study projected data center consumption will rise from 176 TWh in 2023 to 325-580 TWh by 2028. Concerns are growing that U.S. electricity supply won't meet future data center demand while other sectors also expand. Data centers not only consume larger and larger plots of land, but their power requirements also demand careful planning about where and how they source electricity.
Permit data reveals where and what is being built. A list of contractors associated with data center permits reveals who is building them. Data centers are increasingly large undertakings to construct, some requiring over 150 permits to complete. Unsurprisingly, electrical contractors account for the largest share of data center-related permits.
Accounting for various build phases (grading, shell, electrical, mechanical, plumbing, fire, etc.), here are the top 10 contractors associated with data center permits issued in Q3 2025:
| COMPANY | WEB | EXPERTISE | PERMITS |
|---|---|---|---|
| POWER SOLUTIONS LLC | powersolutions-llc.com | Specialty - High: Mission-critical electrical contractor serving DC/MD/VA data centers, healthcare, and government facilities | 27 |
| DPR CONSTRUCTION INC. | dpr.com | General Contractor - Tier 1: Nation's largest data center contractor, completed 250+ data center projects in last decade for Meta, Google, Microsoft | 12 |
| DYNALECTRIC CO. | dynalectric-dc.com | Specialty - Tier 1: Electrical contractor (EMCOR subsidiary), major mission-critical/data center expertise across multiple regional divisions, dominant in Northern Virginia | 10 |
| HELIX ELECTRIC INC. | helixelectric.com | Specialty - High: Electrical contractor ranked #14 on ENR's top electrical firms list, significant data center portfolio including multi-billion dollar projects | 9 |
| W E BOWERS & ASSOCIATES INC. | webowers.com | Specialty - High: Mechanical contractor (HVAC/plumbing) specializing in critical facilities including data centers, based in DC metro area since 1984 | 9 |
| HOLDER CONSTRUCTION GROUP LLC | holderconstruction.com | General Contractor - Tier 1: Ranked #1 data center contractor in 2024, completed 250+ data center projects over 15+ years for Facebook, EdgeCore, Iron Mountain. Noted for $1.9B Arizona data center job. | 5 |
| M. C. DEAN INC. | mcdean.com | Specialty - Tier 1: Electrical/systems integration contractor, historically ranked #2 electrical contractor nationally, major data center expertise with modular capabilities | 4 |
| CHESAPEAKE SPRINKLER CO. | chesasprink.com | Specialty - Medium: Fire protection contractor serving DC/MD/VA since 1978 (now part of Century Fire Protection), specializes in fire sprinkler systems | 3 |
| CLUNE CONSTRUCTION CO. | clunegc.com | General Contractor - High: Ranked #8 data center contractor nationally, 400+ mission-critical experts, 20+ years building data centers, employee-owned (ESOP) | 3 |
| J E RICHARDS INC. | jerichards.com | Specialty - High: Electrical contractor since 1983 with heavy emphasis on design/build and data center/critical power applications, serves DC/MD/VA region (~750 employees) | 3 |
- 5 Electrical Contractors: Dynalectric, M.C. Dean, Helix Electric, Power Solutions, and J.E. Richards - all with strong data center credentials
- DC Metro Dominance: 6 of 10 companies are based in or heavily serve the DC/MD/VA region (the nation's largest data center market)
- Critical Power Focus: J.E. Richards specializes in "key and critical power systems" - essential for data center operations
☎️ Want to see the rest? Contact us!
Battery Storage: The Distributed Energy Revolution ⚡
Battery storage permits, or systems related to sustainability projects, help reveal an acceleration of energy storage adoption across America. Q3 2025 saw a total of 9,098 battery permits issued, with a concentration in states prioritizing renewable energy integration and grid resilience.
Top States by Battery Permits
| STATE | BATTERY_PERCENTAGE | RANK |
|---|---|---|
| Hawaii | 37.7 | 1 |
| Montana | 7.98 | 2 |
| California | 7.86 | 3 |
| Arizona | 4.72 | 4 |
| Oregon | 1.59 | 5 |
| Illinois | 1.14 | 6 |
| Connecticut | 0.88 | 7 |
| Michigan | 0.86 | 8 |
| New Hampshire | 0.84 | 9 |
| Texas | 0.72 | 10 |
The battery storage permit category reveals a fascinating contrast between adoption rates and absolute scale. Hawaii leads the nation in battery adoption intensity, with an extraordinary 38% of all permits involving battery storage, a figure driven by the state's exceptionally high electricity costs, abundant solar resources, and ambitious grid independence goals. Montana and California follow at 8% each, though California's seemingly modest percentage masks an overwhelming dominance in raw numbers.
When examining absolute permit counts, California issued 6,764 battery permits in Q3 2025, representing 74% of all national battery storage permits. This concentration reflects California's aggressive renewable energy mandates, established solar industry, and mature energy storage market.
However, the per-capita analysis tells a more nuanced story. California leads at 17 permits per 100,000 residents, while Hawaii trails next at 10 per capita (remarkable given Hawaii's much smaller population of 1.4 million compared to California's 39.4 million).
Battery Permits Per Capita
| STATE_NAME | POPULATION | BATTERY_PER_100K_RESIDENTS | RANK |
|---|---|---|---|
| California | 39431263 | 17.29 | 1 |
| Hawaii | 1446146 | 9.96 | 2 |
| Arizona | 7582384 | 5.12 | 3 |
| Montana | 1137233 | 4.13 | 4 |
| North Carolina | 11046024 | 2.73 | 5 |
| Colorado | 5957493 | 1.88 | 6 |
| Nevada | 3267467 | 1.87 | 7 |
| Florida | 23372215 | 1.48 | 8 |
| Texas | 31290831 | 1.38 | 9 |
| Virginia | 8811195 | 1.21 | 10 |
Arizona emerges as another significant player, with 5.12 permits per 100,000 residents, suggesting that battery storage is becoming critical infrastructure in regions with high renewable energy penetration and grid stability challenges. Montana's 4.13 per capita rate, despite its small population, indicates strong adoption in rural and remote areas where grid resilience is paramount. The data ultimately reveals two parallel stories: California's industrial-scale deployment of battery storage infrastructure, and Hawaii's nation-leading per-capita adoption rate, both driven by distinct combinations of policy support, economic incentives, and geographic necessity.
EV Charging Infrastructure: The Transportation Transition
While Q3 marked a record sales quarter for EVs, it was really just a scramble for consumers to purchase their gasless transporters before federal tax credits (up to $7,500 for a new car) were eliminated. Federal tax credits ended September 30, 2025 for any new or used electric vehicles.
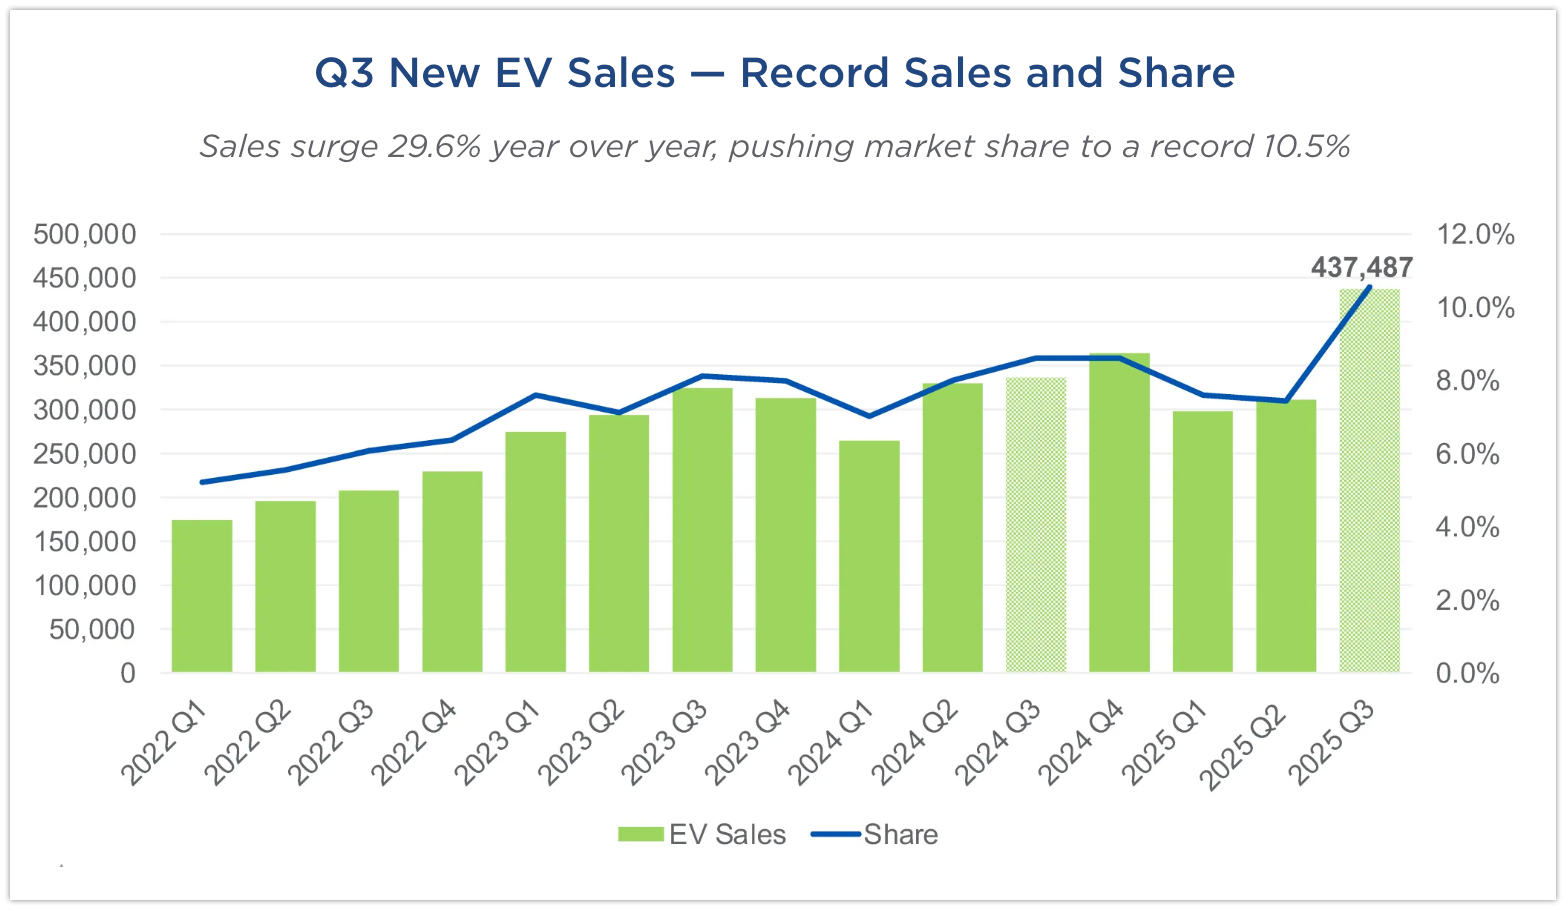
Source: Cox Automotive
That being said, EV charging permits serve as a leading indicator for electric vehicle adoption and infrastructure readiness. As all automakers shift from gas to electric fleets, the infrastructure to support an inevitable transportation shift is unfolding right before our eyes, and permit activity gives us a front row seat to the action.
Let's jump in to the data and see what gives. Q3 2025 saw 4,274 EV charger permits issued nationwide, with clear leaders emerging.
The two tables below reveal how different ranking methodologies can tell distinct stories about EV charging infrastructure deployment. The first table ranks states by EV permits as a percentage of all permits in that state, with Hawaii leading at 4.71%, followed by California at 1.68% and Oregon at 1.59%. This metric shows which states are prioritizing EV infrastructure relative to their overall construction activity.
Top 10 States - EV Charger Permits as Percentage of Total Permits
| STATE | EV_PERCENTAGE | RANK |
|---|---|---|
| Hawaii | 4.71 | 1 |
| California | 1.68 | 2 |
| Oregon | 1.59 | 3 |
| North Carolina | 1.47 | 4 |
| Virginia | 1.22 | 5 |
| Washington | 0.96 | 6 |
| Arizona | 0.89 | 7 |
| Illinois | 0.86 | 8 |
| Michigan | 0.83 | 9 |
| Maryland | 0.81 | 10 |
The per-capita ranking reveals a different story than the percentage-based view. North Carolina leads the nation with 6.63 EV charging permits per 100K residents—outpacing even California's 5.1 per capita despite California's much larger absolute numbers. Virginia ranks third at 4.79 per capita, while states like Washington (2.5) and Nevada (2.42) emerge as significant players when adjusted for population, despite not appearing in the percentage-based top rankings.
EV Charging Permits Per Capita
| STATE | POPULATION | EV_PER_100K_RESIDENTS | RANK |
|---|---|---|---|
| North Carolina | 11,046,024 | 6.63 | 1 |
| California | 39,431,263 | 5.1 | 2 |
| Virginia | 8,811,195 | 4.79 | 3 |
| Washington | 7,958,180 | 2.5 | 4 |
| Nevada | 3,267,467 | 2.42 | 5 |
| Colorado | 5,957,493 | 1.93 | 6 |
| Maryland | 6,263,220 | 1.44 | 7 |
| Florida | 23,372,215 | 1.33 | 8 |
| Hawaii | 1,446,146 | 1.24 | 9 |
| Oregon | 4,272,371 | 1.03 | 10 |
Several key trends emerge from the data: North Carolina's leadership in per-capita infrastructure demonstrates proactive planning ahead of mass EV adoption, challenging the narrative that EV adoption is solely a phenomenon of the west coast. California, Virginia, and Washington's strong performance reflects established EV adoption along coastal corridors and major transportation routes. Many permits represent commercial applications (workplace charging, fleet depots, and public charging stations) indicating institutional adoption beyond residential use. States like North Carolina and Colorado are building infrastructure in anticipation of demand rather than reacting to it.
EV Permit Approval Duration ⌛
Shovels friend and professor in the Department of Agricultural and Resource Economics at the Haas School of Business and a faculty director at the Energy Institute at Haas, Meredith Fowlie, published a blog where she outlined a problem with the transition to mainstream EVs. Private firms are hesitant to invest in charging infrastructure due to low current demand, but demand stalls without a reliable charging network - causing a chicken and egg issue. Building stations has been complicated by "permitting paralysis" and local coordination complexity.
To address this in our state, California has been experimenting with permitting reform for over a decade.
- AB 1236 (2015): Required localities to approve EV-charging permits unless there were substantial health/safety concerns.
- AB 970 (2021): Instituted a "shot clock" (20 or 40 days) for cities and counties to make a decision, with automatic approval if the timer runs out.
The result? Our data suggests that permitting approval times have decreased, likely due to the "shot clock" (AB 970) and subsequent reminders from the Attorney General, suggesting the reforms are working to grease the wheels of development.
While California accounts for 46.8% of all EV permits in our database, here's the mean approval duration for EV charger permits nationwide for the last 5 years.
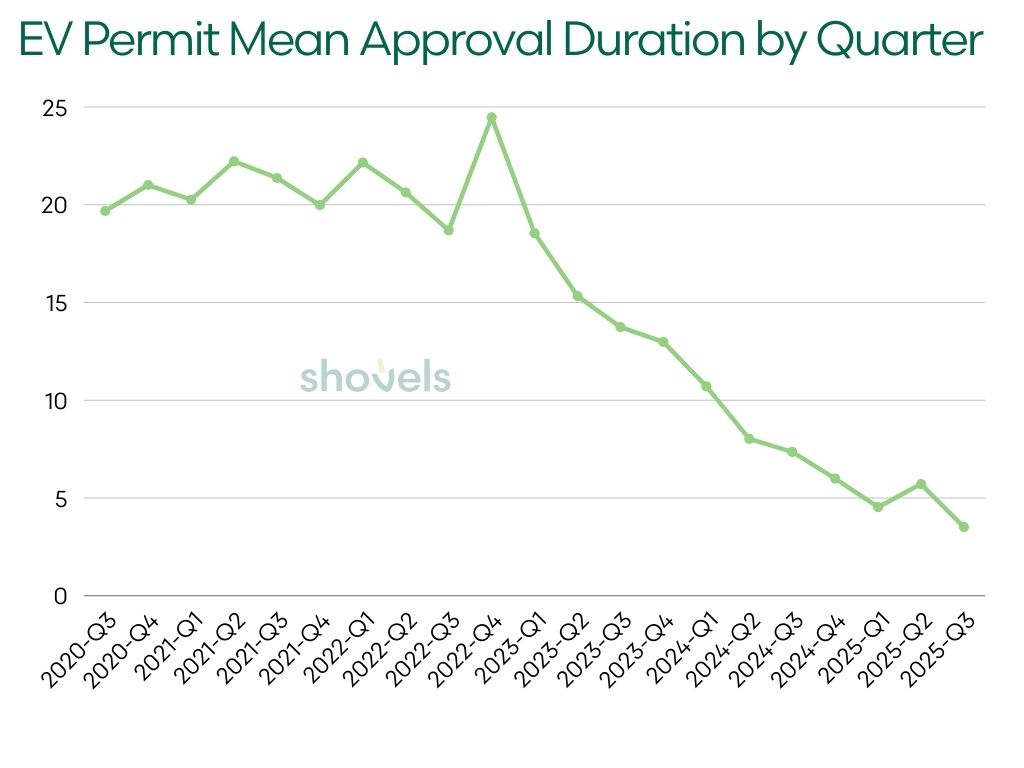
The MEDIAN_APPROVAL_DURATION was consistently low, with an overall median approval duration of 1 day and a minimum of 0 days. While mean approval time has dropped significantly, the gap between mean and median reveals the influence of outliers. This gap shows that while most permits move through approval quickly, a small segment takes substantially longer, pulling the mean upward. The reduction in mean duration over time indicates that handling these complex cases has improved significantly over time.
New Construction: Insights from Reliable Coverage Areas
Q3 2025 new construction activity reflects a market in transition. This analysis focuses on jurisdictions where we maintain comprehensive permit tracking to provide accurate insights, rather than presenting potentially misleading national statistics from incomplete coverage areas. Among jurisdictions with stable Q3 coverage, new construction patterns reveal distinct regional strategies.
San Diego, CA leads in new construction intensity at 19.2% of all Q3 permits (2,944 permits) in the region, though down from 3,401 in Q2. This high percentage reflects the region's continued housing demand despite broader market softness.
Charlotte, NC shows the strongest growth momentum, jumping from 929 new construction permits in Q2 to 2,001 in Q3 (+115.5%). While new construction represents just 8.3% of Charlotte's total permit volume, the absolute growth demonstrates the market's capacity to attract development.
Seattle, WA increased new construction from 985 permits in Q2 to 1,218 in Q3 (+23.7%), even as total permit volume declined. At 6.4% of total activity, Seattle's new construction share remains modest but growing.
Denver, CO processed 1,244 new construction permits (5.5% of total), down from 1,479 in Q2 (-15.9%). The decline aligns with broader market cooling but remains substantial in absolute terms.
Key Insight: San Diego's new construction share (19.2%) is more than double Charlotte's (8.3%) and nearly triple Seattle's (6.4%), suggesting coastal California markets continue prioritizing new development despite higher costs. Charlotte's massive Q2-to-Q3 growth (+115.5%) signals the Southeast's emergence as a primary destination for new construction capital.
New Construction Leaders Among Well-Covered States
Among the 20 states where Shovels maintains strong coverage (1,000+ Q3 permits), new construction intensity varies. The table below shows how new construction as a percentage of total permits shifted from Q2 to Q3:
Top 10 States by New Construction Share (Q3 2025):
| STATE | Q2 NC % | Q3 NC % | CHANGE |
|---|---|---|---|
| West Virginia | 37.58% | 23.99% | -13.59 pp |
| North Dakota | 15.47% | 17.99% | +2.52 pp |
| Mississippi | 23.96% | 15.13% | -8.83 pp |
| Oklahoma | 18.58% | 14.79% | -3.79 pp |
| South Dakota | 4.63% | 14.48% | +9.85 pp |
| North Carolina | 12.10% | 13.32% | +1.22 pp |
| Alabama | 10.55% | 13.14% | +2.59 pp |
| Hawaii | 15.23% | 13.08% | -2.15 pp |
| Idaho | 13.41% | 11.71% | -1.70 pp |
| South Carolina | 13.79% | 10.71% | -3.08 pp |
"pp" = percentage points. Q3 NC % shows new construction permits as a share of all permits in that state during Q3 2025.
Standout Performers:
North Carolina dominates in absolute volume with 11,936 new construction permits while maintaining 13% intensity. The state's combination of high volume and growing percentage (up from 12% in Q2) confirms its position as the nation's most active new construction market among well-covered states.
South Dakota experienced the most dramatic shift, jumping from 5% in Q2 to 15% in Q3 (+9.85 percentage points)—the strongest Q2-to-Q3 growth momentum among all top-10 states. This surge indicates either expansive development activity.
Alabama showed healthy growth, increasing from 10.55% in Q2 to 13% in Q3 (+2.59 percentage points), demonstrating the Southeast's broader construction momentum beyond North Carolina.
North Dakota maintained strong new construction intensity at 18% of total permits (up from 16% in Q2), continuing to show resilience in energy-adjacent markets with steady growth of +2.52 percentage points.
What This Tells Us:
New construction activity is concentrating in states with streamlined permitting, lower costs, and population growth. The data shows two distinct patterns: large states like North Carolina, Texas, and Oregon maintaining steady volume despite percentage declines, and smaller states like the Dakotas and West Virginia showing high percentages but lower absolute numbers. The Q2-to-Q3 comparison reveals that most markets experienced declining new construction shares, making South Dakota's +9.85 percentage point surge and North Carolina's steady growth particularly notable.
States with fewer than 1,000 total permits in Q3 are excluded from this analysis. This represents transparent reporting where data coverage is reliable.
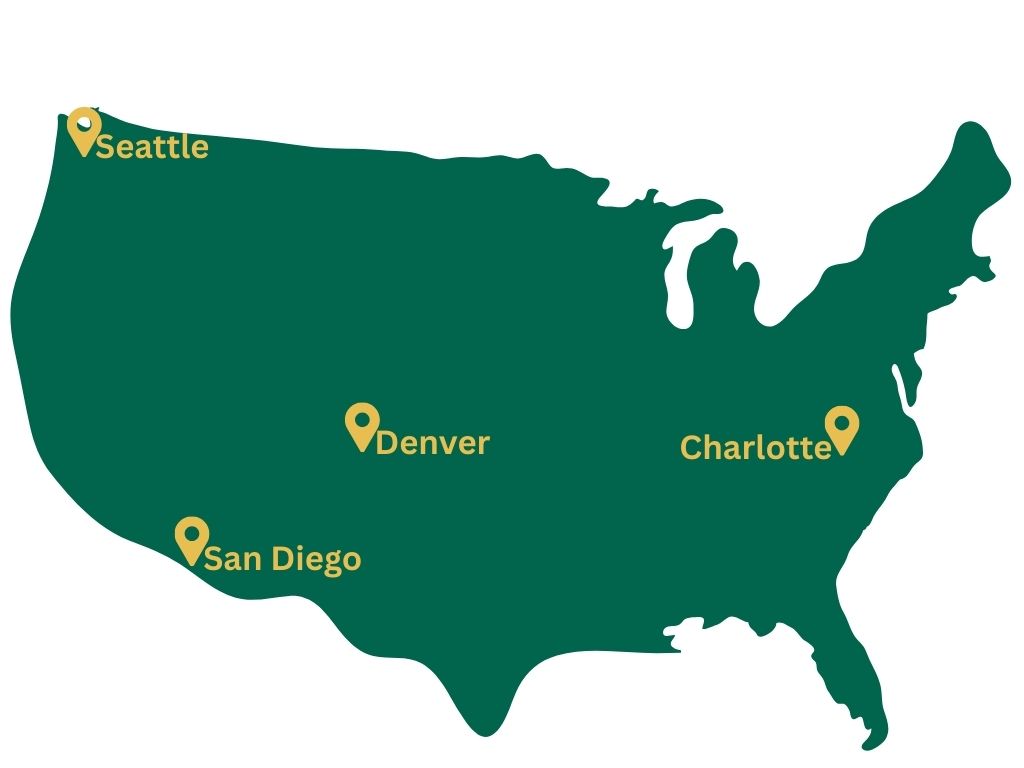
Q3 Construction Kingpins: Spotlight on Four Reliable Markets
Four major markets maintained consistent construction activity and comprehensive data coverage in Q3 2025: Charlotte, Denver, Seattle, and San Diego. Together, these jurisdictions processed 80,748 permits during the quarter, representing some of the most transparent and complete permit tracking systems in the country.
Charlotte, NC led with 14% growth quarter-over-quarter, jumping from 21,011 permits in Q2 to 24,006 in Q3. The city's 2,952 active contractors drove 18,381 residential permits and 2,001 new construction starts. Denver matched stability at -3.2%, processing 22,512 permits with balanced residential and commercial activity.
Seattle logged 18,919 permits (-8.2%) while San Diego processed 15,311 permits (-18%). San Diego showed the highest new construction share at 19% of Q3 volume, nearly triple Denver's 5.5% rate.
Top Builders by Jurisdiction
Charlotte, NC
- Champion Residential LLC: 1,414 permits (Q2: 1,584) | -10.7%
- Acosta Inc.: 410 permits (Q2: 269) | +52.4%
- Bobby Ray Nasekos: 520 permits (Q2: 597) | -12.9%
- Deaver Electric: 390 permits (Q2: 364) | +7.1%
- Andrew Peter Combs: 219 permits (Q2: 94, 62 new construction) | +133.0%
Denver, CO
- AGL Construction Co.: 539 permits (Q2: 567) | -4.9%
- Miller Pipeline LLC: 254 permits (Q2: 110) | +130.9%
- Smart Wave Solar LLC: 240 permits (Q2: 152) | +57.9%
- Plumbline Services LLC: 146 permits (Q2: 150) | -2.7%
- Applewood Plumbing & Heating Co.: 133 permits (Q2: 117) | +13.7%
Seattle, WA
- Blueprint Capital Services: 401 permits (Q2: 360) | +11.4%
- Prime Electric: 158 permits (Q2: 167) | -5.4%
- Andy Paroline: 151 permits (Q2: 148) | +2.0%
- Jodi Patterson-O'Hare: 143 permits (Q2: 161) | -11.2%
- Cochran Inc.: 111 permits (Q2: 96) | +15.6%
San Diego, CA
- Sunrun: 269 permits (Q2: 286) | -5.9%
- The White Glove Guys: 247 permits (Q2: 333) | -25.8%
- Walter Anderson Plumbing LLC: 131 permits (Q2: 186) | -29.6%
- Colorado Delta Mechanical Inc.: 127 permits (Q2: 173) | -26.6%
- West Coast Appliance Services Inc.: 112 permits (Q2: 106) | +5.7%
Top 10 Growth Builders (Q2 to Q3)
Contractors across all four reliable markets showed strong growth in specialized categories, with Denver and Seattle leading the gains:
- Mike Hasenack (Denver, CO): 254 permits, up from 110 | +130.9%
- Cynthia Blanding (Charlotte, NC): 100 permits, up from 48 (54 new construction) | +108.3%
- Kelsey Dague (Denver, CO): 176 permits, up from 89 (156 new construction) | +97.8%
- Comfy Air LLC (Seattle, WA): 74 permits, up from 38 | +94.7%
- Jan Adamczyk (Denver, CO): 71 permits, up from 37 (64 new construction) | +91.9%
- Mirsky Electric Inc (Seattle, WA): 57 permits, up from 31 | +83.9%
- Trina Borja (Denver, CO): 211 permits, up from 119 (20 new construction) | +77.3%
- Curtis Bigelow (Seattle, WA): 72 permits, up from 41 (30 new construction) | +75.6%
- Caleb Fesmire (Denver, CO): 42 permits, up from 25 | +68.0%
- Jeremy Burks (Denver, CO): 67 permits, up from 41 | +63.4%
Denver dominated the growth rankings with 6 of the top 10 spots, suggesting robust construction momentum in the Mountain West. Seattle placed 3 builders in the top 10, led by Comfy Air LLC's 95% surge and Mirsky Electric's 84% growth. Charlotte's Cynthia Blanding showed exceptional new construction activity, with 54% of her Q3 permits representing new builds. The consistent growth across HVAC, electrical, and general contracting indicates broad-based demand rather than category-specific spikes.
Top 10 Declining Builders (Q2 to Q3)
Several high-volume contractors experienced significant declines, suggesting project completions or market shifts:
- Permit Coordinator (Denver, CO): 3 permits, down from 112 | -97.3%
- Juan Larios (San Diego, CA): 6 permits, down from 165 | -96.4%
- Kristan Lagman (Denver, CO): 11 permits, down from 75 | -85.3%
- Levi Andrews (Denver, CO): 13 permits, down from 81 | -84.0%
- Phil Coughlin (San Diego, CA): 34 permits, down from 194 | -82.5%
- Ryan Brown (Denver, CO): 19 permits, down from 93 | -79.6%
- Seattle Housing Authority (Seattle, WA): 15 permits, down from 56 | -73.2%
- Erin Eastwood (Denver, CO): 22 permits, down from 72 | -69.4%
- Pro Cal Permit Company (San Diego, CA): 64 permits, down from 206 | -68.9%
- New Era HVAC Supreme Inc (Seattle, WA): 37 permits, down from 114 | -67.5%
San Diego placed 3 contractors in the decline rankings, with Juan Larios and Phil Coughlin showing steep drops that likely indicate large project completions rather than business contraction. Denver's "Permit Coordinator" decline from 112 to 3 permits suggests a shift in internal processing or data categorization. Seattle Housing Authority's 73% decline may reflect the timing of affordable housing projects moving through permit phases. Pro Cal Permit Company's drop from 206 to 64 permits represents the largest absolute decline (-142 permits) despite maintaining meaningful Q3 volume.
Q3 2025's Construction Signals: Three Transformations Reshaping the Industry
Q3 2025 permit data reveals three strategic infrastructure priorities reshaping construction:
AI Infrastructure Buildout Is Accelerating. 234 data center permits nationwide, with Virginia capturing 52.6% (84 permits in Loudoun County alone). This extreme geographic concentration represents generational infrastructure investment, with specialized contractors like DPR Construction (12 permits), Dynalectric (10 permits), and Holder Construction (5 permits) dominating mission-critical facility construction where downtime isn't an option.
Renewable Energy Deployment Continues Despite Policy Uncertainty. California issued 6,764 battery storage permits (74% national volume), while Hawaii achieved 37.7% battery adoption. North Carolina leads EV charging infrastructure (6.63 permits per 100K residents). State incentives and improving economics are driving renewable adoption regardless of federal policy, with contractors like Smart Wave Solar (+57.9% in Denver) and Comfy Air LLC (+94.7% in Seattle) experiencing structural growth in emerging categories.
Regional Winners Have Clear Competitive Advantages. North Carolina leads with 452 permits per 100K residents, followed by Virginia (392.97) and Nevada (352.41). These states combine permitting efficiency with favorable business climates. Meanwhile, New York (7.58 per 100K) and Pennsylvania (2.32 per 100K) show how regulatory complexity creates barriers—a 59x difference that reflects policy, not population.
Growing Builders Made Strategic Category Bets. The fastest-growing contractors across our four reliable markets—Mike Hasenack (+130.9% in Denver), Cynthia Blanding (+108.3% in Charlotte with 54% new construction), and Kelsey Dague (+97.8% in Denver with 156 new construction permits)—positioned themselves in high-growth categories: electrical infrastructure, new construction, and essential systems. They're specialists dominating emerging categories, not generalists chasing volume. Denver claimed 6 of the top 10 growth spots, while Seattle placed 3 builders showing robust HVAC and electrical demand.
What This Means for Your Strategy
Contractors and builders should note that Q3's fastest-growing firms focused on electrical infrastructure (20.9% of permits), renewable energy systems, and data center construction—not discretionary renovations. Market share is being won by specialists with expertise in mission-critical systems, not generalists chasing volume.
Investors and developers can see capital concentrating in AI infrastructure, renewable energy, and essential building systems, particularly in states with streamlined permitting (NC, VA, NV, ID). The per-capita rankings reveal where construction happens most efficiently relative to population, not just where the most total activity occurs.
Policymakers should examine why North Carolina processes 452 permits per 100K residents while New York manages just 7.58. This 59x difference isn't explained by population growth or climate, it reflects regulatory environments that either facilitate or impede development. The states topping per-capita rankings have lessons to share.
Suppliers and distributors should concentrate inventory and resources where construction intensity is highest (NC, VA, NV, FL, CO), not just where population is largest. Per-capita metrics reveal true demand concentration and market efficiency.
Q3 2025 permit data shows construction capital flowing toward infrastructure supporting technological and energy transitions: data centers powering AI, battery systems stabilizing grids, EV chargers supporting electrified transportation, and essential building systems keeping properties functional. The markets facilitating this construction most efficiently are pulling ahead.
Frequently Asked Questions
Q: How many building permits did Shovels track in Q3 2025?
A: Shovels recorded 515,912 permits in Q3 2025 (July 1 - September 30). Of these, 83.94% were active (in-progress), 14.41% were final (fully processed), and the remainder were in review, inactive, or had no status assigned.
Q: Which states have the highest construction intensity per capita in Q3 2025?
A: North Carolina leads the nation at 452 permits per 100,000 residents, followed by Virginia (393), Nevada (352), Nebraska (345), and Florida (344). This per capita view reveals a different picture than raw permit counts, showing states like Nebraska and South Dakota punching well above their population weight.
Q: How significant is data center construction activity in Q3 2025?
A: Q3 2025 saw 234 data center related permits issued nationwide. Virginia alone accounted for 52.6% of all data center permits, with Loudoun County pulling 84 permits (35.9% of the national total). Global data center demand is expected to triple by 2030, driven primarily by AI workloads.
Q: What does the battery storage permit data reveal about renewable energy trends?
A: In Q3 2025, 9,098 battery storage permits were issued. California dominates with 6,764 permits (74% of all national battery storage permits). Hawaii leads in adoption intensity, with 37.7% of all permits involving battery storage, driven by high electricity costs and grid independence goals.
Q: How fast are EV charger permits being approved, and is permitting reform making a difference?
A: The median approval duration for EV charger permits nationwide is just 1 day, though the mean is higher due to outliers. California's permitting reforms, including AB 1236 (2015) and AB 970's shot clock mechanism (2021), appear to be working. Mean approval times have decreased significantly over the past five years, and California accounts for 46.8% of all EV permits in the database.