
📊 All data in this index was pulled from Shovels proprietary platform for 2025-Q2 (April 1 - June 30). While we strive for 100% permit coverage, we just aren't there yet for a myriad of reasons. We currently have 85% population coverage and add hundreds of new jurisdictions each month. Dig into our data with a free account and keep an eye on our coverage dashboard.
Welcome to the Shovels Quarterly Permit Index for Q2 2025, your go-to guide for all the latest construction and renovation trends happening across America. We've crunched the numbers and uncovered some pretty cool patterns in building activity, how fast permits get processed, and what's different from region to region. You'll see everything from a surprising boom in electrical permits to some unexpected states leading the pack in new construction.
Whether you're a contractor, supplier, researcher, investor, or policy maker trying to navigate today's ever-changing construction scene, we've got insights you can actually use. Let's dive into the data that's shaping the future of our buildings and homes!
2025-Q2: The Big Picture
Our latest permit data reveals a comprehensive picture of construction and home improvement activity across diverse sectors during this dynamic quarter. While Reuters reports an 11-month decline in single-family starts—likely due to labor shortages stemming from the administration's immigration crackdown, increased materials costs, and high interest rates—the raw numbers tell a more nuanced story.
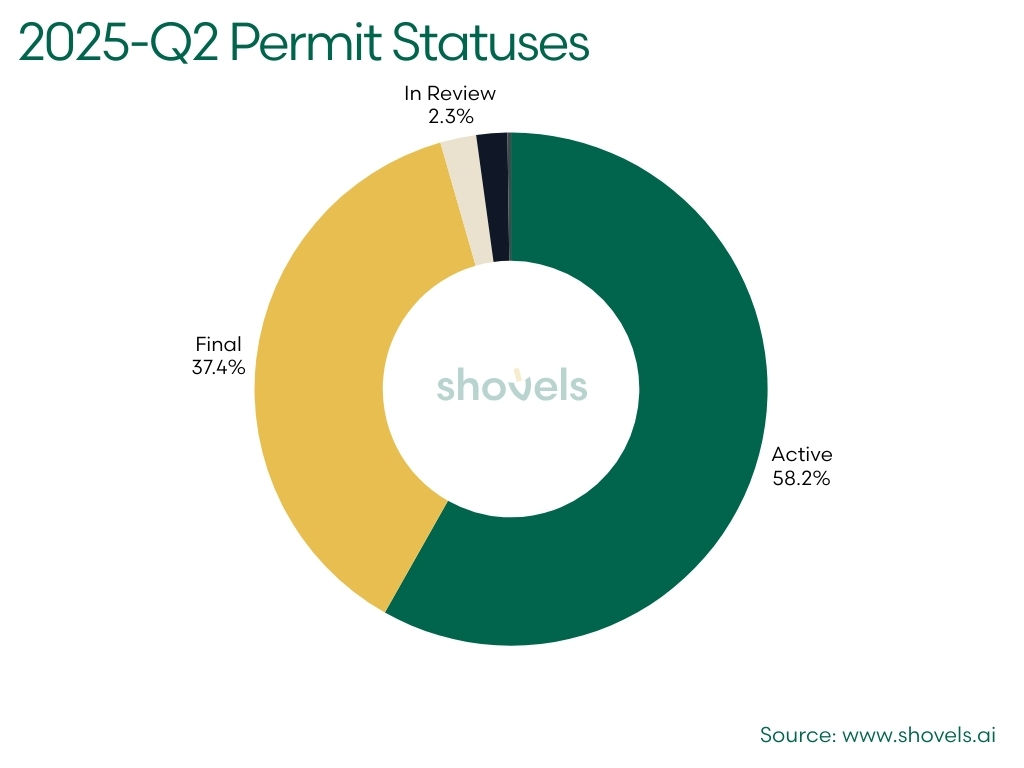
In Q2 2025, Shovels recorded 712,060 permits with: ISSUE_DATE BETWEEN '2025-04-01' AND '2025-06-30' AND APPROVAL_DURATION IS NOT NULL. The defined issue date range ensures we only look at permits in Q2, and the approval duration only looks at permits with a file date AND issue date. We want to report on clean data, so these parameters help weed out permits with variable quality of record keeping. Of the 712,060 permits issued in Q2, here is the breakdown of permit statuses:
| Status | Count | Percent | Detail |
|---|---|---|---|
| Active | 414288 | 58.18% | Most common: represents ongoing or in-progress permits |
| Final | 266124 | 37.37% | Indicates permits that have been fully processed and closed |
| In Review | 16155 | 2.27% | Permits currently being evaluated |
| Null Status | 13898 | 1.95% | No status assigned |
| Inactive | 1595 | 0.22% | Likely stagnant, cancelled or abandoned permits |
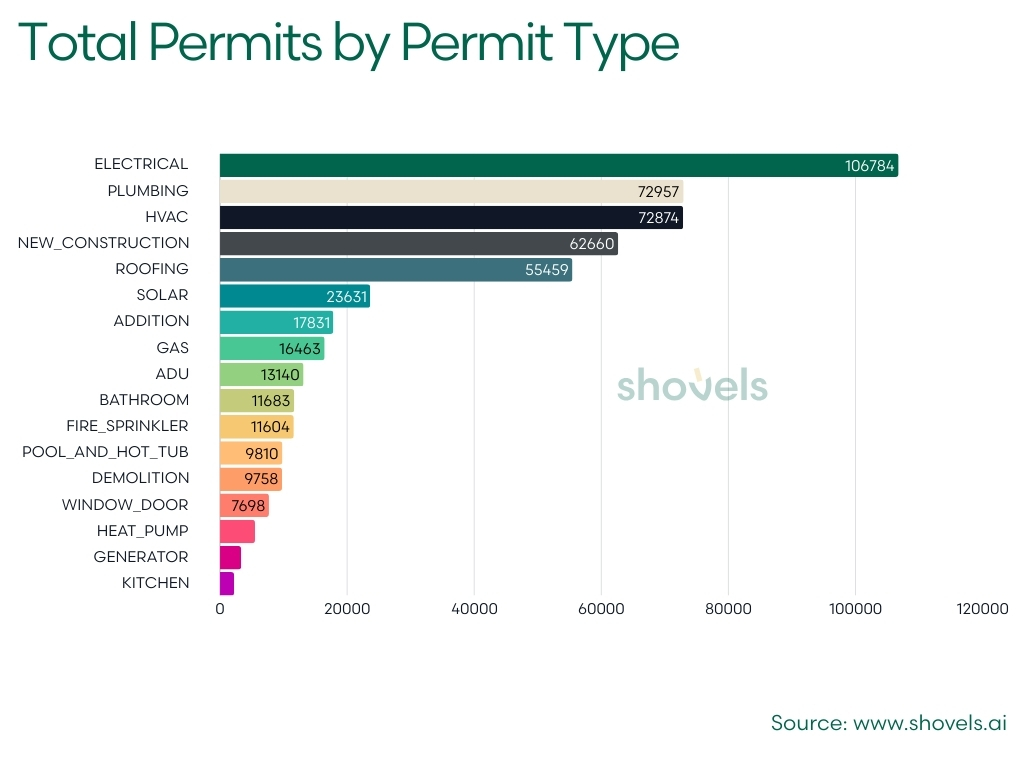
Digging deeper into the Q2 2025 data reveals some fascinating trends across permit types. When looking at permits issued in Q2, electrical permits are lighting up the charts with a whopping 106,784 filings - clear evidence that America is rewiring for the future. Plumbing systems aren't far behind at 72,957 permits, while HVAC work, nearly tied with plumbing, continues to flow steadily with 72,874 permits. This trifecta of essential building systems represents major investments in creating smarter, more efficient living spaces.
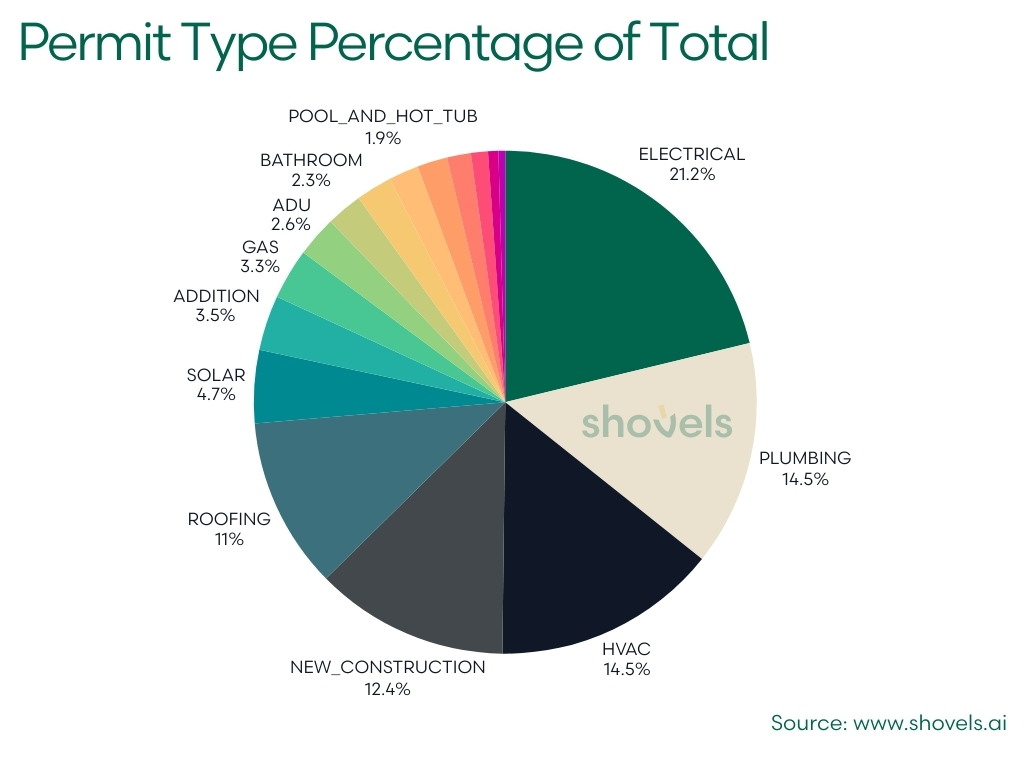
Let’s look at permit types as a percentage of the total. Electrical systems emerge as the unequivocal cornerstone of infrastructure development, commanding an impressive 21.21% of total permits. This electrical revolution is complemented by robust mechanical and plumbing upgrades – plumbing at 14.49% and HVAC at 14.48% – highlighting a comprehensive picture of systematic infrastructure renewal. New construction (12.45%) and roofing (11.02%) round out the top five categories, revealing a nuanced approach to building and renovation that balances critical system upgrades with expansive development.
🔌 Permit Type Highlights:
- Critical Systems Dominance: Electrical, plumbing, and HVAC permits collectively represent 50.18% of all permit activities, underscoring a strategic focus on core infrastructure resilience.
- Emerging Technologies: Solar permits at 4.69% and heat pump installations at 1.09% signal a gradual but meaningful transition towards sustainable energy solutions.
- Adaptive Spaces: Additions (3.54%), bathroom remodels (2.32%), and ADUs (2.61%) demonstrate a dynamic approach to space utilization and home transformation.
Sunbelt Surge: Regional Distribution of Permits
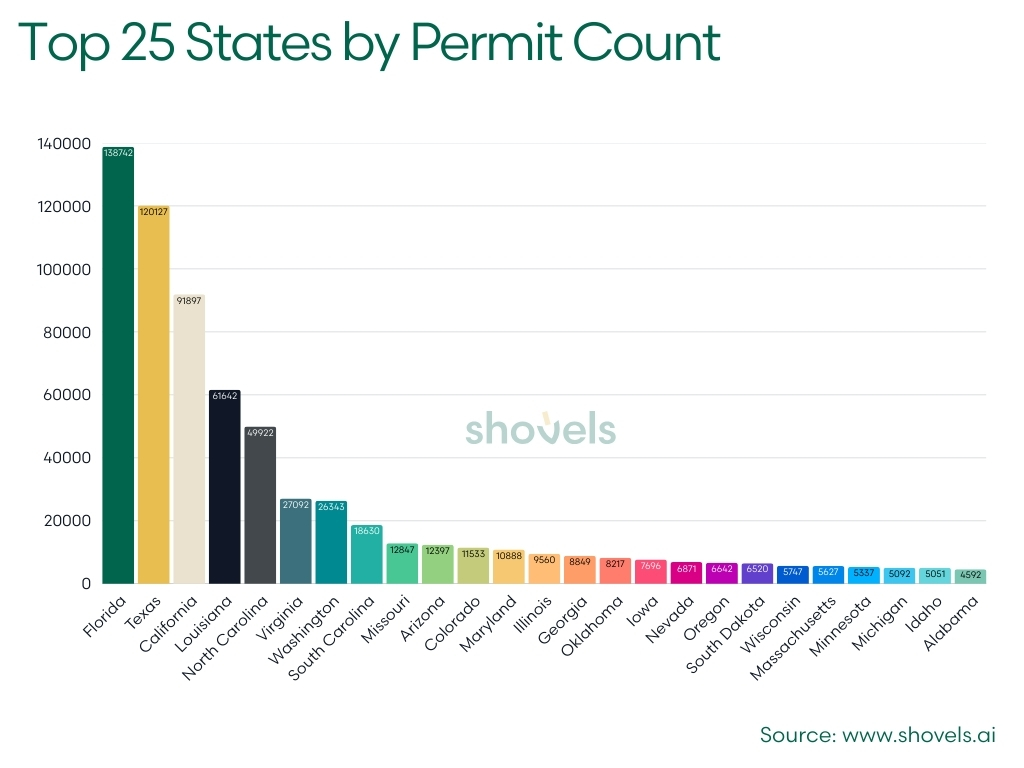
Florida dominates the permit landscape with 138,742 permits issued in Q2 2025, accounting for 19.48% of the national total. Texas follows closely with 120,127 permits (16.87%), while California rounds out the top three with 91,897 permits (12.91%). These three states alone represent nearly half (49.26%) of all permits issued nationwide, showcasing the concentrated construction and infrastructure activity in sunbelt states. While Louisiana (8.66%) and North Carolina (7.01%) complete the top five, the data reveals significant construction momentum across diverse geographic areas, with emerging activity in states like Virginia, Washington, and South Carolina.
📍Interactive map:
| STATE_NAME | TOTAL_PERMITS | PERCENT_OF_TOTAL_PERMITS | STATE_RANK |
|---|---|---|---|
| Florida | 138742 | 19.48% | 1 |
| Texas | 120127 | 16.87% | 2 |
| California | 91897 | 12.91% | 3 |
| Louisiana | 61642 | 8.66% | 4 |
| North Carolina | 49922 | 7.01% | 5 |
| Virginia | 27092 | 3.8% | 6 |
| Washington | 26343 | 3.7% | 7 |
| South Carolina | 18630 | 2.62% | 8 |
| Missouri | 12847 | 1.8% | 9 |
| Arizona | 12397 | 1.74% | 10 |
If we graph the states by permit count, the dominance of the top states is very clear. In a striking correlation between permit activity and insurance landscape, five states – Florida, California, Texas, Louisiana, and North Carolina – not only dominate the Q2 2025 construction permit scene but also represent critical hotspots in the national insurance risk matrix. These states account for nearly 65% of total permits and are simultaneously the most complex property insurance markets in the United States, characterized by heightened climate-related risks and evolving infrastructure challenges.
These states represent the epicenter of catastrophe-related insurance claims. Coined an “insurance crisis in Gulf states,” insurers are increasingly denying or closing claims without payment, with a significant rise in claim denial rates. Florida consistently ranks as the state with the highest property insurance cost due to hurricane risks. California stands as the second-largest insurance market in the U.S. because of high wildfire and earthquake risk exposure. Texas' large insurance market is driven by frequent wind and hail damage claims while Louisiana and North Carolina both face similar challenges with hurricane and flood risks.
New Construction Surges in Unlikely States
Many customers want to know what percentage of permits fall under the new construction permit category. Across the 62,660 nationwide new construction permits that Shovels tracked this quarter, we've analyzed the data state-by-state to reveal where the real building action is happening.
Our data reveals unexpected regional leaders in new construction activity. West Virginia stands as the surprising frontrunner with 34.67% of its permits dedicated to new builds—significantly above the national average (9.39%). This ranking is followed by a diverse group of states including Delaware (25.32%), Mississippi (20.47%), and Idaho (17.98%), which form the top tier of states transforming their built environments. The data suggests a complex narrative of economic renewal, demographic shifts, and strategic development extending well beyond previous growth centers.
This state-level analysis provides a more nuanced picture of construction activity across America. Rather than concentrating solely on established construction hubs, we're witnessing significant activity in previously overlooked regions. Below are the top ten states with the highest percentage of new construction permits relative to their total permit count for Q2-2025:
| STATE | NEW_CONSTRUCTION_PERCENTAGE | Rank |
|---|---|---|
| West Virginia | 34.67% | 1 |
| Delaware | 25.32% | 2 |
| Mississippi | 20.47% | 3 |
| Idaho | 17.98% | 4 |
| Tennessee | 16.77% | 5 |
| Pennsylvania | 16.68% | 6 |
| Michigan | 16.42% | 7 |
| North Carolina | 15.87% | 8 |
| Oklahoma | 15.61% | 9 |
| Indiana | 15.12% | 10 |
🏗️ Key Insights:
- West Virginia Leads the Way: With 34.67% of permits dedicated to new construction, West Virginia significantly outpaces the national average, followed by Delaware (25.32%) and Mississippi (20.47%).
- Regional Diversity: The top ten states span multiple regions including Appalachia (West Virginia), Mid-Atlantic (Delaware, Pennsylvania), the South (Mississippi, Tennessee, North Carolina, Oklahoma), and the Midwest (Michigan, Indiana).
- Emerging Growth Centers: The data reveals significant construction activity in previously overlooked states, possibly driven by lower living costs, manufacturing growth, and strategic economic development initiatives.
Permit Processing: The Rhythm of Bureaucratic Efficiency
In April 2025, the White House issued a transformative Presidential Memorandum on Permitting Technology that is already reshaping how building permits are processed nationwide. This comprehensive directive tackles longstanding inefficiencies in the environmental review and permitting process by mandating technological modernization across all federal agencies. By eliminating paper-based systems, reducing redundant submissions, and enhancing interagency coordination, this initiative aims to dramatically accelerate project timelines while maintaining thorough review standards. The following analysis of permit processing times reveals the early impact of these reforms and highlights significant variations across permit types and jurisdictions.
Our initial analysis of average permit processing times revealed significant data skewing due to outliers with extended APPROVAL_DURATION (file date to issue date). For instance, ADU permits averaged 177 days, solar permits 103 days, fire sprinkler 70 days, and new construction permits an extraordinary 238 days!
To better understand the distribution of permit approval times, we analyzed each permit type across 9 duration bins. Here’s a sample of a few permit types:
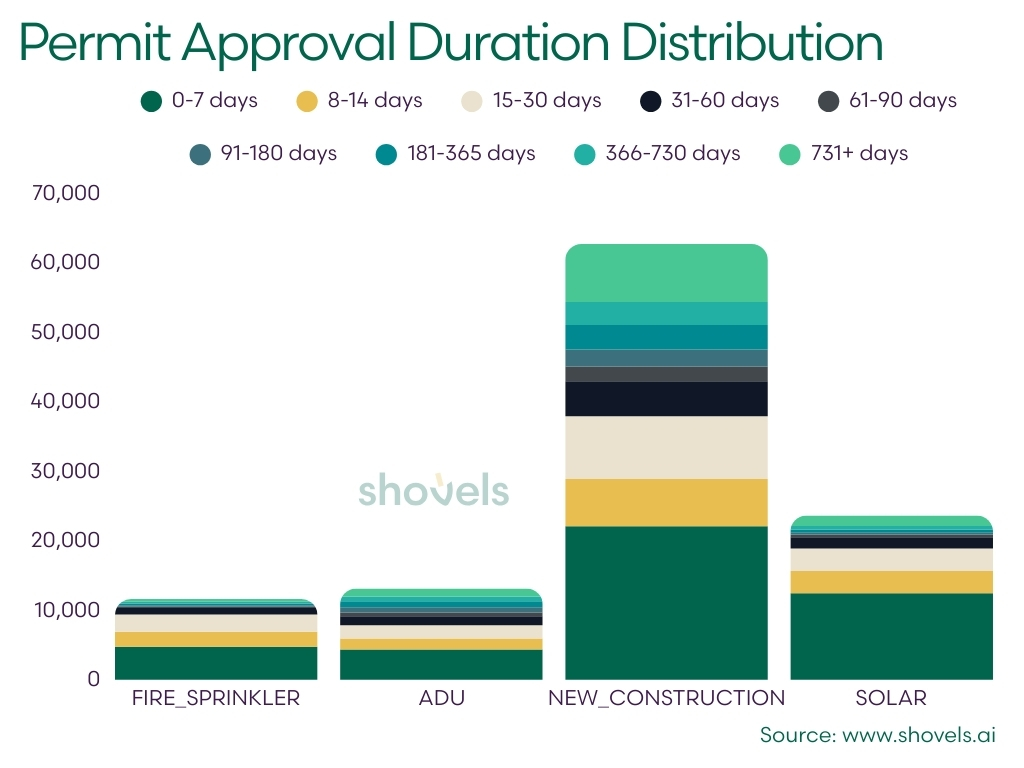
As shown, processing times vary dramatically across permit types, causing average values to skew significantly higher for certain categories. To present a more accurate picture of typical approval times, we've chosen to report median processing days instead.
For context, the median represents the middle value when all processing times are arranged from shortest to longest, ensuring the data isn't influenced by extreme values. This means 50% of permits are processed faster and 50% slower than the median processing day reported.
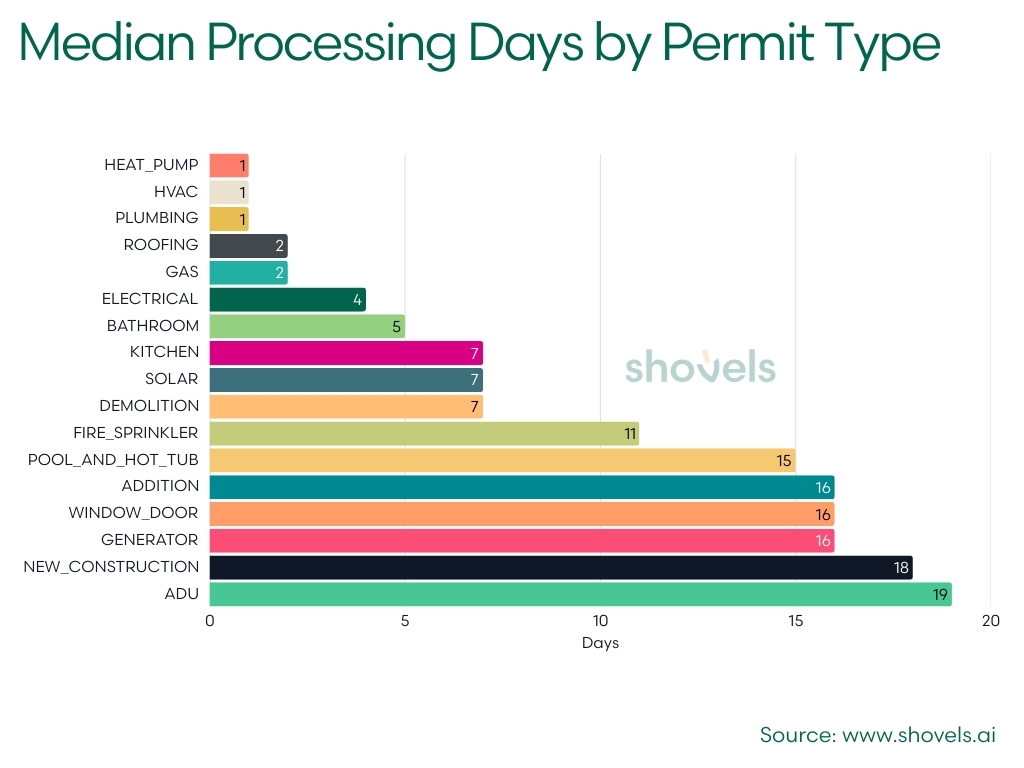
Looking at permit processing times by permit type uncovers clear patterns. Basic permits get processed quickly - plumbing, HVAC, and heat pump permits all take just 1 day (median). Roofing and gas permits need 2 days, while electrical permits require 4 days.
More involved projects take longer: bathroom remodels (5 days), solar installations (7 days), and kitchen renovations (7 days). Not surprisingly, the most complex projects require the most review time, with new construction taking 18 days and ADUs needing 19 days.
This data shows a permit system that effectively balances safety requirements with construction needs, processing simple permits quickly while giving necessary attention to complex projects.
| PERMIT_TYPE | TOTAL_PERMITS | MEDIAN_PROCESSING_DAYS |
|---|---|---|
| PLUMBING | 72957 | 1 |
| HVAC | 72874 | 1 |
| HEAT_PUMP | 5504 | 1 |
| ROOFING | 55459 | 2 |
| GAS | 16463 | 2 |
| ELECTRICAL | 106784 | 4 |
| BATHROOM | 11683 | 5 |
| SOLAR | 23631 | 7 |
| DEMOLITION | 9758 | 7 |
| KITCHEN | 2212 | 7 |
| FIRE_SPRINKLER | 11604 | 11 |
| POOL_AND_HOT_TUB | 9810 | 15 |
| ADDITION | 17831 | 16 |
| WINDOW_DOOR | 7698 | 16 |
| GENERATOR | 3326 | 16 |
| NEW_CONSTRUCTION | 62660 | 18 |
| ADU | 13140 | 19 |
Now let's deep dive into four key permit types that provide valuable insights into current construction and development trends across the country. Our analysis of ADUs, Solar installations, Fire Sprinkler systems, and New Construction reveals fascinating patterns in processing efficiency, regional variations, and potential economic indicators that matter to builders, investors, and policymakers alike.
Accessory Dwelling Units (ADUs): The Micro-Housing Revolution
There’s no denying the explosion of ADU popularity in recent years. ADUs, including basement apartments and garage flats, are a proven way to increase affordable housing supply. Also known as “granny flats” and “in-law units”, they offer numerous benefits, such as reducing housing costs, supporting aging in place, and creating wealth-building opportunities. Most cities have successfully implemented ADU programs.
There were a total of 13,140 ADU permits issued in Q2 of 2025. Our analysis reveals significant variations in processing times across counties, with Henderson County, NC ranking first in efficiency. The data shows a strong presence of North Carolina counties (4 of the top 10) in ADU permit processing speed, while California's Orange County also ranks among the leaders at #4. In April of 2025, The House Committee on Regulatory Reform in North Carolina gave preliminary approval to a bill that would allow many North Carolinians to build at least one ADU on their property, which might explain the high concentration in that state.
This regional efficiency suggests strategic prioritization of ADUs as housing solutions, particularly in areas facing affordability challenges. The quick turnaround times reflect how local governments are streamlining approval processes to support housing density and affordability initiatives through accessory dwelling units.
Data note: If counties tied for processing speed, the county with the higher total permits issued was ranked higher.
| STATE | COUNTY | PROCESSING_SPEED_RANK |
|---|---|---|
| NC | HENDERSON | 1 |
| IN | STEUBEN | 2 |
| MS | DESOTO | 3 |
| CA | ORANGE | 4 |
| NC | ROWAN | 5 |
| NC | WAYNE | 6 |
| WI | LA CROSSE | 7 |
| SC | DARLINGTON | 8 |
| FL | LEON | 9 |
| NC | HARNETT | 10 |
On the flip side, we also report the total number of ADU permits issued per top ten counties in Q2. The data shows Los Angeles County significantly outpaced all other counties, with nearly 10 times more ADU permits than the second-ranking county. Florida appears multiple times in the top 10 (Escambia, Lee, Santa Rosa, and Indian River counties), suggesting strong ADU growth in that state.
| STATE | COUNTY | TOTAL_ADU_PERMITS |
|---|---|---|
| CA | LOS ANGELES | 2243 |
| MD | HARFORD | 259 |
| FL | ESCAMBIA | 257 |
| TX | TRAVIS | 221 |
| NC | CATAWBA | 203 |
| NC | HENDERSON | 193 |
| FL | LEE | 172 |
| FL | SANTA ROSA | 170 |
| WA | SPOKANE | 162 |
| FL | INDIAN RIVER | 131 |
Solar Surge: The Green Permit Revolution
The renewable energy industry watched anxiously as the current administration took office. They anticipated a period of uncertainty, which was confirmed when the One Big Beautiful Bill Act passed in May 2025, significantly hampering renewable energy production and research across the United States. While this policy began taking effect in Q2, its full impact won't be evident for several quarters. We'll continue monitoring solar permit trends closely in the coming months and years.
Q2 2025 saw 23,631 solar permits issued across the country. The data reveals California's dominance in solar permit processing efficiency, with Los Angeles County leading the rankings followed by other California counties occupying seven of the top eight positions. Florida's Hillsborough County ranks ninth, while Hawaii's Honolulu County rounds out the top ten. These rankings reflect both the growing investment in renewable energy infrastructure and the streamlined permitting processes developed in these solar-friendly and sun-drenched regions.
| STATE | COUNTY | PROCESSING_SPEED_RANK |
|---|---|---|
| CA | LOS ANGELES | 1 |
| AZ | PIMA | 2 |
| CA | SOLANO | 3 |
| CA | ORANGE | 4 |
| CA | SAN DIEGO | 5 |
| CA | MARIN | 6 |
| CA | VENTURA | 7 |
| CA | SONOMA | 8 |
| FL | HILLSBOROUGH | 9 |
| HI | HONOLULU | 10 |
California dominates the solar permit landscape, with Los Angeles County leading with 1,932 permits, followed by other California counties claiming six of the top ten spots. Arizona, Florida, and Texas also show strong solar adoption, suggesting broader regional momentum for renewable energy despite recent policy challenges.
| STATE | COUNTY | TOTAL_SOLAR_PERMITS |
|---|---|---|
| CA | LOS ANGELES | 1932 |
| CA | RIVERSIDE | 952 |
| CA | SAN BERNARDINO | 630 |
| FL | ESCAMBIA | 629 |
| AZ | PIMA | 482 |
| CA | SOLANO | 428 |
| AZ | MARICOPA | 414 |
| CA | SANTA CLARA | 400 |
| TX | BELL | 369 |
| CA | ORANGE | 359 |
Fire Sprinkler Frontier: The Digital Infrastructure Safety Revolution
🔥 Fire sprinklers are hot! In Q2 2025, 11,604 fire sprinkler permits illuminate a critical infrastructure trend. These permits aren't just about safety—they serve as early warning systems for commercial development, new construction, tenant improvements, industrial facility upgrades, and expansions in healthcare or education facilities. The data also indicates rapid growth in high-risk facilities such as data centers, multi-family housing, and critical infrastructure projects.
Policy makers, researchers, and insurance providers should take note: emerging indicators highlight evolving fire safety standards, particularly in wildfire-prone regions like California, where regulatory changes continue to reshape construction and risk management landscapes.
Our analysis reveals a diverse mix of counties with fast fire safety permit processing, with Richmond, VA leading the rankings at #1.
New York's Albany County shows impressive efficiency at #2, while Texas appears twice in the top 10 with Webb County at #4 and McLennan County at #10. The geographic distribution suggests prioritization of critical safety infrastructure across various regions, particularly in areas housing commercial and technological facilities.
| STATE | COUNTY | PROCESSING_SPEED_RANK |
|---|---|---|
| VA | RICHMOND | 1 |
| NY | ALBANY | 2 |
| NC | WAYNE | 3 |
| TX | WEBB | 4 |
| MN | HENNEPIN | 5 |
| FL | SEMINOLE | 6 |
| CO | WELD | 7 |
| CA | SANTA CRUZ | 8 |
| WI | LA CROSSE | 9 |
| TX | MCLENNAN | 10 |
When turning our attention to the top ten counties based on total fire sprinkler permits issued, we see California leads with Los Angeles County issuing the most permits (1,310), demonstrating significant investment in fire safety infrastructure. Texas (Collin County and Denton County) and Florida (Escambia and Miami-Dade) both appear twice in the top ten, prominently highlighting regional focus on fire safety. Virginia's Loudoun County's presence (222 permits) correlates with the region's expanding data center corridor, which requires robust fire protection systems.
The geographic distribution reflects areas with commercial development, technological infrastructure, and possibly regions with stringent fire safety requirements
| STATE | COUNTY | TOTAL_FIRE_SPRINKLER_PERMITS |
|---|---|---|
| CA | LOS ANGELES | 1310 |
| TX | COLLIN | 383 |
| CA | RIVERSIDE | 285 |
| AZ | MARICOPA | 284 |
| FL | ESCAMBIA | 256 |
| FL | MIAMI-DADE | 234 |
| NC | WAKE | 222 |
| VA | LOUDOUN | 222 |
| CA | ORANGE | 214 |
| TX | DENTON | 198 |
New Construction: Building Momentum at Record Speeds
Similar to the recent instability in the solar industry, new construction falls into uncharted territory as tariffs are estimated to add $9,200 to the cost of a new home. Increased existing-home listings also creates competition for new homes, which could make it a challenging future for home builders.
Q2 2025 saw 62,660 new construction permits issued nationwide. In regards to median processing times, the data reveals Texas's Hidalgo County leading the rankings at #1, with Nevada's Clark County following at #2. Similar to the ADU permit processing times, North Carolina appears prominently with four counties (Pitt, Wayne, Columbus, and Rowan) in the top 10, demonstrating the state's efficient permitting processes.
| STATE | COUNTY | PROCESSING_SPEED_RANK |
|---|---|---|
| TX | HIDALGO | 1 |
| NV | CLARK | 2 |
| NC | PITT | 3 |
| ND | BURLEIGH | 4 |
| NC | WAYNE | 5 |
| NC | COLUMBUS | 6 |
| VA | RICHMOND | 7 |
| AL | MOBILE | 8 |
| IA | LINN | 9 |
| NC | ROWAN | 10 |
Looking at the top counties for total new construction permits, Southeastern states dominate, with Florida's Escambia County leading (2,554 permits). Louisiana's St. Tammany Parish (2,100) and Texas's Travis County (2,127) follow closely. The data suggests significant construction in hurricane-prone regions, with North Carolina (Catawba: 983, Wake: 832), Florida (Santa Rosa: 683), and South Carolina (Spartanburg: 712) all showing substantial activity, likely representing both recovery efforts and population growth.
| STATE | COUNTY | TOTAL_NEW_CONSTRUCTION_PERMITS |
|---|---|---|
| FL | ESCAMBIA | 2554 |
| TX | TRAVIS | 2127 |
| LA | ST. TAMMANY | 2100 |
| NC | CATAWBA | 983 |
| TX | FORT BEND | 836 |
| NC | WAKE | 832 |
| FL | CLAY | 758 |
| SC | SPARTANBURG | 712 |
| FL | SANTA ROSA | 683 |
| ID | CANYON | 655 |
Roofing Resilience: A State-by-State Infrastructure Narrative
Looking at roofing permits in Q2 2025, we see one clear story: Florida is booming. The Sunshine State was issued a whopping 42.88% of all roofing permits nationwide (24,818 permits). California came in second with 17.06% (9,874 permits), and Texas rounded out the top three with 16.08% (9,308 permits). When you add in Louisiana and Washington, these five states account for over 83% of all roofing permits issued. This concentration tells us where infrastructure investments are happening - primarily in states facing climate challenges or experiencing rapid growth.
| STATE | TOTAL_ROOFING_PERMITS | PERCENT_OF_ROOFING_PERMITS |
|---|---|---|
| FL | 24818 | 42.88% |
| CA | 9874 | 17.06% |
| TX | 9308 | 16.08% |
| LA | 2604 | 4.50% |
| WA | 2004 | 3.46% |
| CO | 1747 | 3.02% |
| SC | 1192 | 2.06% |
| IL | 950 | 1.64% |
| GA | 705 | 1.22% |
| AL | 488 | 0.84% |
Construction Kingpins: Q2 Permit Performers
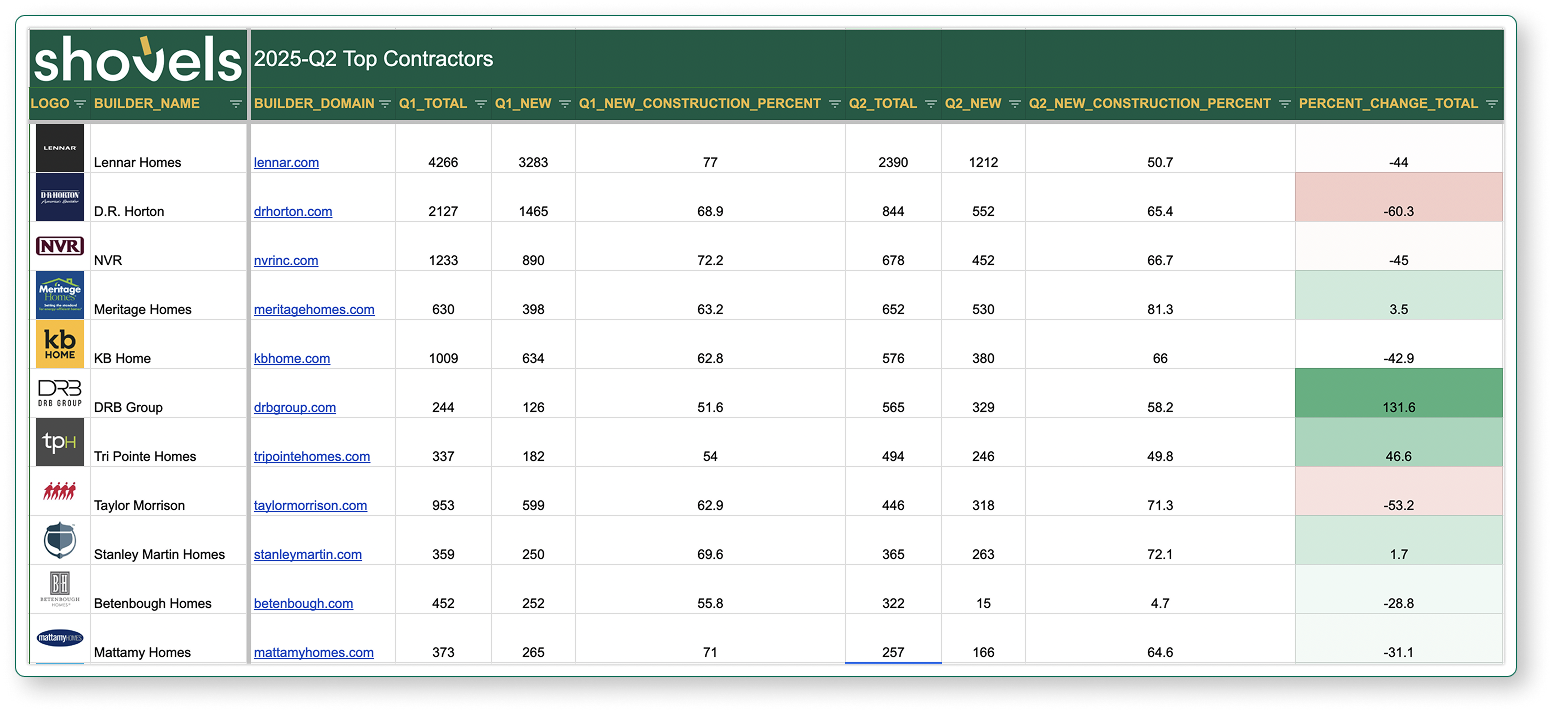
🏅 Our analysis of 50 top contractors provides a comprehensive overview of builder permit activity. The data showcases total permits, new construction projects, and quarter-to-quarter changes between Q1 and Q2 of 2025.
The construction industry's Q2 2025 performance reveals that these 50 contractors generated 10,483 permits, highlighting the dynamic nature of residential development. Lennar Homes emerged as the clear leader, pulling 2,390 permits and solidifying their market dominance, followed by D.R. Horton with 844 permits and NVR with 678 permits.
View the full dataset, including all 50 contractors, here.
🏗️ Key Insights:
- Market Leaders: Lennar Homes, D.R. Horton, and NVR set the pace for residential construction based on Q2 total permits.
- Standout Performers: DRB Group leads with a remarkable 131.6% increase from Q1 to Q2, followed closely by Shea Homes at 129.7%. LGI Homes also demonstrated significant growth at 55.8%, while Tri Pointe Homes and Fischer Homes showed positive trends with 46.6% and 27.3% growth, respectively.
- Losing Ground: DSLD Homes saw the most significant decline in total permits from Q1 to Q2 with a -93.0% change. CBH Homes followed with a substantial decrease of -92.2%. Legend Homes also experienced a notable drop of -90.2%. PulteGroup recorded a decrease of -84.3%, and Landsea Homes' permits declined by -83.7%.
- New Construction Champs: AMH Homes, Rausch Coleman Homes, Brookfield Homes, Smith Douglas Homes (new), and Landsea Homes all achieved a 100% new construction permit rate in Q2. This indicates that all of their permits in the second quarter were for new construction projects, highlighting their focus and success in this area.
A Pivotal Moment in Construction: Resilience Amid Complexity
Looking at the Q2 2025 data, we see clear construction trends that matter for builders, developers, and investors. Despite challenges from new tariffs, labor shortages, and economic uncertainty, the numbers show remarkable resilience across the industry. The electrical permit surge in the Northeast, surprising new construction growth in Southeastern states, and concentrated roofing activity in climate-vulnerable regions all point to an industry that's adapting quickly to changing conditions.
These aren't just statistics—they're signals of where the market is heading. As permitting processes become more efficient in places like North Carolina, and as contractors like DRB Group and Shea Homes show triple-digit quarterly growth, we're seeing the industry's remarkable ability to evolve. From ADUs in Wayne County to climate-adapted roofing in Florida, each permit represents concrete market intelligence you can use to make smarter business decisions.
Frequently Asked Questions
Q: Which permit types are most common in Q2 2025?
A: Electrical permits led with 106,784 filings (21.21% of total permits), followed by plumbing at 72,957 (14.49%) and HVAC at 72,874 (14.48%). Together, these three essential building systems represent over 50% of all permit activity in Q2 2025.
Q: Which states dominate building permit activity in Q2 2025?
A: Florida leads with 138,742 permits (19.48%), followed by Texas with 120,127 (16.87%) and California with 91,897 (12.91%). These three states alone account for nearly half of all permits issued nationwide.
Q: What is the median permit processing time for different project types?
A: Processing times vary significantly by project complexity. Simple permits like plumbing, HVAC, and heat pumps take a median of 1 day. Roofing and gas permits take 2 days. More complex projects take longer: solar installations take 7 days, new construction takes 18 days, and ADUs require 19 days.
Q: Which states lead in new construction as a percentage of total permits?
A: West Virginia leads at 34.67% of its permits going to new construction, significantly above the national average of 9.39%. Delaware follows at 25.32%, Mississippi at 20.47%, and Idaho at 17.98%. These rankings reveal significant construction activity in previously overlooked states.
Q: Where are ADU permits being issued the most?
A: Los Angeles County dominates with 2,243 ADU permits in Q2 2025, nearly 10 times more than the second-ranking county (Harford County, MD with 259). Florida appears four times in the top 10 (Escambia, Lee, Santa Rosa, and Indian River counties), suggesting strong ADU growth in that state.
❓ Have ideas for future reports? Let us know what permit data you think we should report on.
Shovels tracks over 170M permits in 2,000+ jurisdictions. Dig into the data yourself with a free Shovels account or contact sales today.