

An analysis of Hurricane Harvey and Hurricane Ian through the lens of permit activity.
The aftermath of a major hurricane is measured in many ways: lives lost, homes destroyed, insurance claims filed. But there's another metric that tells a compelling story about how communities actually rebuild: building permits. These bureaucratic documents, often overlooked in disaster coverage, provide an unfiltered view of recovery in action.
We analyzed permit data from two catastrophic hurricanes: Hurricane Harvey, which devastated Houston in August 2017, and Hurricane Ian, which slammed Florida's Gulf Coast in September 2022. The patterns that emerged reveal something unexpected: not all hurricane recoveries are created equal. The type of damage (flooding versus wind) creates dramatically different reconstruction timelines, each with its own signature in the permit data.
What we discovered offers crucial insights for anyone involved in construction, insurance, real estate, or emergency management in hurricane-prone regions.
Two Hurricanes, Two Different Stories
Hurricane Harvey: The Flood That Changed Houston
When Hurricane Harvey stalled over Houston on August 25, 2017, it dropped more than 50 inches of rain on Harris County. The catastrophic flooding that followed wasn't just about water in streets. It was about water in everything. Foundations cracked, electrical systems shorted out, and entire neighborhoods found themselves uninhabitable.
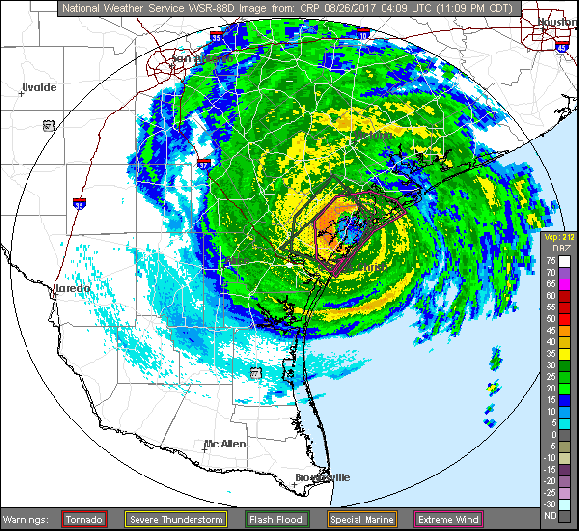
Harris County's pre-Harvey permit activity was modest, averaging around 680 permits per month. This was a functioning but not booming construction market. Then Harvey hit, and the immediate impact was stark: permit activity dropped 77% in the days following the storm. From August 1-24, the county had issued 2,016 permits (about 84 per day). From August 25-31, just 132 permits were issued (only 19 per day).
Hurricane Ian: When Wind Meets a Building Boom
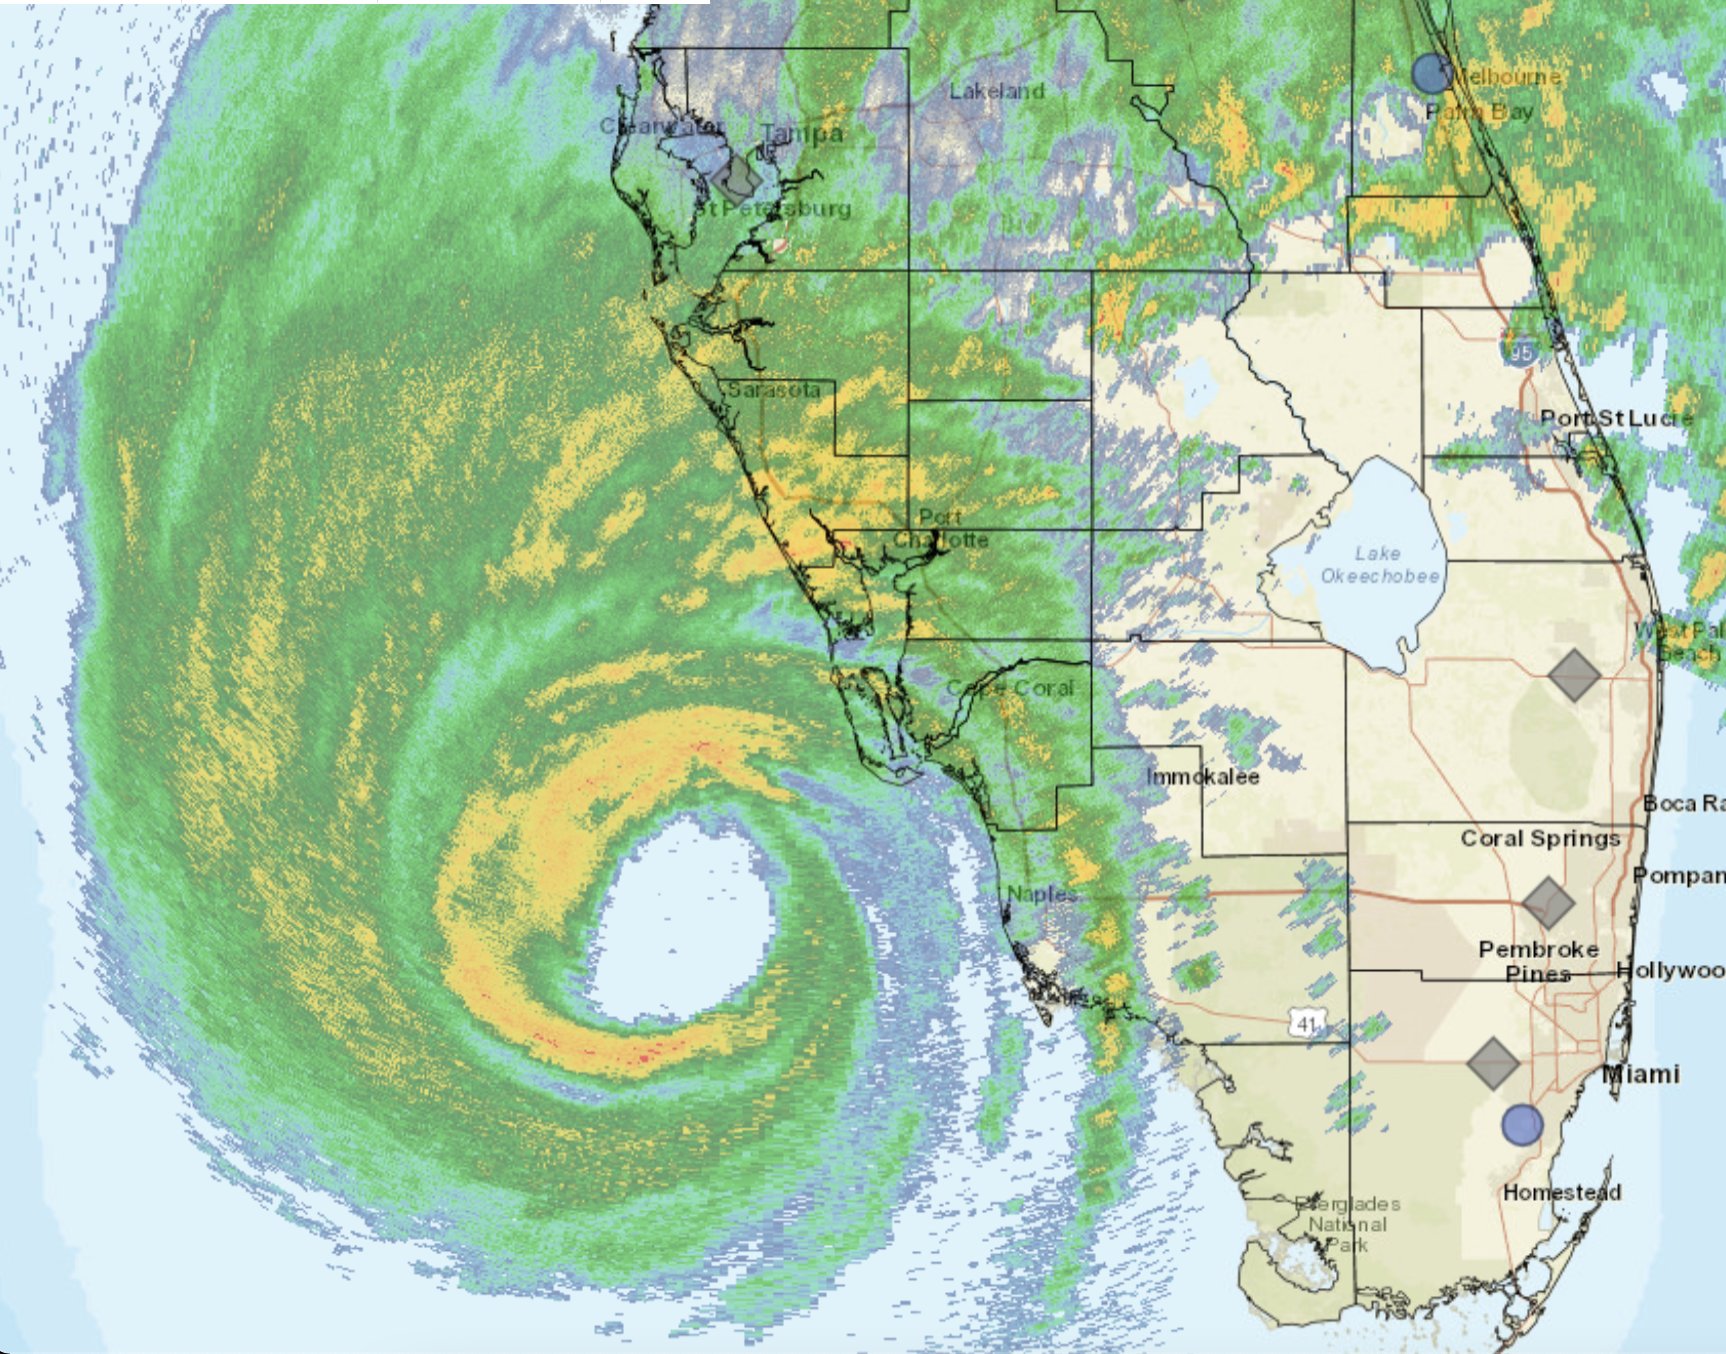
Five years later, Hurricane Ian made landfall near Fort Myers, Florida as a Category 4-5 storm on September 28, 2022. Unlike Harvey's rain, Ian brought devastating winds that peeled roofs off homes across Lee County. The storm surge added to the destruction, particularly along the coast.
Lee County's pre-storm context couldn't have been more different from Houston's. Florida's Gulf Coast was in the midst of a construction boom, with permit activity averaging 11,500 per month. That's 17 times higher than Harris County before Harvey. The immediate impact was even more dramatic than Harvey: a 98.8% drop in permit activity in the two days following the storm.
But here's where the stories diverge dramatically.
The Recovery Curves: A Tale of Two Timelines
Harvey's recovery followed what we might call the "slow build" pattern. September 2017 showed initial recovery with 2,057 permits (about 3x the pre-storm baseline). Activity stayed elevated at 2,000-3,000 permits monthly through the fall and winter. Then something unexpected happened in mid-2018: permits exploded.
July 2018 (nearly a full year after the hurricane) saw 9,762 permits. August 2018 hit the peak at 10,074 permits, a 14-fold increase over the pre-Harvey baseline. This wasn't a quick bounce back; this was a reconstruction surge that took almost a year to materialize.
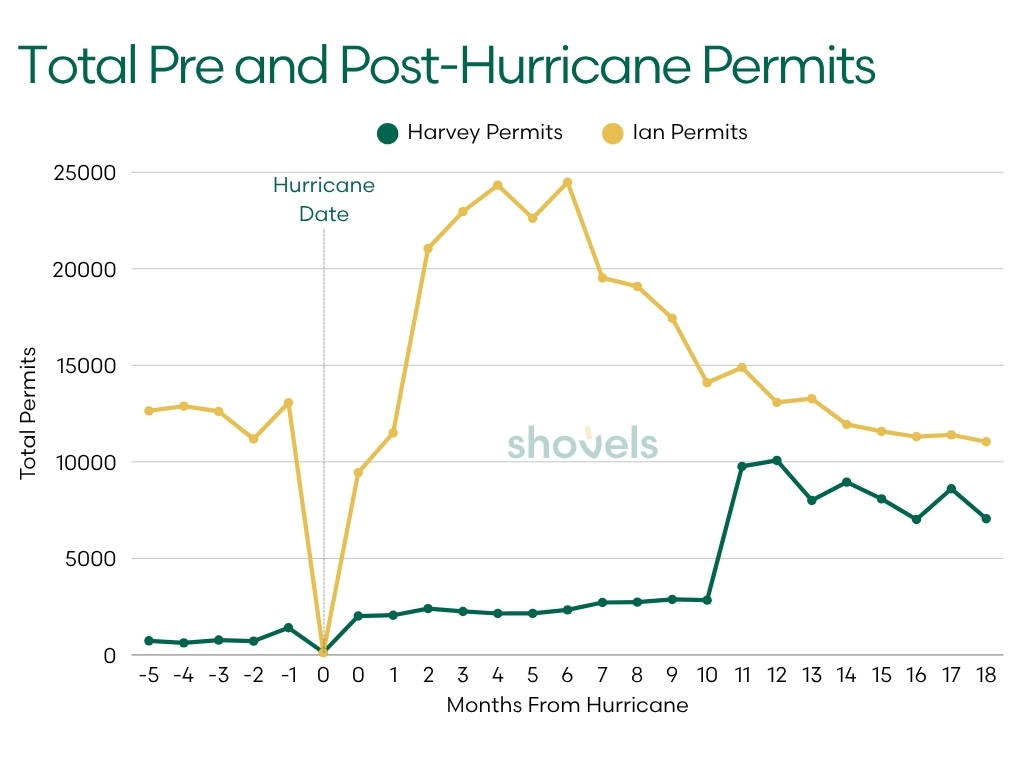 Ian's recovery, by contrast, was rapid and intense. By October 2022 (just one month post-storm), permit activity had already rebounded to pre-Ian levels at 11,502 permits. November saw 21,048 permits, nearly double the baseline. The peak came in January 2023, just four months after Ian, with 24,332 permits. By March 2024, roughly 18 months later, Lee County's permit activity had normalized back to pre-storm levels.
The question is: why such different patterns?
What the Permit Categories Tell Us
The answer lies in what was actually being rebuilt. Each permit type tells part of the story, and when you look at the categories that surged, the nature of each disaster becomes crystal clear.
Harvey's Signature: The Complete Rebuild
Harvey's most dramatic surge was in new construction permits. Before the hurricane, Harris County averaged about 20 new construction permits per month. In July 2018, that number hit 1,052 (a 52-fold increase). Over the 18-month post-Harvey period, approximately 12,000 new construction permits were issued. These weren't additions or renovations; these were brand new homes replacing ones that were completely destroyed.
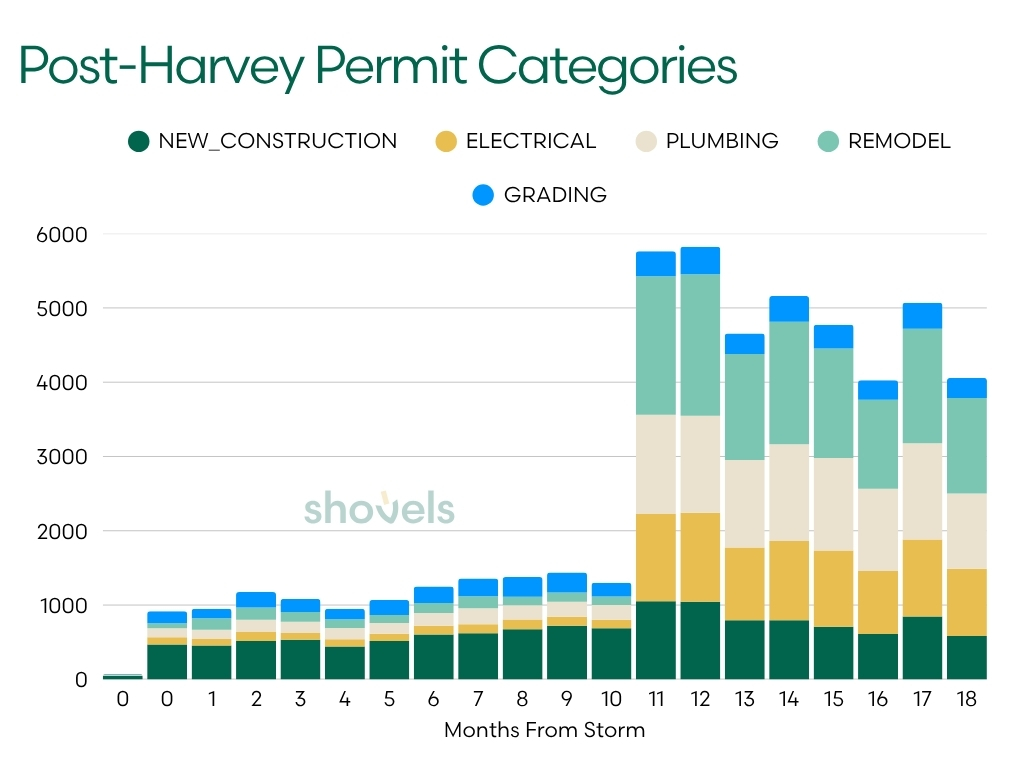
But new construction was just the headline. The supporting categories tell the fuller story of flood damage:
- Remodeling permits surged 28-fold, from 68 per month to 1,904 in August 2018. Homes that avoided complete destruction still required extensive interior work: drywall replacement, flooring, cabinetry, and other repairs after prolonged water exposure.
- Electrical permits increased 11-fold, from 100 per month to a peak of 1,197 in August 2018. When homes sit in water for days, electrical systems don't just get damaged. They get destroyed. Every outlet, every wire, every panel needs replacement.
- Plumbing permits showed a similar pattern, increasing 10-fold from 130 to 1,336 permits monthly. Flood water doesn't just affect what you can see; it contaminates entire plumbing systems, requiring complete replacement.
- Perhaps most telling were grading permits (foundation and lot preparation work). These surged from 40 per month to 371, a 9-fold increase. This isn't cosmetic work. This is homes with compromised foundations that need to be re-leveled or rebuilt from the ground up.
| MONTHS_FROM_HARVEY | NEW_CONSTRUCTION | ELECTRICAL | PLUMBING | REMODEL | GRADING |
|---|---|---|---|---|---|
| 0 - pre-storm* | 469 | 98 | 119 | 68 | 163 |
| 0 - post-storm | 48 | 7 | 3 | 6 | 9 |
| 1 | 455 | 87 | 127 | 154 | 127 |
| 2 | 517 | 121 | 165 | 165 | 207 |
| 3 | 533 | 90 | 153 | 131 | 176 |
| 4 | 443 | 96 | 151 | 119 | 141 |
| 5 | 517 | 96 | 147 | 105 | 204 |
| 6 | 604 | 117 | 172 | 134 | 222 |
| 7 | 622 | 118 | 216 | 161 | 241 |
| 8 | 674 | 131 | 193 | 115 | 264 |
| 9 | 722 | 121 | 201 | 124 | 271 |
| 10 | 687 | 116 | 196 | 115 | 185 |
| 11 | 1052 | 1175 | 1336 | 1863 | 336 |
| 12 | 1045 | 1197 | 1307 | 1904 | 371 |
| 13 | 797 | 978 | 1177 | 1429 | 275 |
| 14 | 796 | 1067 | 1302 | 1649 | 347 |
| 15 | 709 | 1024 | 1246 | 1476 | 317 |
| 16 | 609 | 851 | 1104 | 1198 | 263 |
| 17 | 847 | 1037 | 1293 | 1541 | 353 |
| 18 | 583 | 906 | 1014 | 1283 | 271 |
*Note on the data: Hurricane Harvey hit on August 25, 2017, splitting the month into two periods. The table shows both pre-storm activity (August 1-24: ~84 permits/day) and post-storm activity (August 25-31: ~19 permits/day), revealing an immediate 77% drop in daily permit activity.
Ian's Signature: The Roof Replacement Tsunami
If Harvey's signature was comprehensive reconstruction, Ian's was laser-focused on one category: roofing. The numbers are staggering.
Before Ian, Lee County averaged about 1,500 roofing permits per month. By November 2022, just six weeks after the storm, that number had jumped to 8,472. December saw 9,355 roofing permits. January 2023 hit the peak at 10,326. February and March remained above 9,000 each.
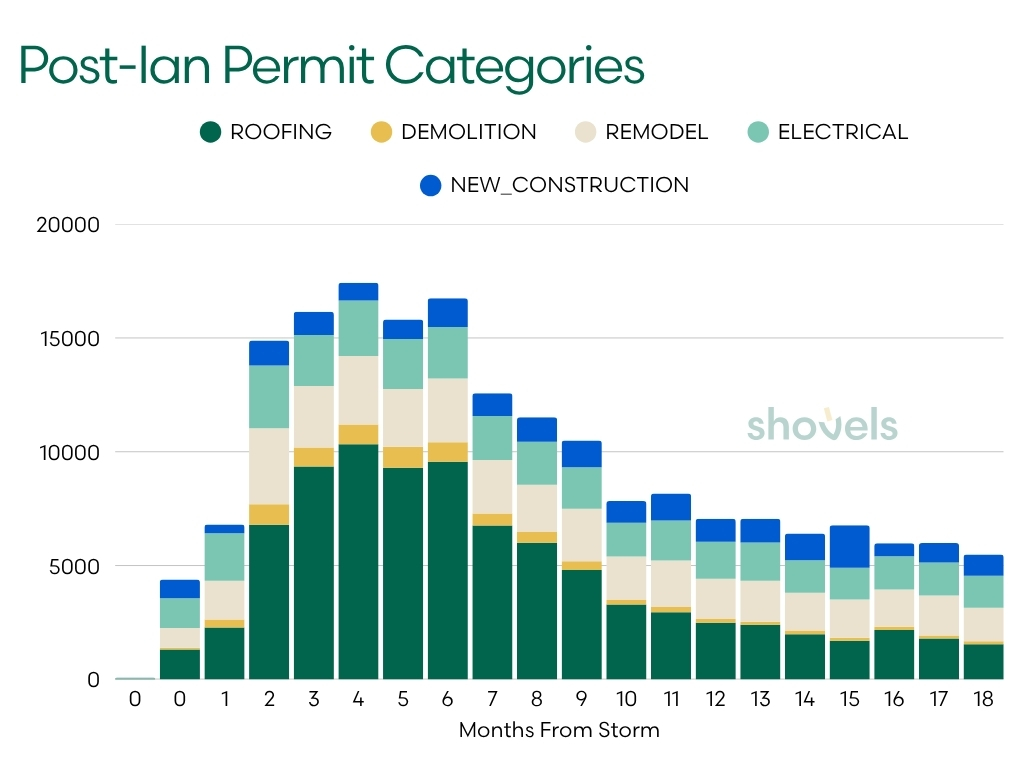
In just four months (December 2022 through March 2023), Lee County issued 38,538 roofing permits. To put that in perspective, that's more than two years' worth of normal roofing activity compressed into a single winter.
This is the unmistakable signature of catastrophic wind damage. When a Category 4-5 hurricane tears across a landscape, roofs don't just leak. They disappear. Shingles, tiles, entire sections of decking get ripped away. And unlike foundation damage that requires extensive engineering, a missing roof is obvious, assessable, and fixable.
But Ian had another telling category surge: demolitions. Pre-storm, Lee County averaged about 65 demolition permits per month. In December 2022, that number hit 914 (a 14-fold increase). These were structures so damaged they couldn't be saved. Yet even with this massive demolition activity, Ian generated far less new construction than Harvey. Most structures, despite losing their roofs, remained salvageable.
| MONTHS_FROM_IAN | ROOFING | DEMOLITION | REMODEL | ELECTRICAL | NEW_CONSTRUCTION |
|---|---|---|---|---|---|
| 0 - pre-storm* | 1314 | 70 | 874 | 1307 | 827 |
| 0 - post-storm | 36 | 0 | 8 | 22 | 20 |
| 1 | 2273 | 359 | 1704 | 2082 | 380 |
| 2 | 6796 | 895 | 3345 | 2756 | 1099 |
| 3 | 9355 | 832 | 2702 | 2246 | 1016 |
| 4 | 10326 | 874 | 3009 | 2432 | 785 |
| 5 | 9302 | 914 | 2544 | 2190 | 856 |
| 6 | 9555 | 858 | 2800 | 2265 | 1270 |
| 7 | 6762 | 520 | 2350 | 1937 | 999 |
| 8 | 5998 | 478 | 2070 | 1890 | 1076 |
| 9 | 4799 | 390 | 2309 | 1816 | 1179 |
| 10 | 3293 | 195 | 1909 | 1481 | 955 |
| 11 | 2944 | 229 | 2052 | 1754 | 1182 |
| 12 | 2481 | 174 | 1762 | 1631 | 1010 |
| 13 | 2395 | 137 | 1798 | 1684 | 1039 |
| 14 | 1977 | 167 | 1662 | 1424 | 1183 |
| 15 | 1694 | 137 | 1673 | 1399 | 1870 |
| 16 | 2167 | 141 | 1637 | 1459 | 572 |
| 17 | 1789 | 142 | 1755 | 1443 | 856 |
| 18 | 1544 | 131 | 1474 | 1403 | 937 |
*Note on the data: Hurricane Ian hit on September 28, 2022, splitting the month into two periods, hence two month 0 rows. The table shows both pre-storm activity (September 1-27: ~86 permits/day across categories) and post-storm activity (September 28-30: ~29 permits/day), revealing an immediate 66% drop in daily permit activity.
Disaster Signatures Compared
The contrast between Harvey and Ian becomes even clearer when we look at which permit categories surged the most. Each hurricane left its own distinct fingerprint in the data—what we might call a "disaster signature." Harvey's signature screams foundation and infrastructure damage: massive increases in new construction, electrical, plumbing, and grading work. Ian's signature tells a completely different story, dominated by an unprecedented roofing surge and structural demolitions.
The chart below visualizes these signatures, showing how many times above baseline each category peaked during recovery:
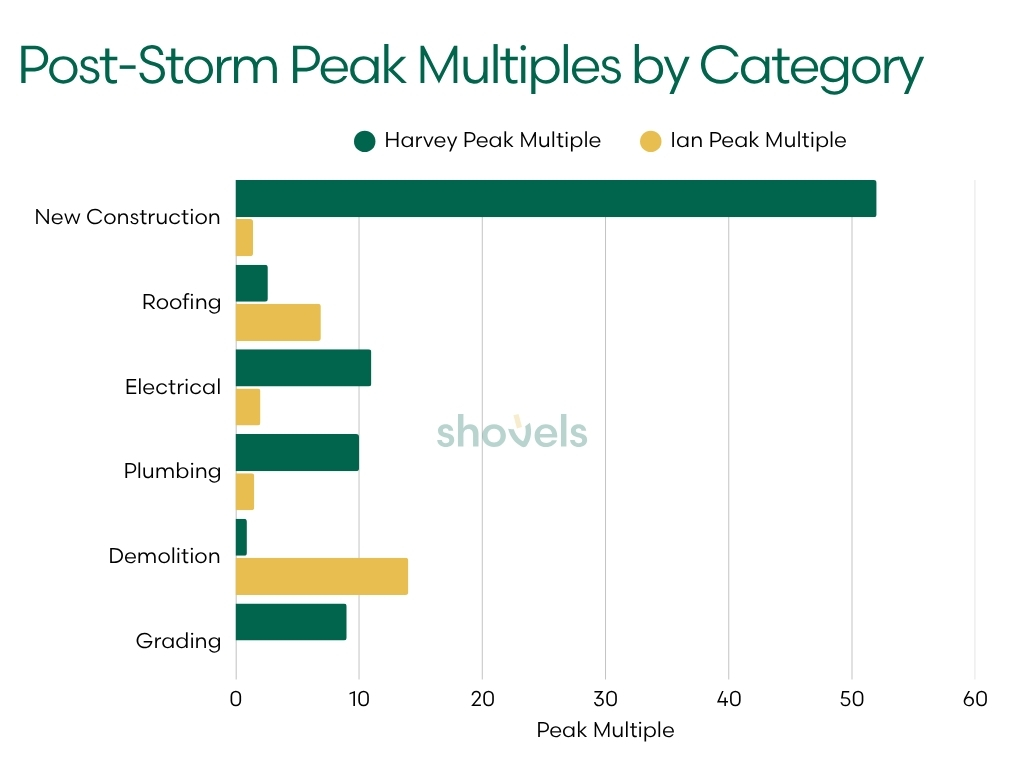
These dramatically different disaster signatures—Harvey's foundation-and-infrastructure rebuild versus Ian's roof-replacement tsunami—reveal what kind of damage each hurricane inflicted. But they don't explain the timing mystery at the heart of our analysis. Why did one recovery surge almost immediately while the other took nearly a year to materialize?
The 11-Month Mystery: Why Harvey Took So Long to Peak
One of the most striking findings in our analysis is the timing difference. Why did Harvey's reconstruction peak nearly a year after the storm, while Ian's peaked in just three to four months?
The answer lies in the complexity of flood recovery versus wind damage recovery.
When flood water destroys a home's foundation, you can't just start rebuilding. First comes assessment: is the foundation salvageable? Does the entire structure need to be demolished? Then comes engineering: how do we build it back better to prevent future flooding? Should it be elevated? Does the lot need regrading?
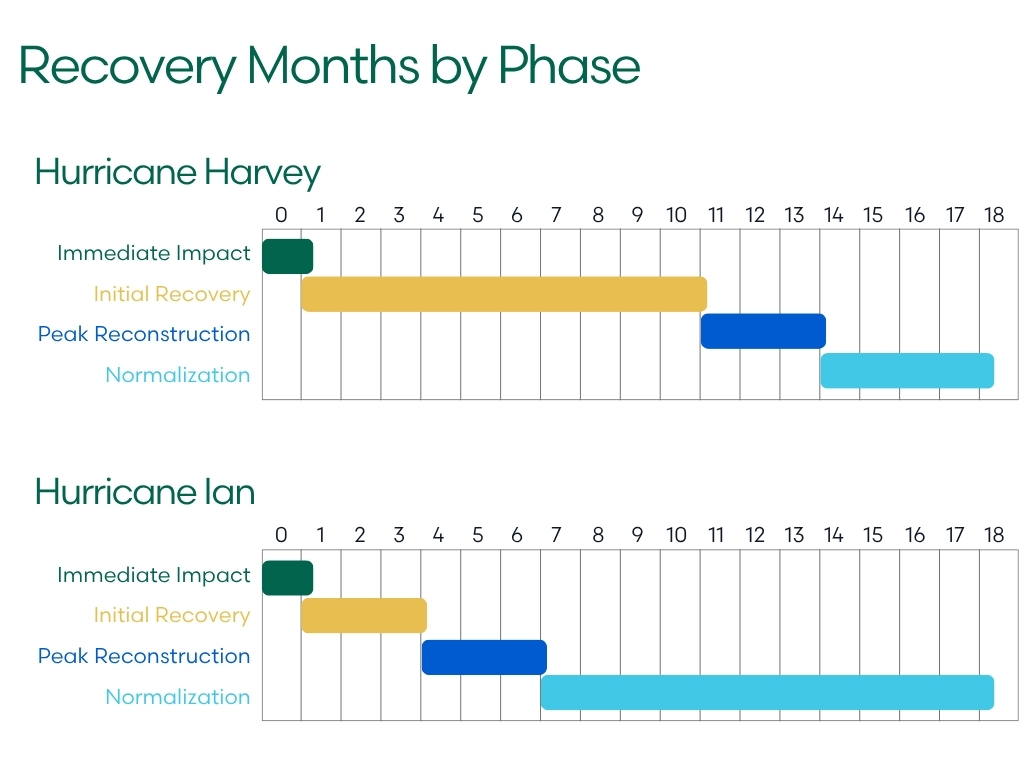
All of this requires time and expertise. But the real delay comes from financing. Flood insurance in the United States runs through the National Flood Insurance Program (NFIP), and NFIP claims are notoriously slow to process. Add to that FEMA Individual Assistance grants, which can take six to nine months to disburse, and homeowner loans that require complete damage assessments before approval.
The July-August 2018 spike, nearly a year post-Harvey, represents the moment when all these pieces finally came together: insurance settlements arrived, FEMA grants were disbursed, and homeowners secured financing for complete rebuilds. It's not that people were waiting to rebuild. They were waiting for the means to do so.

Ian's recovery moved faster because wind damage is fundamentally different. A missing roof is immediately visible and assessable. Insurance adjusters can inspect it within days or weeks, not months. Standard homeowner's insurance processes wind damage claims much faster than NFIP processes flood claims. And crucially, roof replacement doesn't require the extensive engineering review that foundation work demands.
Lee County also had another advantage: established capacity. With 11,500 permits per month pre-storm, the county already had robust contractor networks, building department infrastructure, and supply chains in place. When disaster struck, the system could absorb the surge. Harris County, processing just 680 permits monthly before Harvey, had to build that capacity from scratch.
What This Means: Using Permit Data to Prepare and Respond
The differences between Harvey and Ian aren't just academic—they reveal how different industries should prepare for and capitalize on hurricane recovery opportunities. Here's how permit intelligence transforms disaster response across key sectors.
For Contractors and Construction Companies
Permit data reveals when and where to position your resources. If you're in flood-prone regions like the Gulf Coast, the Harvey pattern tells you to prepare for a marathon, not a sprint. New construction and foundation work will surge 10-12 months after the storm when insurance settlements and FEMA grants finally materialize. Your capacity planning should account for 18+ months of elevated demand, not the 6-month emergency window most contractors plan for.
For coastal areas facing wind damage risk, the Ian pattern demands rapid mobilization. Roofing capacity is everything—you have a 3-6 month window to capture market share when demand peaks at 7x normal levels. Companies that can mobilize crews from other states within weeks, not months, dominate recovery work.
Action steps with Shovels data:
- Monitor permit trends in your target markets to identify baseline activity levels before disaster strikes
- Use historical permit data to forecast recovery timelines based on disaster type (flood vs. wind)
- Track competitor activity through our permit and contractor records to understand market share dynamics
- Identify emerging opportunities in adjacent markets during the recovery normalization phase
- Explore Shovels data to build your disaster response playbook
For Building Material Suppliers
When 38,000 roofs need replacement in four months—as they did after Ian—supply chain positioning becomes a competitive advantage worth millions. The permit data shows you exactly when and where demand will surge, allowing you to pre-position inventory and secure logistics capacity before competitors react.
The Harvey pattern reveals a different opportunity: gradual, sustained demand for foundation materials, framing lumber, electrical supplies, and plumbing fixtures that lasts 18+ months. This longer timeline allows for more strategic inventory management, but it also means maintaining relationships with distributors and contractors throughout a multi-year recovery cycle.
Action steps with Shovels data:
- Track permit volumes by category (roofing, electrical, plumbing) to forecast material demand by product line
- Identify top contractors by permit volume to prioritize outreach, foster relationship building, then working with your distributors to accomplish this
- Monitor permit processing times to predict when materials will actually be needed on site
- Use geographic permit clustering to optimize distribution center locations and delivery routes
- Contact us to discuss enterprise data access for supply chain planning
For Insurance Companies
The timing difference between Harvey (11-12 month peak) and Ian (3-4 month peak) has profound implications for claims processing, loss reserves, and catastrophe modeling. Flood claims create cascading losses as foundation damage reveals additional structural issues during reconstruction. Wind claims concentrate in the first 3-6 months with clearer initial assessments.
Permit data provides ground truth for claims validation and fraud detection. When a policyholder claims major structural damage, their permit activity—or lack thereof—tells the real story. The ratio of roofing permits to new construction permits in an affected area reveals whether structures were repairable or required complete replacement.
Action steps with Shovels data:
- Benchmark actual reconstruction activity against claims reserves to refine catastrophe models
- Use permit timelines to forecast cash flow needs for claims payments by disaster type
- Identify areas with elevated new construction permits post-disaster for updated property valuations
- Cross-reference permit records with claim files for fraud detection and validation
- Monitor contractor permit activity to build preferred contractor networks for managed repair programs
- Note: Enterprise access available with SOC2 compliance for sensitive use cases
For Real Estate and Site Selection
Disaster recovery creates both risk and opportunity in real estate markets. The permit data reveals which neighborhoods are rebuilding and which are being abandoned. Areas with surging new construction permits 12-18 months post-disaster represent communities with strong recovery capital and resident commitment—leading indicators of long-term resilience.
For site selection, understanding pre-disaster permit baselines helps you distinguish between genuine growth markets and temporary recovery spikes. Lee County's 11,500 permits/month before Ian indicated a robust, growing market. That market returned to baseline within 18 months, confirming its fundamental strength.
Action steps with Shovels data:
- Track post-disaster permit activity to identify neighborhoods with strong recovery investment
- Compare permit velocities across markets to distinguish growth from recovery activity
- Use permit density and property investment patterns to develop "resilience scores" for markets
- Monitor infrastructure permits (electrical, plumbing, HVAC) as leading indicators of property value recovery
- Sign up for free to explore permit patterns in your target markets
.jpg)
For Government and Emergency Management
Permit data should be a cornerstone of disaster preparedness and response planning. Understanding your jurisdiction's baseline permit processing capacity—and how it compares to disaster-affected counties—helps you prepare realistically for surge demand.
Harris County processed 680 permits/month pre-Harvey and needed to scale to 10,000 permits/month at peak—a 15x increase. If your jurisdiction handles similar volumes, you know exactly what staffing, technology, and process improvements are needed to avoid becoming a bottleneck to recovery.
Action steps with Shovels data:
- Establish baseline permit volumes and processing times for surge capacity planning
- Identify permit types most likely to surge based on your region's disaster risk profile (flood vs. wind)
- Pre-position expedited review processes for high-volume categories (roofing, electrical, plumbing)
- Monitor permit timelines across all departments to identify bottlenecks before they delay recovery
- Use permit data from comparable jurisdictions to forecast recovery timelines for planning exercises
For Climate Tech and Energy Companies
Both Harvey and Ian revealed clear electrification and energy infrastructure patterns. Solar permit activity, heat pump installations, and EV charger deployments all pause during immediate recovery but often surge as homeowners rebuild with modern systems. The "build back better" mentality during reconstruction creates a unique window for clean energy adoption.
Post-disaster reconstruction represents the largest forced home improvement cycle most homeowners will ever face. When you're already replacing HVAC systems, electrical panels, and roofing, the incremental cost of upgrading to heat pumps, solar, or battery storage becomes much more palatable.
Action steps with Shovels data:
- Track pre-disaster solar and heat pump permit rates to identify high-potential markets
- Monitor post-disaster electrical permits as leading indicators for solar and battery storage opportunities
- Identify contractors pulling multiple solar/HVAC/electrical permits to build installation networks
- Use permit timelines to time outreach when homeowners are making rebuild decisions (months 6-12 post-flood)
- Explore energy permit data to identify electrification trends
For Telecommunications Companies
Infrastructure rebuilds after major disasters offer rare opportunities to deploy fiber and broadband to entire neighborhoods simultaneously. The permit data shows you exactly where reconstruction is happening and when—allowing you to coordinate conduit installation with street reconstruction, building upgrades with fiber drops, and new construction with modern connectivity infrastructure.

The Harvey data showed sustained infrastructure work over 18 months. The Ian data showed concentrated reconstruction in 3-6 months. These timelines determine whether you can take a strategic, planned approach to infrastructure deployment or need rapid-response crews ready to mobilize immediately.
Action steps with Shovels data:
- Monitor electrical and new construction permits to identify properties needing connectivity infrastructure
- Track street and infrastructure permits to coordinate conduit and fiber installation
- Identify top contractors by permit volume for strategic partnerships on integrated installations
- Use permit processing timelines to forecast when properties will be ready for service activation
The Economic Scale
The permit data also reveals the staggering economic impact of these disasters on the construction industry.
Harvey generated approximately 95,000 permits over the 18-month post-storm period we analyzed. With new construction averaging $250,000-$350,000 per home and repairs averaging $50,000-$100,000, the total construction value likely reached $15-25 billion. This isn't insurance payouts or economic impact. This is actual construction spending that flowed through the Houston economy over 18 months.
Ian generated roughly 315,000 permits over the same timeframe (more than three times Harvey's count). However, because roofing permits averaged $15,000-$25,000 rather than full rebuilds at $250,000+, the total construction value was comparable at $20-35 billion despite the higher permit count.
These numbers represent an economic injection roughly equivalent to building several large stadiums or airport terminals. Except it's distributed across thousands of contractors, suppliers, and workers rather than a few large firms. It's a massive, distributed reconstruction economy that emerges from disaster.
A Changing Climate, Changing Patterns
As we write this article in late 2025, climate scientists continue to warn that hurricane intensity is increasing. Warmer ocean temperatures fuel stronger storms. Rising sea levels amplify storm surge. And atmospheric changes are making hurricanes more likely to stall (like Harvey did), creating extreme rainfall events.
This means the patterns we've documented aren't just historical curiosities; they're prologue.

Source: United States Environmental Protection Agency (EPA)
Communities across the Gulf Coast and Atlantic seaboard will face more Harveys and more Ians. Understanding how these disasters propagate through permit systems (and what those permits reveal about the pace and nature of recovery) becomes increasingly vital for resilience planning.
The permit data doesn't lie. It shows us, with brutal clarity, what actually happens when disaster strikes: the immediate collapse of normal activity, the slow or fast return to reconstruction, and the eventual new normal. It shows us which communities recover quickly and which face years of rebuilding. And perhaps most importantly, it shows us that preparation matters.
Lee County's robust pre-storm construction capacity enabled faster recovery from Ian. Harris County's modest pre-storm baseline meant Harvey required not just rebuilding homes but building the entire capacity to rebuild homes. The lesson is clear: resilience isn't just about building codes and flood walls. It's about maintaining the economic and regulatory infrastructure to bounce back when (not if) disaster strikes.
Looking at Your Own Community
If you're reading this from a hurricane-prone region, the question isn't whether your community will face a major storm. The question is when, and whether you'll recover like Ian or like Harvey.
The answer depends partly on factors you can't control: will it be wind or flood, how intense, how long it lasts. But it also depends on factors you can control: your building codes, your permit processing capacity, your contractor networks, and your insurance systems.
The permit data from Harvey and Ian provides a roadmap. Flooding requires long-term capacity and patient capital. Wind damage requires rapid mobilization and surge capacity. Both require strong institutions that can handle 10-20 times their normal workload while maintaining quality and safety.
Most importantly, both require understanding that recovery isn't measured in news cycles or political timelines. It's measured in permits: those unglamorous bureaucratic documents that represent families moving back into homes, businesses reopening, and communities rebuilding.
The permits tell the story. We just need to listen.
Methodology
Data Source: This analysis uses permit data from Shovels' proprietary database, which tracks building permits across thousands of U.S. jurisdictions.
Geographic Scope:
- Hurricane Harvey: Harris County, Texas (includes Houston metropolitan area)
- Hurricane Ian: Lee County, Florida (includes Fort Myers and Cape Coral)
Time Period: 18 months before each hurricane through 18 months after (36 months total per hurricane)
Hurricane Dates:
- Hurricane Harvey: August 25, 2017
- Hurricane Ian: September 28, 2022
🔍 Dig Deeper: Shovels tracks 185M+ permits being worked on by 3.3M+ contractors across 2K+ jurisdictions. Explore the data yourself with a free Shovels account or contact sales today to unlock comprehensive permit intelligence for your business.
❓ Have ideas for future reports? Let us know what permit data you think we should report on.