

Unless noted, all data shared was pulled directly from the Shovels platform. Start a free trial here.
Introduction: Is the Florida Housing Market Crashing?
Florida's housing market is facing strong pressure from multiple directions. Home prices are stagnating or declining across many regions, with condos in some areas experiencing double-digit drops. Net migration to the state has slowed considerably from its pandemic-era peak, and insurance costs continue to weigh on affordability, with premiums staying high as insurance providers continue to leave the market.
Homeowners, prospective buyers, and developers are asking: is the Florida housing boom over, or will the market rebound in 2026 and 2027? To help answer these questions, our report examines what construction-side leading indicators from building permit data say about the next two years.
Why Permit Data Matters for Housing Market Forecasts
Housing market analysis often relies on backward-looking indicators such as closed sales, median prices, and days on market. While this data is crucial, it provides only a limited lens. By the time metrics like median prices start to shift, the trend has likely been underway for months.
Permit data looks back to before the house hits the market. When builders pull permits, construction typically follows in three to six months for smaller builds, and up to 24 months or more for large residential developments. When construction starts, home sales follow in 12 to 18 months. This makes permit activity a leading indicator of what builders, who commit capital based on market assessments, believe about the future. In other words, the permits issued today will shape Florida's housing supply through 2027.
Methodology
We analyzed building permit data across 125 Florida jurisdictions where Shovels has consistent data records year-over-year. While this does not represent every jurisdiction in Florida, these markets account for ~70% of total permit coverage in the Shovels Florida dataset and a significant share of the state's construction activity. They include major population centers across the Tampa Bay area, South Florida, and the Gulf Coast. We also validated these trends against broader market indicators and found them to be directionally consistent with statewide patterns.
All permit counts are filtered by issue date, exclude inactive permits, and require a valid approval duration on record. This methodology provides a cleaner signal of when construction activity was actually green-lit rather than when applications were submitted.
Executive Summary:
Florida's construction market has cooled, but according to our data, this is a correction, not a crash. Builders are cautiously re-entering the market after adjusting to higher rates and insurance costs.
The headlines:
- Total permits are down 6% in 2025, following a 12% drop in 2024—but the decline is slowing.
- New construction increased YoY after a steep decline (+3.8% in 2025 after a 15% drop).
- Residential new construction slowed long before housing market peaks, but levels are stabilizing.
- National builders are pulling back on Florida permits, with D.R. Horton down 65% from its 2023 peak, a trend confirmed by its own earnings disclosures, creating openings for regional and local operators.
- Tampa Bay sees YoY growth while new construction slows in other regions (+18-42% growth YoY across the Tampa Bay region).
Florida Construction Activity Suggests the Housing Market Is Stabilizing
Housing market confidence isn't captured by new home sales alone. Total building permit activity, which includes renovations, repairs, upgrades, and new construction, can provide a distinctive lens into how homeowners, contractors, and builders are behaving and how they perceive the market. When building permits rise, it usually signals capital investment and long-term confidence. When they fall, it reflects caution.
Permit counts in Florida peaked in 2023. In retrospect, this year likely marked the tail end of pandemic-era construction activity fueled by low interest rates and strong migration into the state.
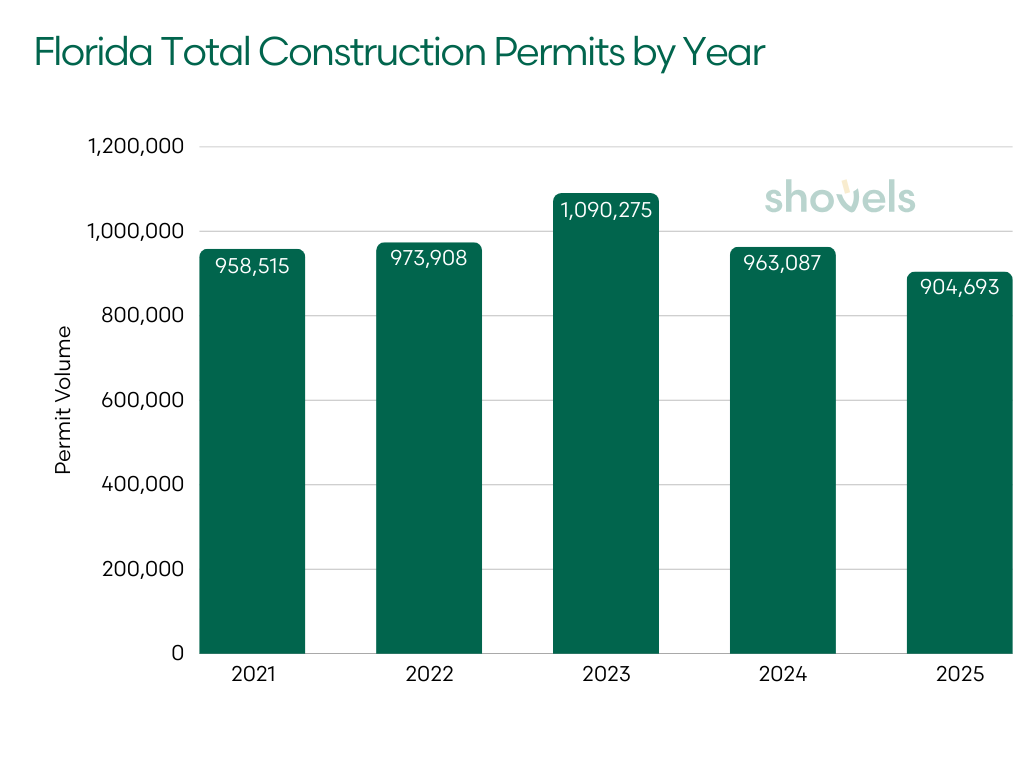
| YEAR | ALL PERMITS | YoY |
|---|---|---|
| 2021 | 958,515 | — |
| 2022 | 973,908 | +1.6% |
| 2023 | 1,090,275 | +12.0% |
| 2024 | 963,087 | -11.7% |
| 2025 | 904,693 | -6.1% |
As borrowing costs rose and insurance premiums surged, builders, contractors, and homeowners pulled back. Total permit volume fell nearly 12% in 2024. The 2025 data shows a smaller 6% decline. While activity is still contracting, the pace of decline has slowed, suggesting a stabilizing market.
Zooming In: New Construction Sees Small Uptick
While total permits reflect broad market health, new construction permits are the most direct indicator of future housing supply. These permits represent new homes and residential developments that will enter Florida's housing stock over the next 12–24 months.

| YEAR | NEW_CONSTRUCTION | % OF TOTAL PERMITS | YoY |
|---|---|---|---|
| 2021 | 66,174 | 6.9% | — |
| 2022 | 66,196 | 6.8% | +0.03% |
| 2023 | 71,659 | 6.6% | +8.3% |
| 2024 | 60,738 | 6.3% | -15.3% |
| 2025 | 63,066 | 7.0% | +3.8% |
New construction, representing between 6-7% of total permit activity, followed a similar trajectory to overall permits: growth through 2023, a sharp pullback in 2024, and early signs of stabilization in 2025. The 3.8% increase in 2025 is modest but meaningful. Builders are once again committing capital, signaling that they see sufficient demand to justify new starts despite elevated rates and insurance costs.
The homes permitted in 2025 will likely come onto the market in late 2026 and 2027, making them a key test of whether demand holds at current price levels.
Residential New Construction: Inventory Could Stabilize at Lower Levels
Narrowing new construction to look only at residential builds, we see that the construction decline wasn't limited to 2024. Residential new builds have been slowing since 2022.
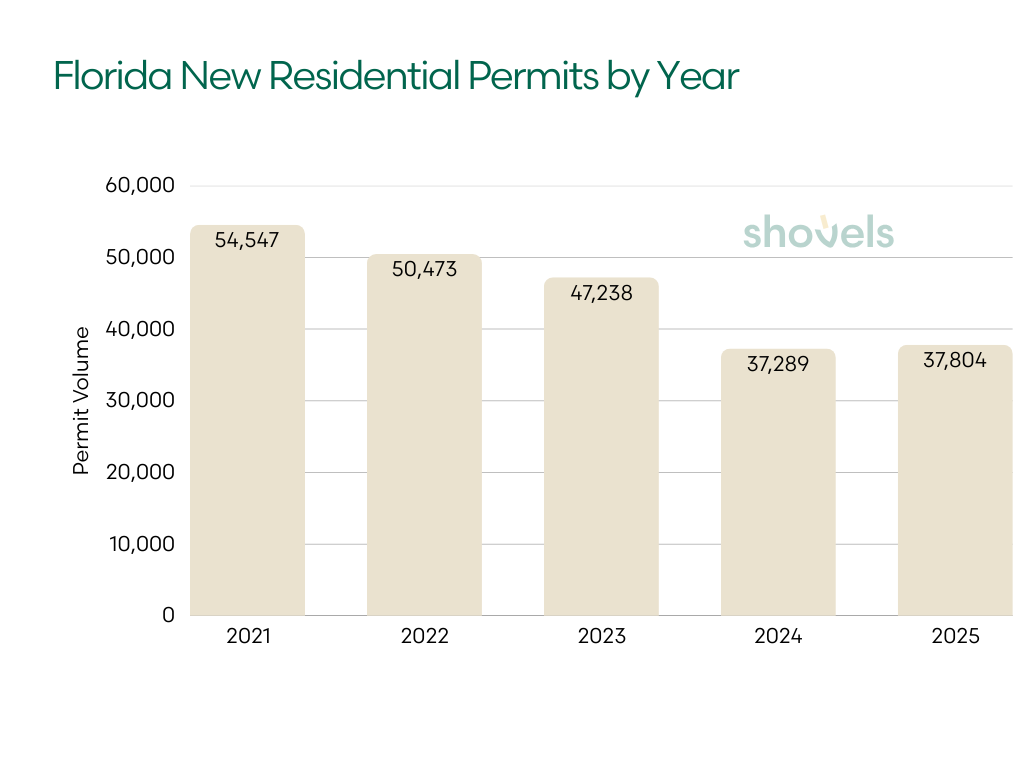
| YEAR | RESIDENTIAL* | YoY |
|---|---|---|
| 2021 | 54,547 | — |
| 2022 | 50,473 | -7.5% |
| 2023 | 47,238 | -6.4% |
| 2024 | 37,289 | -21.1% |
| 2025 | 37,804 | +1.4% |
*Residential includes: single family homes, mobile/manufactured homes, multi-family housing, duplexes, townhouses, and some apartments. What's excluded: vacant land, condominiums, and large apartment buildings.
Residential permits declined steadily from 2021 through 2023 even while total permits and construction were still expanding. In other words, the core housing market began softening well before the headline numbers reflected it.
The sharp 21% drop in 2024 likely marked the cyclical low. The slight 1.4% uptick in 2025 suggests builder confidence may be stabilizing, though at materially lower levels.
At current volumes, Florida is permitting 31% fewer homes annually than in 2021. If population growth and demand remain steady, this tighter supply pipeline could continue to support home prices even as today's inventory overhang works through the system.
The Takeaway: Construction activity peaked in 2023 and corrected sharply in 2024, but the decline is slowing and new construction is ticking back up. Residential construction started cooling before the rest of the market, but also stabilized in 2025.
National Builders D.R. Horton and Lennar Pulling Back in Florida
Nationally, major U.S. homebuilders are navigating a broad slowdown in new construction activity. D.R. Horton, Lennar, PulteGroup, and others have responded to softer sales by leaning heavily on incentives: cutting prices, offering mortgage rate buydowns, and increasing concessions to maintain absorption.
That national trend is reflected in their Florida permit activity. For most large builders, the pullback appears less like an outright retreat and more like a strategic recalibration, slowing new starts to preserve capital and protect margins.
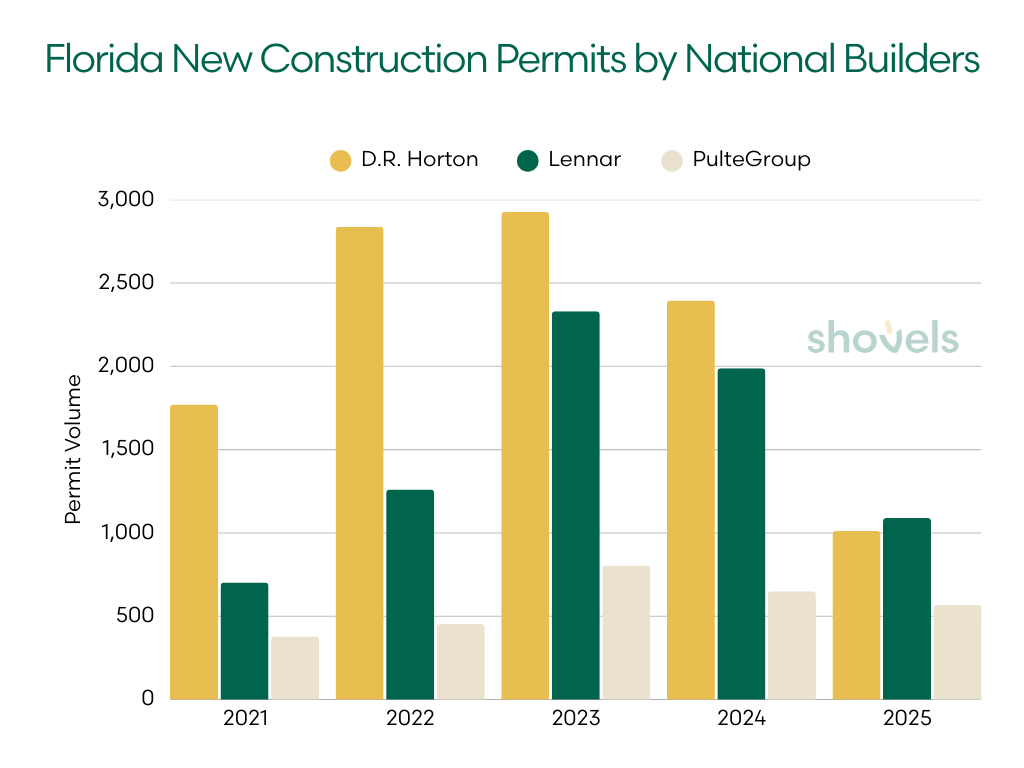
| BUILDER | 2021 | 2022 | 2023 | 2024 | 2025 | PEAK TO 2025 |
|---|---|---|---|---|---|---|
| D.R. Horton | 1,771 | 2,837 | 2,926 | 2,395 | 1,012 | -65% from peak |
| Lennar | 702 | 1,261 | 2,330 | 1,988 | 1,090 | -53% from peak |
| PulteGroup | 378 | 453 | 804 | 650 | 567 | -29% from peak |
A note on methodology: These figures reflect permits filed under each builder's primary brand name. Large national builders frequently file permits through project-specific subsidiaries and LLCs that are not consistently linked to the parent company in permit records. Actual construction activity, particularly for Lennar, which operates extensively through master-planned community entities, may be higher than these figures reflect.
While statewide new construction was up 3.8% in 2025, D.R. Horton, the country's largest homebuilder, saw permits filed under its brand name drop 65% from its 2023 peak. This directional finding is consistent with the company's own public statements: on its Q2 2025 earnings call, CEO Paul Romanowski noted that softer conditions in Texas and Florida had caused the company to pull back on starts in response to market conditions.
For Lennar, the story is more complex. Permit data shows a 53% decline from its 2023 peak, but Lennar builds extensively through master-planned community structures (including Lakewood Ranch and other large-scale projects) that often file permits under entity-specific LLCs. Lennar's earnings reports show the company delivered over 80,000 homes nationally in fiscal 2024, with Florida representing a substantial share of total production. The permit-level decline likely reflects a real reduction in activity, but the magnitude of decline could be much smaller.
PulteGroup's relative resilience (down only 29%) likely reflects its focus on move-up buyers rather than the entry-level segment where affordability pressures are most severe. This is supported by PulteGroup's consistently strong gross margins and continued community expansion in Florida, including new Del Webb projects in Manatee County. Even with the caveats, as national builders recalibrate, regional and local operators have room to fill the gap.
The Takeaway: Major national builders are slowing their Florida permit activity, a trend confirmed by both permit data and builder earnings reports. The pullback is real, but for builders like Lennar that operate heavily through subsidiary entities, permit data alone may understate total activity. That said, regional builders are well-positioned to capture share as national players reduce exposure.
New Construction by Jurisdiction: Local and County Permit Trends
Statewide averages can obscure meaningful regional differences. While some Florida markets have seen their inventory contract, other places are absorbing inventory and expanding. We took a selective look at jurisdictions where permit activity saw significant movement.
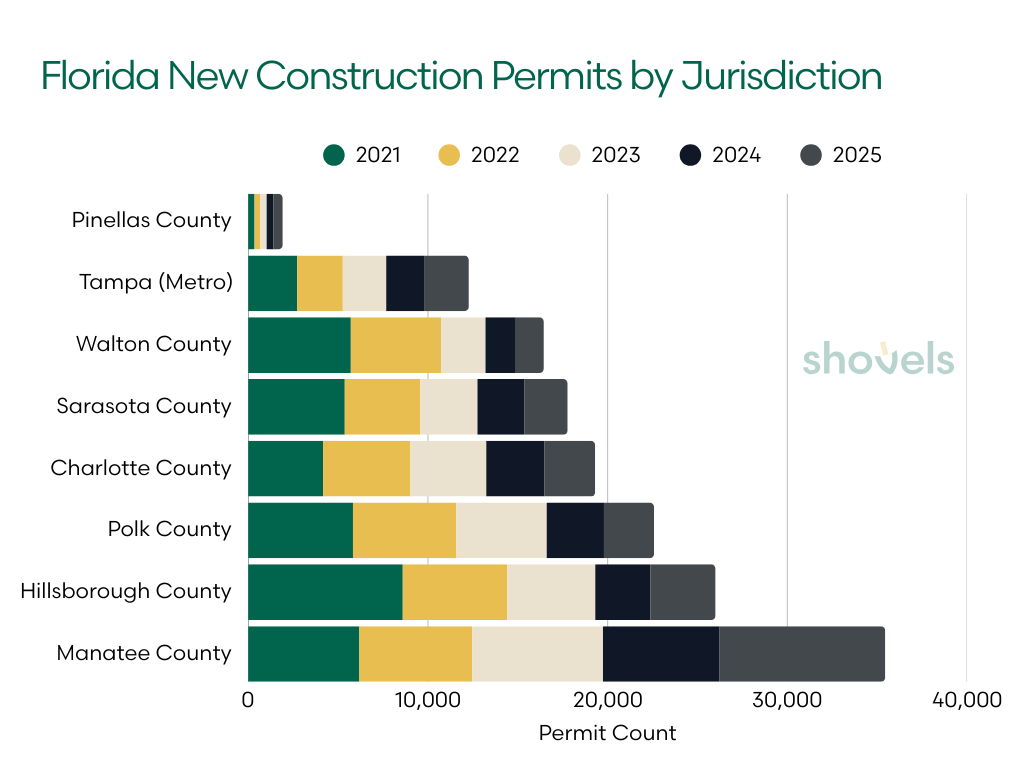
| JURISDICTION | 2021 | 2022 | 2023 | 2024 | 2025 | 2023 to 2025 Change | 2024 to 2025 Change |
|---|---|---|---|---|---|---|---|
| Manatee County | 6,183 | 6,286 | 7,272 | 6,490 | 9,220 | +26.8% | +42.1% |
| Hillsborough County | 8,599 | 5,815 | 4,900 | 3,061 | 3,633 | -25.9% | +18.7% |
| Tampa (Metro) | 2,725 | 2,538 | 2,417 | 2,105 | 2,492 | +3.1% | +18.4% |
| Pinellas County | 351 | 310 | 365 | 370 | 526 | +18.4% | +42.2% |
| Charlotte County | 4,164 | 4,860 | 4,224 | 3,227 | 2,833 | -32.9% | -12.2% |
| Polk County | 5,829 | 5,750 | 5,032 | 3,185 | 2,789 | -44.6% | -12.4% |
| Sarasota County | 5,372 | 4,197 | 3,189 | 2,601 | 2,419 | -24.1% | -7.0% |
| Walton County | 5,709 | 5,024 | 2,472 | 1,685 | 1,561 | -36.8% | -7.4% |
Table shows jurisdictions where Shovels reports consistent YoY data and saw significant movement.
Tampa Bay: A Bright Spot for New Construction
Tampa Bay permit data is bucking the trend by showing growth in 2025. Manatee County leads the region with 42% growth in new construction permits, while Pinellas County is up 42% YoY. Hillsborough County is stabilizing, with YoY growth in the 18–19% range after a significant drop off between 2021 and 2024.
This momentum reflects broader real estate trends. Tampa Bay remains one of the most attractive housing markets in the country, supported by sustained population growth and economic expansion. Although price appreciation has cooled after several years of rapid gains, the region continues to absorb new supply.
According to the Tampa Bay Builders Association, submarkets with developable land or strong infill potential are outperforming. Hillsborough County, while far below its 2021 peak, has begun to rebound. This suggests builders see renewed opportunity.
Florida's Gulf Coast Focused on Hurricane Recovery and Hurricane Preparedness
Charlotte County and the surrounding Southwest Florida markets are seeing permit declines, a pattern that reflects the impact of hurricane rebuilding. Hurricane Ian caused $362 million in damages to Charlotte County alone, triggering a surge in rebuilding activity through 2023.
Charlotte County's 12% decline and Sarasota County's 7% decline in 2025 likely represent a return to baseline as hurricane recovery work winds down. This contrasts sharply with counties in the Tampa Bay region that largely avoided damages from Ian.
Charlotte and Sarasota also saw some of the largest homeowners' insurance rate increases in the country from 2022 to 2024 due to damage from Hurricanes Ian, Helene, and Milton. The rate spikes put a strain on the demand for new homes and made hurricane preparedness in Florida a key factor in new builds.
Polk County Cooling as Emerald Coast Finds a Floor
Polk County saw permit volumes decline 12% year-over-year, part of a broader cooldown across Central Florida. This region benefited enormously from pandemic-era migration and remote work trends. As those tailwinds fade and affordability pressures mount, construction activity is likely recalibrating to sustainable levels.
There are reasons for long-term optimism. Polk County benefits from relatively lower home prices (sub-$300K in many areas) and lower insurance costs compared to coastal markets. The proposed Brightline Orlando-Tampa rail connection could boost development near future station sites.
Walton County, located on the Emerald Coast, saw new construction permits drop 7% year-over-year, but this represents a deceleration from sharper declines in previous years. The market appears to be finding its floor.
The Takeaway: Tampa Bay's permit growth suggests builders view this region as still a strong market. Southwest Florida permit declines likely reflect post-hurricane normalization, not market weakness. Construction in Central Florida, however, is cooling after years of pandemic-fueled growth.
Homeowners Invest in ADUs, but Pull Back on Discretionary Projects
Beyond forecasting construction projects, building permit data reveals how existing homeowners are spending, or not spending, on their properties, offering insight into consumer confidence and financial stress.
Nationally, homeowner expenditures for improvements and repairs remain soft. Industry research shows homeowners are still prioritizing essential, non-discretionary work while deferring big-ticket discretionary projects. Florida's permit data reveals a similar pattern.
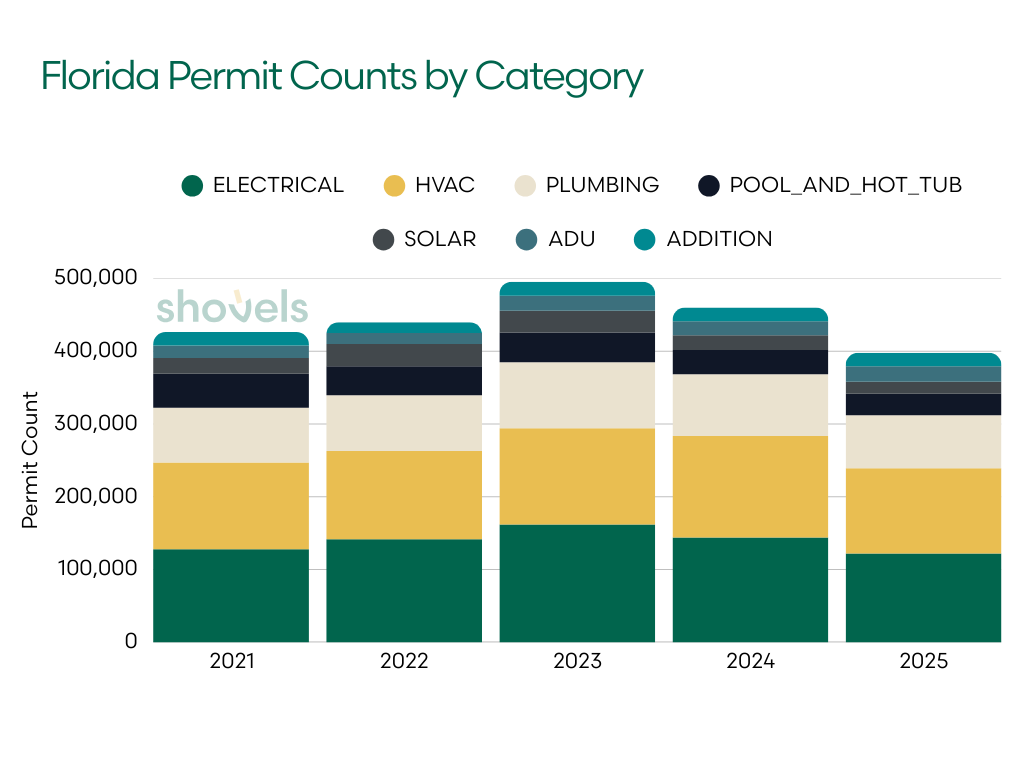
| PERMIT_TYPE | 2021 | 2022 | 2023 | 2024 | 2025 |
|---|---|---|---|---|---|
| HVAC | 119,155 | 121,398 | 132,234 | 139,740 | 117,268 |
| ELECTRICAL | 127,895 | 141,343 | 161,908 | 143,781 | 121,963 |
| PLUMBING | 75,055 | 76,786 | 90,820 | 84,678 | 72,795 |
| POOL_AND_HOT_TUB | 46,769 | 39,903 | 40,694 | 33,482 | 29,557 |
| SOLAR | 21,738 | 30,546 | 29,764 | 20,273 | 16,531 |
| ADU | 17,062 | 14,919 | 20,788 | 19,276 | 21,167 |
| ADDITION | 18,599 | 15,029 | 19,401 | 18,719 | 18,599 |
Spending Declines on Discretionary Projects Like Pools and Solar Panels
Permit volumes for pools, solar, and additions declined between 2023 and 2025, signaling growing financial caution. Among remodeling projects, additions and pools are more likely to be financed via home equity, either through a HELOC (Home Equity Line of Credit) or a cash-out refinance, while essential maintenance projects are less likely to be funded this way.
Florida pool permits have fallen 37% since 2021, reaching their lowest level in five years. This is a telling signal in a state where pools are relatively common, suggesting widespread reluctance toward large expenditures.
Solar panel installation in Florida is down 46% from its 2022 peak. Changes to net metering policies in Florida have likely reduced the financial return on solar investments and extended payback periods, making a cost vs benefit analysis necessary for many homeowners.
Essential Maintenance on HVAC, Electrical, and Plumbing Also Down
HVAC, electrical, and plumbing permits are down 14–16% year over year. These are repairs and maintenance for essential systems that trigger inspection requirements. A sustained decline could indicate fewer home sales and remodels overall, contractor pricing and capacity constraints, or calculated delays on essential maintenance. It also indexes the end of rebuilding and repairs in regions heavily impacted by hurricanes. The slowdown likely represents a mix of these factors.
This is also reflected in homeowner sentiment. More than half of DIY homeowners now feel it's a bad time to start any project over $5,000, so they're doing smaller repairs and putting off larger system replacements.
The Exception: Accessory Dwelling Units in Florida Continue to Grow
Accessory Dwelling Units (ADU) permits are up 9.8% year-over-year in the state. This fits neatly with broader national trends: nearly half of U.S. homeowners are exploring ADU construction, primarily for rental income or housing family members.
→ Deep Dive: For comprehensive analysis of nationwide ADU trends, policy impacts, and state-by-state permit data, see America's ADU Boom: What 2.8 Million Permits Reveal. Florida ranks #2 nationally with 18% of all ADU activity.
Currently, the Florida legislature is actively exploring expanding ADU regulations to combat housing shortages. ADUs often represent a welcome investment with reliable returns. Homeowners can offset construction costs with rental income, and Fannie Mae now allows projected ADU rental income to count toward mortgage qualification. In a market where affordability is stretched, ADUs offer a path to generate income from existing property.
The Takeaway: Permit types tell a story of financial caution. Homeowners are cutting discretionary spending and investing where they see direct financial return. This pattern suggests consumer caution extends beyond the housing market into broader household finances.
Processing Times Shorten as Applications Fall
Processing times for new construction permits have improved meaningfully over the past three years. The improvement likely comes from lower application volumes rather than efficiency gains. For builders and homeowners however, shorter approval times can reduce carrying costs and project uncertainty, making it a silver lining in a contracting market.
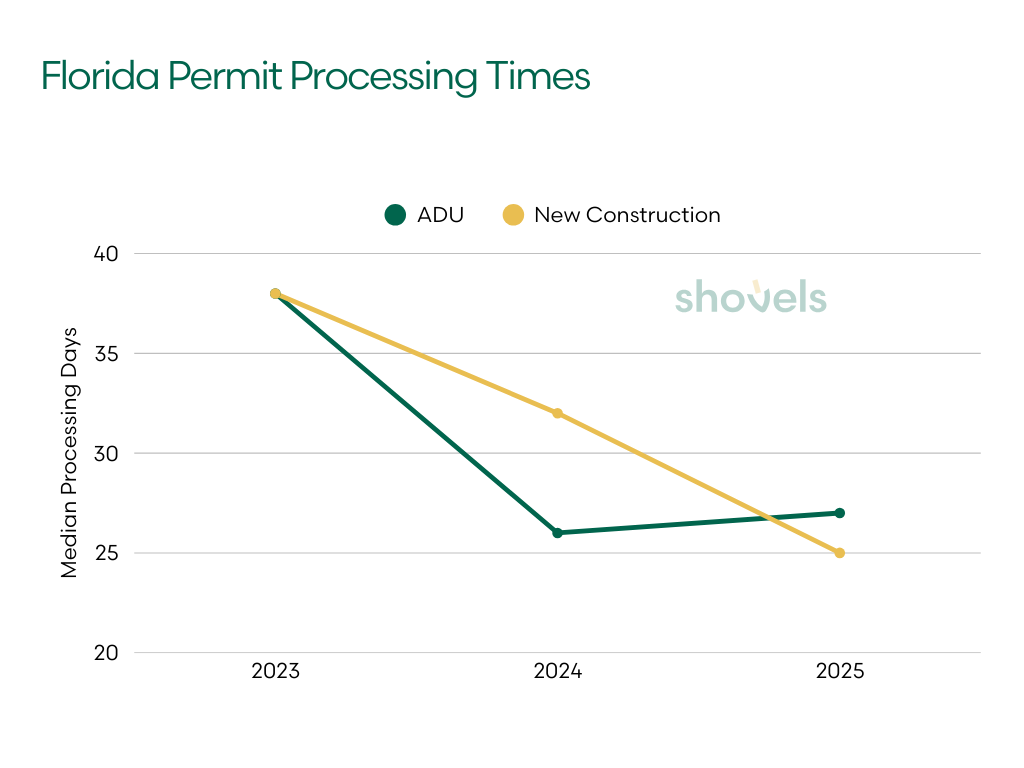
New construction permit processing times
| YEAR | PERMIT COUNT | MEDIAN APPROVAL_DURATION (DAYS) | P75 APPROVAL_DURATION (DAYS) |
|---|---|---|---|
| 2023 | 96,951 | 38 | 100 |
| 2024 | 76,109 | 32 | 71 |
| 2025 | 66,460 | 25 | 73 |
ADU permit processing times
| YEAR | PERMIT COUNT | MEDIAN APPROVAL_DURATION (DAYS) | P75 APPROVAL_DURATION (DAYS) |
|---|---|---|---|
| 2023 | 27,993 | 38 | 92 |
| 2024 | 22,681 | 26 | 53 |
| 2025 | 21,650 | 27 | 50 |
Note: PERMIT COUNT includes applications filed in a previous year and still working through the approval pipeline. Median and P75 calculations exclude zero-day approvals.
Over half of permits clear the process in zero to one days, suggesting many jurisdictions have expedited review tracks or pre-approved plan review programs. These fast-track approvals likely apply to standardized designs, repeat builders with established track records, or minor modifications that don't require full plan review.
The median approval time for non-zero-day approvals dropped from 38 days in 2023 to 25 days in 2025, a 34% improvement. For builders, faster approvals translate directly to reduced carrying costs on land and shorter project timelines.
For homeowners considering adding housing to their property, ADU permits process at similar speeds to new construction, with a median of 27 days in 2025. Both permit types have seen improvements since 2023, when each took a median of 38 days.
The 2025 data shows 66,460 new construction permits reviewed, down from 96,951 in 2023. This is a 31% reduction in volume. With fewer permits in the queue, jurisdictions can move applications through faster. This means faster turnarounds, but it also means less construction activity overall.
The Takeaway: Permit processing is getting faster, benefiting from both reduced volumes and improved efficiency.
Florida in the Year Ahead: What the Permit Data Tells
Florida's housing market is correcting, not crashing. The permit data paints a picture of a market that overheated during the pandemic years and is now recalibrating to sustainable levels. Builders are cautiously returning to the market, especially in places like Tampa Bay where permits have grown year-over-year. Central Florida is cooling as pandemic-fueled growth slows, but it remains attractive for its relative affordability.
In the year ahead, the supply pipeline will remain constrained. Florida is adding significantly fewer new homes than it was four years ago, with residential new construction down 31% since 2021. If demand holds steady, prices are unlikely to fall even as new inventory enters the market.
The key questions for 2026 are whether stabilization will continue, whether national builders will ramp back up, and how homes permitted in 2025 will perform when they reach the market.
Want deeper insights into Florida's construction and housing market? Shovels provides comprehensive building permit data and contractor intelligence across most Florida counties. Whether you're a builder evaluating market opportunities, an investor tracking regional trends, or a service provider identifying active contractors, our data helps you make decisions based on leading indicators. Contact our team to learn how Shovels can power your market analysis.
Frequently Asked Questions
Is the Florida housing market crashing?
Based on building permit data, Florida's housing market is correcting, not crashing. Total permits declined 12% in 2024 and another 6% in 2025, but new construction permits actually increased 3.8% in 2025 after a 15% drop the prior year. This suggests builders see enough demand to justify new projects. The data points to a market recalibrating to sustainable levels after pandemic-era overheating.
What areas of Florida have the strongest housing market?
Tampa Bay sees strong YoY growth. Manatee County and Pinellas County both saw 42% growth in new construction permits in 2025, while Hillsborough County posted 18-19% gains after significant drops in 2023 and 2024. This growth appears real, and driven by continued population migration, economic development, and available land for development.
Why are D.R. Horton and Lennar building fewer homes in Florida?
Permit data shows both builders have reduced activity significantly from their 2023 peaks, D.R. Horton by 65% and Lennar by 53% under their primary brand names. D.R. Horton's pullback is confirmed by its own earnings commentary, with management citing softer Florida and Texas conditions as the driver of fewer starts. Lennar's figures require some caution: the company files a substantial portion of its Florida permits through subsidiary LLCs tied to master-planned communities, so permit data under the Lennar brand name likely understates its actual production volume. Both builders are also deploying broad incentive packages, including rate buydowns, price cuts, and increased concessions, to sustain absorption in a higher-rate environment.
How long does it take to get a building permit in Florida?
While we can't offer exact timelines, we see that permit processing times have improved over the past two years. The median approval time for new construction dropped from 38 days in 2023 to 25 days in 2025—a 34% improvement. Over half of permits are approved within 0-1 days through expedited review tracks. ADU permits process at similar speeds, with a median of 27 days in 2025.
Are ADUs popular in Florida?
ADU permits are up 9.8% year-over-year—the only permit category showing growth. Florida ranks #2 nationally with 18% of all ADU activity. ADUs offer rental income potential, and Fannie Mae now allows projected ADU rental income to count toward mortgage qualification, making them an attractive option for homeowners looking to offset costs.
What happened to solar panel installations in Florida?
Solar permits are down 46% from their 2022 peak. Changes to net metering policies have reduced the financial return on solar investments and extended payback periods. Many homeowners are now reconsidering the cost-benefit analysis before committing to solar installations.
What does building permit data tell us about the housing market?
Building permits are a leading indicator of future housing supply. When builders pull permits, construction typically follows in 3-6 months, and home sales follow in 12-18 months. Permit trends reveal what builders—who commit capital based on market assessments—believe about future demand. Today's permits shape housing inventory through 2027.