
Unless noted, all data shared was pulled directly from the Shovels platform. Start a free trial here.
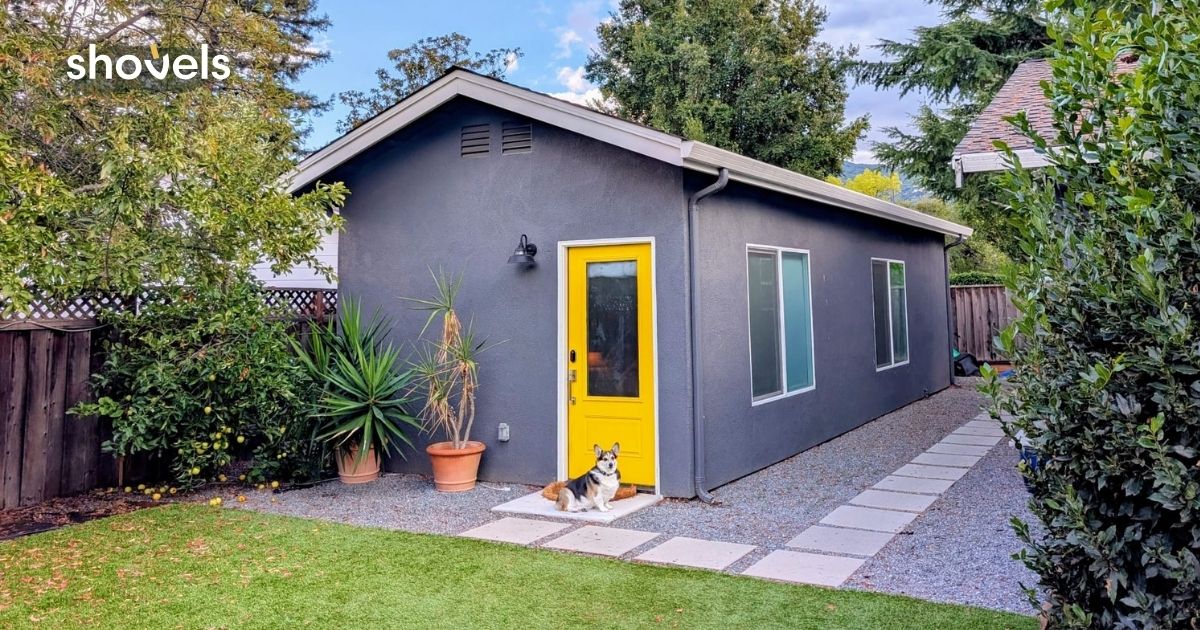
In 2021, I built an Accessory Dwelling Unit (ADU) in my backyard (see Exhibit 1). What started as part of a larger main house remodel became something more: a flexible space that could serve as an office, music studio, guest suite, and eventually (if needed) housing for aging relatives. As a California resident, I experienced firsthand how straightforward ADU permitting had become—a stark contrast to the regulatory barriers that once made these projects nearly impossible.
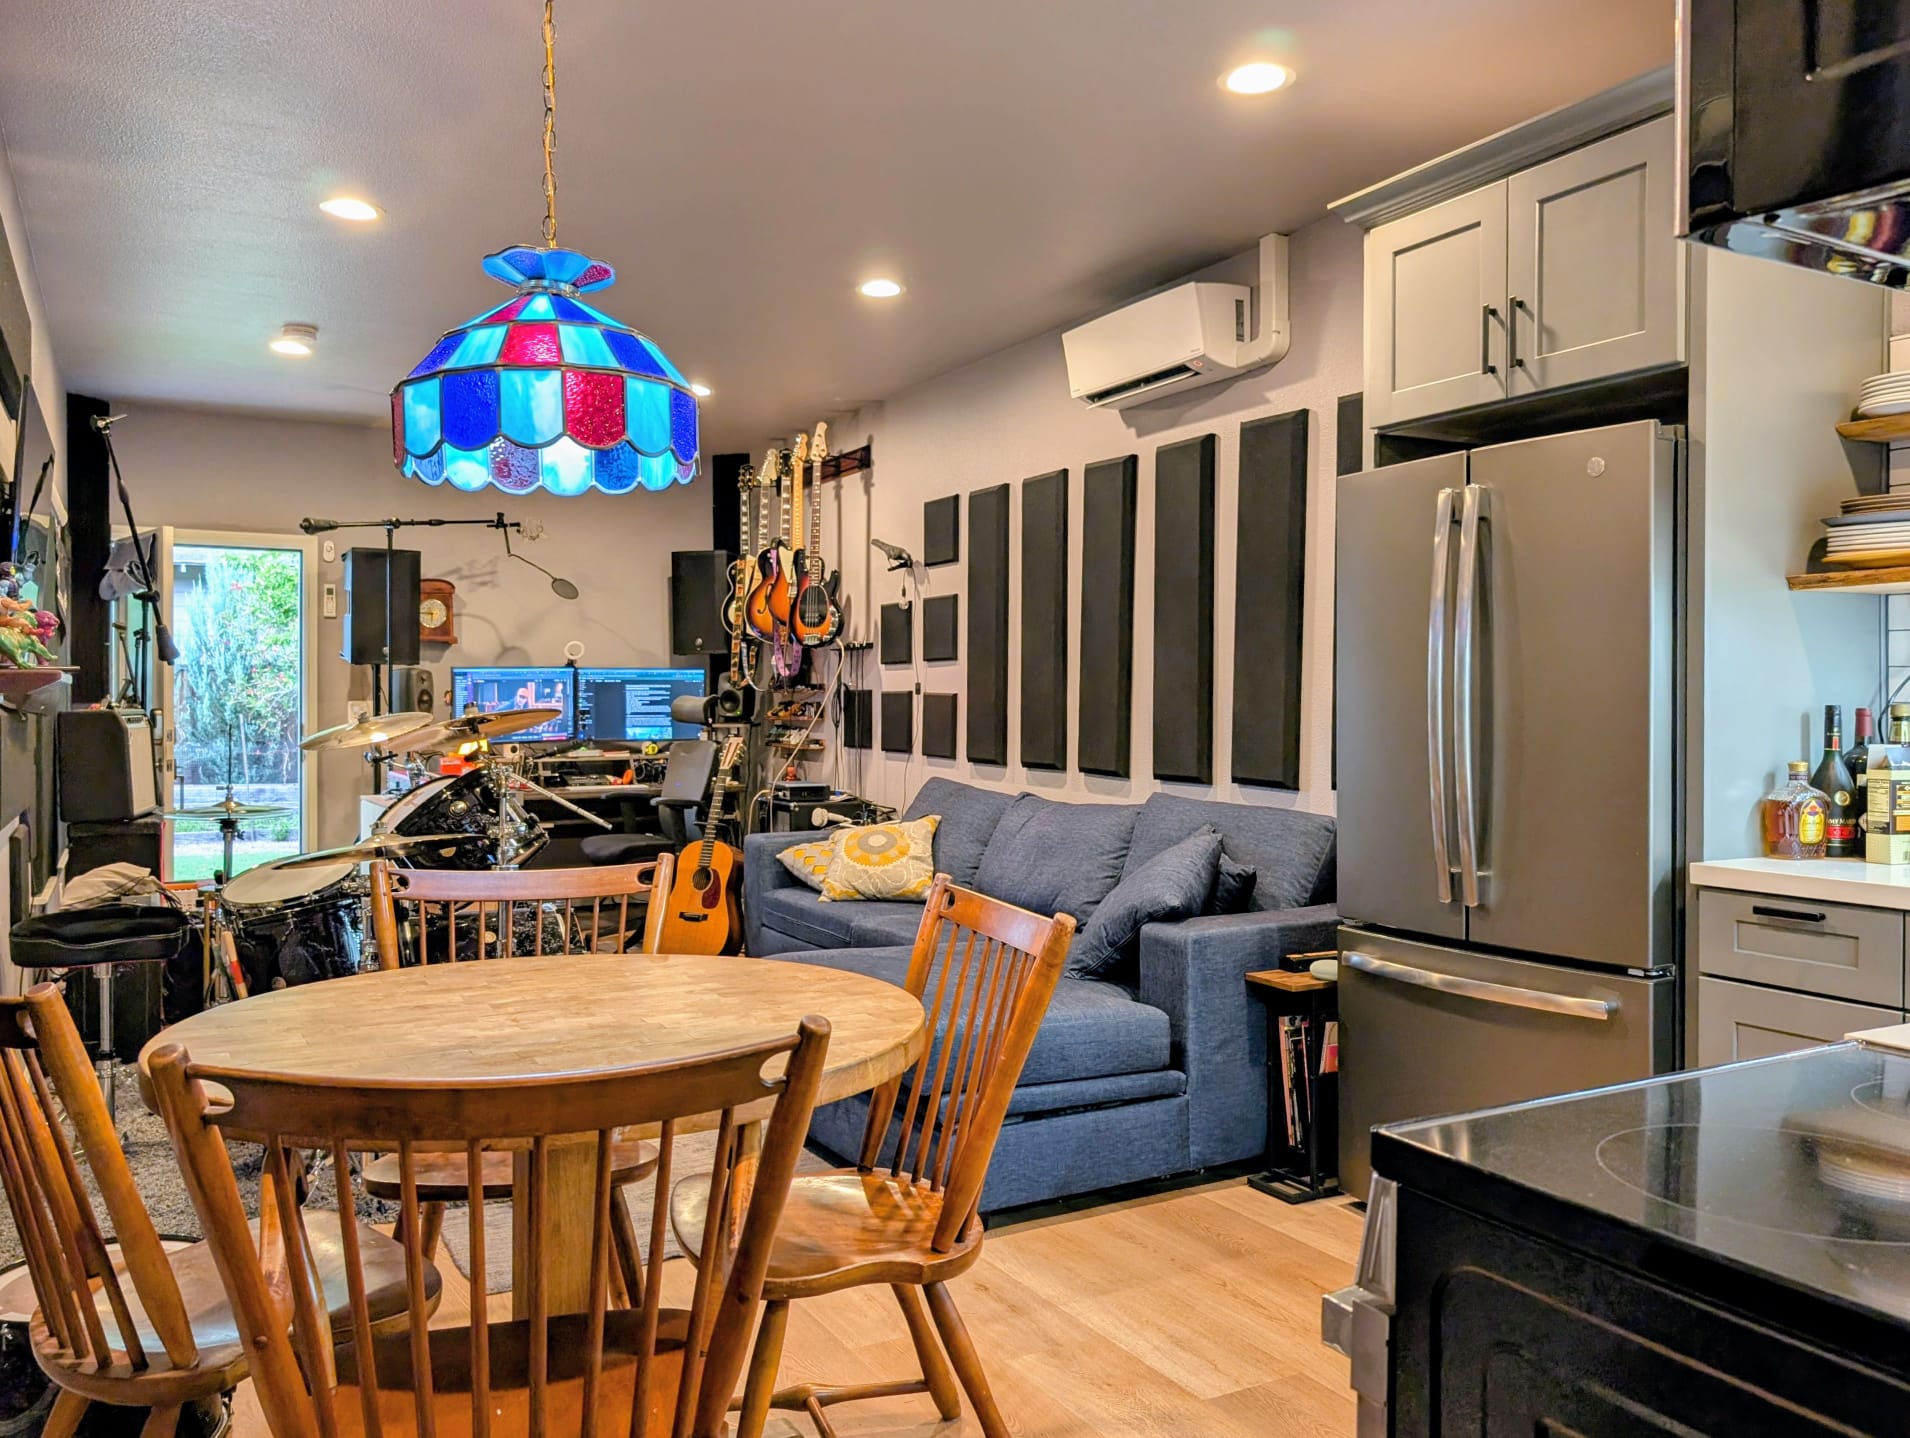 Exhibit 1: ADU interior
That personal experience took on new dimensions when I joined Shovels and discovered we had permit data on over 2.8 million ADUs nationwide. What the data reveals is remarkable: Accessory Dwelling Units (small, self-contained homes built on single-family lots) have become one of America's fastest-growing housing solutions. Driven by smart policy reforms and favorable homeowner economics, ADUs are reshaping how we think about density, affordability, and neighborhood development from California to Florida to Colorado and beyond.
This post dives deep into that data to reveal how ADUs work, why they matter, and where they're growing fastest. You'll discover which states and counties are leading the charge, what policies actually drive construction, and how these compact homes are reshaping neighborhoods without bulldozers or battles. Whether you're a homeowner considering an ADU, a policymaker weighing reforms, or simply curious about housing trends, the patterns emerging from millions of permits paint a clear picture: ADUs aren't just a trend, they're a movement quietly rewriting the rules of American housing.
Let’s dig into some data…
What Is An ADU?
(If you're already familiar with ADUs, and we suspect you are, feel free to skip ahead. This section exists mainly for search engines and our AI overlords. 🤖)
An Accessory Dwelling Unit (ADU) is a smaller, independent home on the same lot as a primary residence. Think backyard cottages, garage conversions, or basement apartments. They can be detached (standalone), attached (connected to the main house), or internal (within the existing structure).
ADUs help cities add housing efficiently while creating flexible living arrangements that benefit both property owners and the broader community. Because they change how land is used, getting proper permits is critical, ensuring safety compliance, neighborhood compatibility, and legal rental/sale status.
ADU Benefits For Homeowners
- Generate passive income through monthly rental revenue, helping offset mortgage payments and property taxes.
- Create flexible living space for family or caregivers, enabling aging-in-place and multi-generational housing solutions.
- Boost property value with a legal rental unit, potentially increasing home equity by 20-30%.
- Maximize underutilized property space like oversized yards, empty garages, or basement areas.
- Gain housing flexibility for changing life circumstances without needing to move or sell.
ADU Benefits For Communities
- Add housing supply through gentle density that maintains neighborhood character while diversifying the housing stock.
- Expand affordable housing options for workers, seniors, and middle-income households priced out of traditional rentals.
- Utilize existing infrastructure, lowering per-unit carbon footprint and avoiding costs of new development.
- Support local small businesses by increasing population density in residential areas.
The History of ADUs in America
ADUs aren’t new, they’ve simply come back into favor. When looking for the oldest ADU permit in our database, we uncovered some interesting information dating back over 120 years. As one might expect, tracking records that old often comes with gaps, funny anomalies, and often results in more questions than answers. That being said, here is what we found.
Our archive shows that “ADUs” long predate the modern term. Mid-century building ledgers repeatedly document guest houses, servants’ quarters, garage apartments, bath houses, greenhouses with rooms above, and duplex conversions, all functional cousins of today’s accessory dwelling units.
What the Earliest ADU Permit Entries Look Like
- Pre-WWII & wartime (1930s–1940s): We see formal “Residential accessory dwelling unit—New” permits in Provo, UT as early as 1942–1944 (e.g., C1229, C1276, SC1726), and again 1948–1949 (C3139, C3402, C3466). That language is strikingly modern and suggests an early, explicit recognition of second units.
- Post-war Bay Area cluster (1945–1950): In Atherton/Menlo Park/Burlingame, CA (San Mateo County), dozens of permits list guest houses, garage apartments, carports + storage, bath houses, greenhouses, and conversions of stables (e.g., 24 “guest house” 1945→1946; 766 “garage & bath house” 1949→1950; 873 “convert stable to guesthouse” 1950). These appear on large single-family lots, consistent with estate properties adding ancillary quarters.
- Central Coast conversions (late 1940s): Salinas, CA shows repeated garage → apartment conversions and small accessory buildings (e.g., 49-3349 “Garage into apt.” 1949; several 1934–1948 R-garage and misc/storage shed permits).
- Central Valley ledger entries (late 1940s): Modesto, CA records “Permit history entry” items (often labeled accessory bldg., outside stairway, side dwelling, convert dwelling to duplex) with notes like “ledger has no date.” These are clearly digitized from older books; they document ADU-like work even when exact timestamps are murky.
- New England estates (undated/sentinel 1901): Newport County, RI includes numerous “Building” permits for guest houses, detached garage + studio, and in-law units over garages with 1901-01-01 dates. Based on context (property year built, descriptions, and later assessor details), these are almost certainly placeholder dates for pre-computer paper records rather than literal 1901 approvals, but they still show a long tradition of accessory quarters on older properties.
- Miscellaneous early markers: McHenry County, IL lists “Residential accessory structure” entries (1946–1949); Bainbridge Island, WA has a 1950 zoning record for a duplex—another early nod to gentle density.
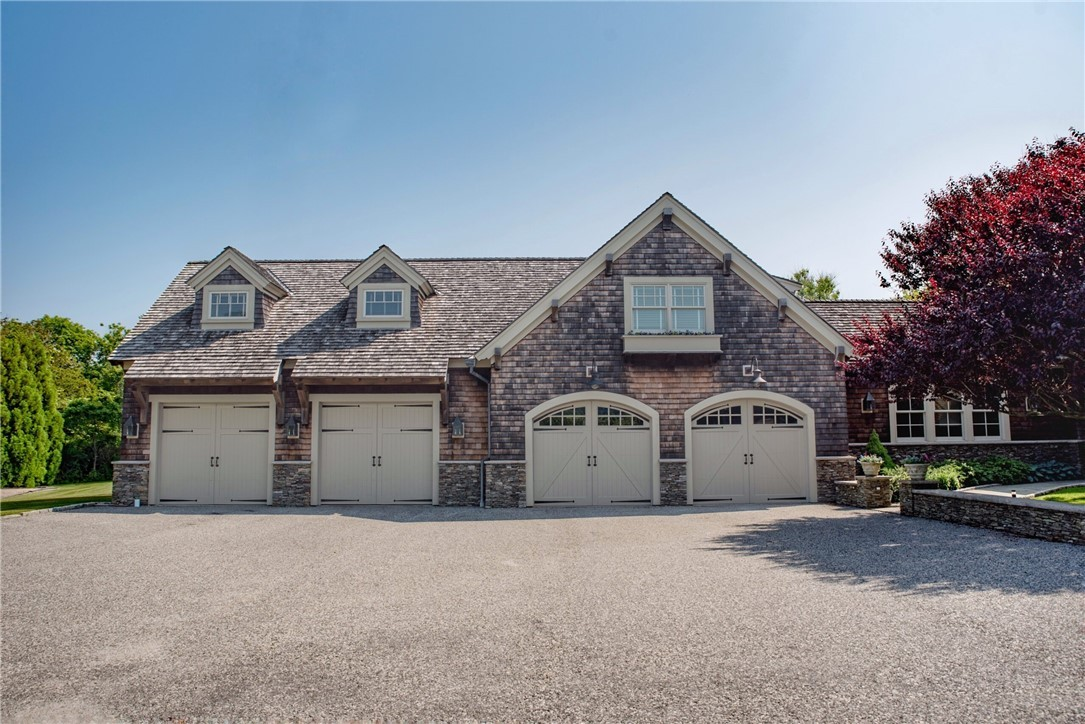 Image source: Redfin. Shovels permit description: “New dwelling with in-law unit over garage.” Oldest record we could match with Redfin rental description: “Experience luxury year-round in this expansive 1-bedroom, 1-bath apartment located in Newport (RI). Spanning over 1,400 sq. ft., this beautifully furnished second-floor unit features an open layout...”
Patterns Across the Oldest ADU Records
- Function first, terminology later. Early files rarely say “ADU.” Instead, they describe guest houses, servants’ quarters, garage apartments, and garden/greenhouse structures, uses that align with today’s ADUs.
- Affluent-lot bias. The densest early cluster sits in estate suburbs (Atherton/Menlo Park) and New England coastal towns, where lot sizes and outbuildings made ancillary units practical and desirable.
- Conversions > ground-up. Many of the oldest entries are conversions (stable → guesthouse, garage → apartment) or small accessory buildings added to a primary home, mirroring today’s garage/attic/basement ADU movement.
- Post-war bump. There’s a clear 1945–1950 uptick, likely tied to post-WWII household formation, returning veterans, and the need for additional family/worker housing on existing lots.
- Jurisdictional variety. Some cities (e.g., Provo) used explicit “Residential accessory dwelling unit” nomenclature remarkably early; others logged the same concept under general building or miscellaneous accessory categories.
- Data archaeology required. Notes like “ledger has no date,” converted record flags, default 1901-01-01 dates, or missing issue dates are digitization artifacts. Even so, the descriptions, addresses, and property attributes reliably signal ADU-like use.
Method note: Some early dates (e.g., 1901-01-01) function as placeholders for scanned ledgers; we anchor our AI classification and analysis in the work descriptions and property metadata to identify these as ADU-like records.
Why This Matters for Today’s ADU Story
The oldest permits show that small secondary homes on single-family lots aren’t new, they’re part of a long American pattern of flexible housing. What’s changed is policy clarity and scale: where mid-century approvals were ad hoc and estate-driven, today’s statewide reforms aim to normalize and democratize this housing type for ordinary homeowners. In other words, modern ADU laws are formalizing a century-old practice and extending it beyond large-lot enclaves to meet today’s affordability and supply needs.
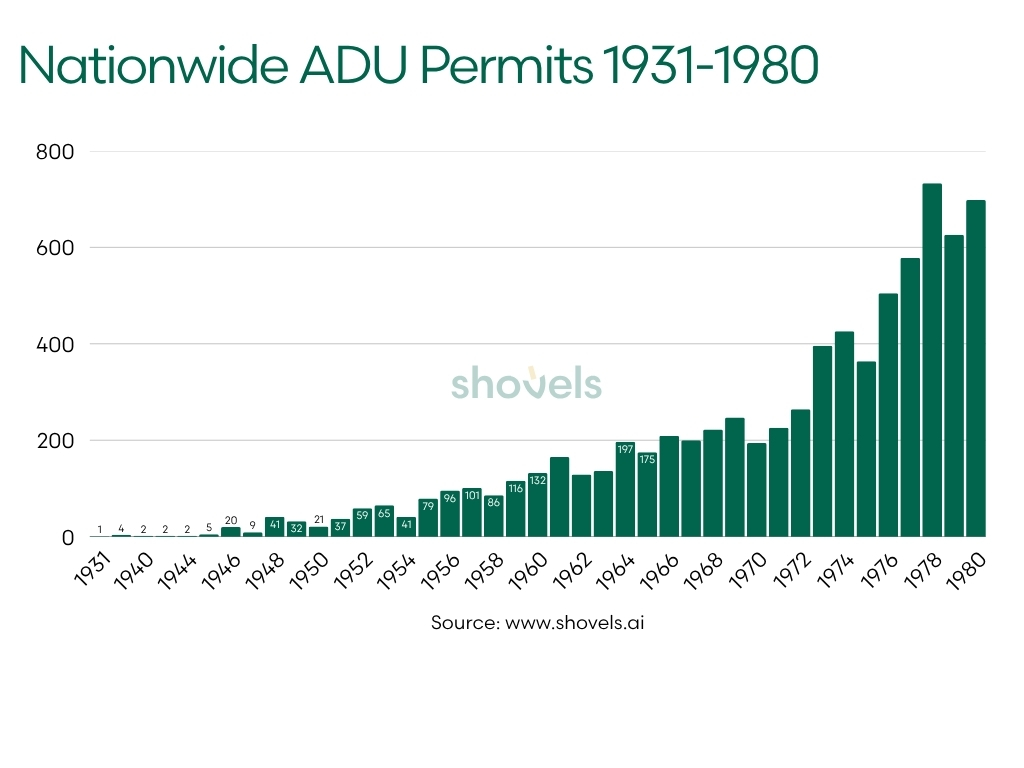
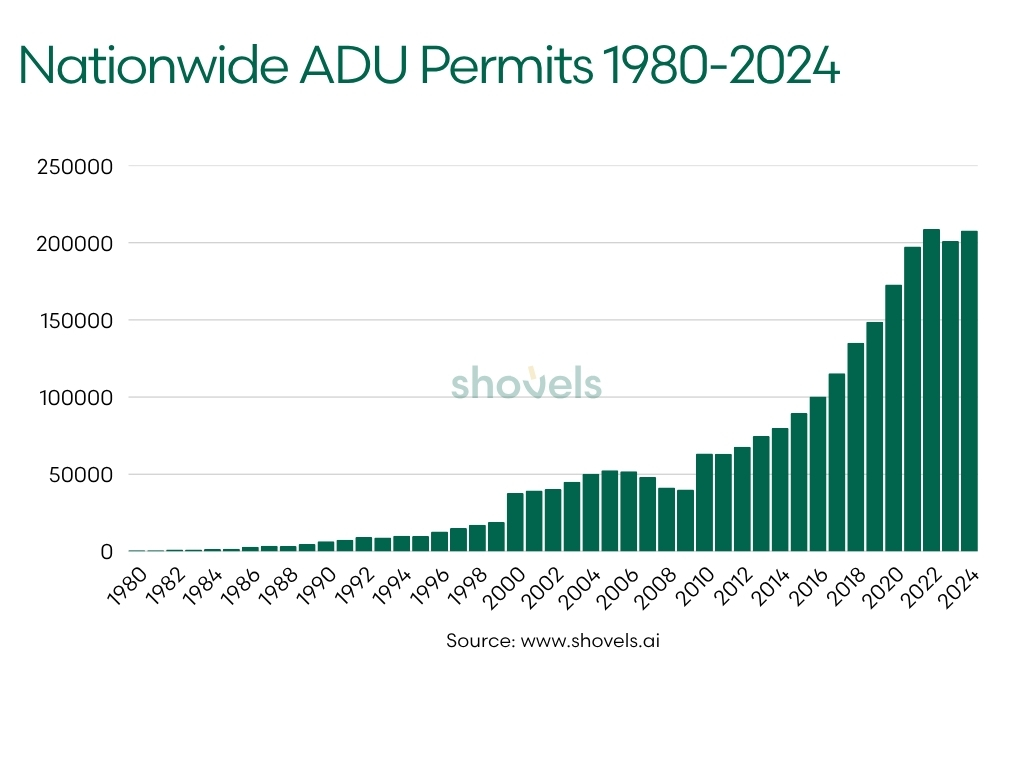
Jumping ahead, we see the growth of ADU permits over the past four decades reveals how housing policy, economic cycles, and cultural attitudes have shaped this form of development.
 From early experiments in California to today's nationwide movement, each era brought distinct drivers and challenges:
- 1980s Emergence (698 → 4,748 permits): The decade saw steady growth as California began experimenting with "granny flat" policies, though local zoning boards often resisted.
- 1990s Expansion (6,531 → 18,974 permits): Permit volume nearly tripled during the economic expansion of the 1990s, reflecting increased homeowner investment capacity.
- 2000 Milestone Jump (37,788 permits): A dramatic doubling from 1999, likely due to the dot-com boom's wealth effect and Y2K-era construction activity.
- Mid-2000s Peak (52,626 permits in 2005): Growth continued through the housing bubble, as home equity wealth enabled expensive remodels and additions.
- Great Recession Decline (2006-2009): Permits dropped from 51,990 to 40,056 as the global financial crisis froze construction financing and home equity evaporated.
- Post-2010 Recovery (63,471 permits): A 58% rebound as the economy stabilized, though growth remained slow through the early 2010s.
- Policy-Driven Acceleration (2016-2022): California reformed ADU law through a series of bills (SB 1069, AB 68, AB 881, SB 13), making approvals ministerial (by-right) and capping parking and fees. Los Angeles saw ADU permits surge by a factor of 30 following these reforms, with ADUs accounting for one-fifth of all housing permits by 2018. Permits surged from 100,411 to 208,975—more than doubling in six years. Further details section below.
- Recent Plateau (2022-2024): Growth has stabilized around 200,000+ annual permits, possibly reflecting capacity constraints or market saturation in early-adopter states. That being said, there's been a wave of state-led reforms across Washington, Oregon, Vermont, Montana, Arizona, and Colorado.
The data shows ADU permits are highly sensitive to:
- Home equity availability: major dips align with the 2008 global financial crisis when homeowners lost borrowing power
- Economic confidence: acceleration during boom periods (late 1990s, mid-2000s, 2020-2022)
- Policy intervention: the post-2016 surge demonstrates how removing regulatory barriers can override economic headwinds
The 30x increase in permits from 1980 to 2024 reflects both growing housing demand and a fundamental shift in how states view residential land use.
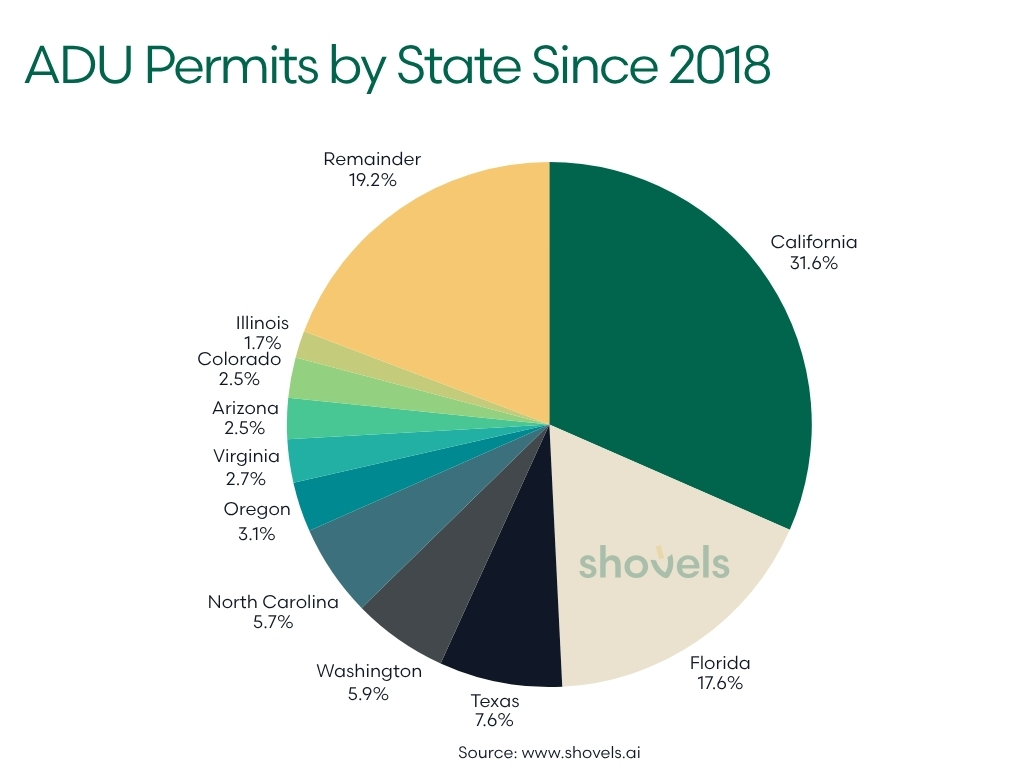
State ADU Leaders Since 2018
The map below shows the top states by ADU permit volume since 2018, revealing clear patterns where the rising housing type has gained the most traction. The top ranked states nearly form a donut shape around the nation. Interactive map:
Three distinct categories of states emerge as leaders in ADU development, each driven by different but complementary forces:
1. Policy Reform States Dominate the Landscape
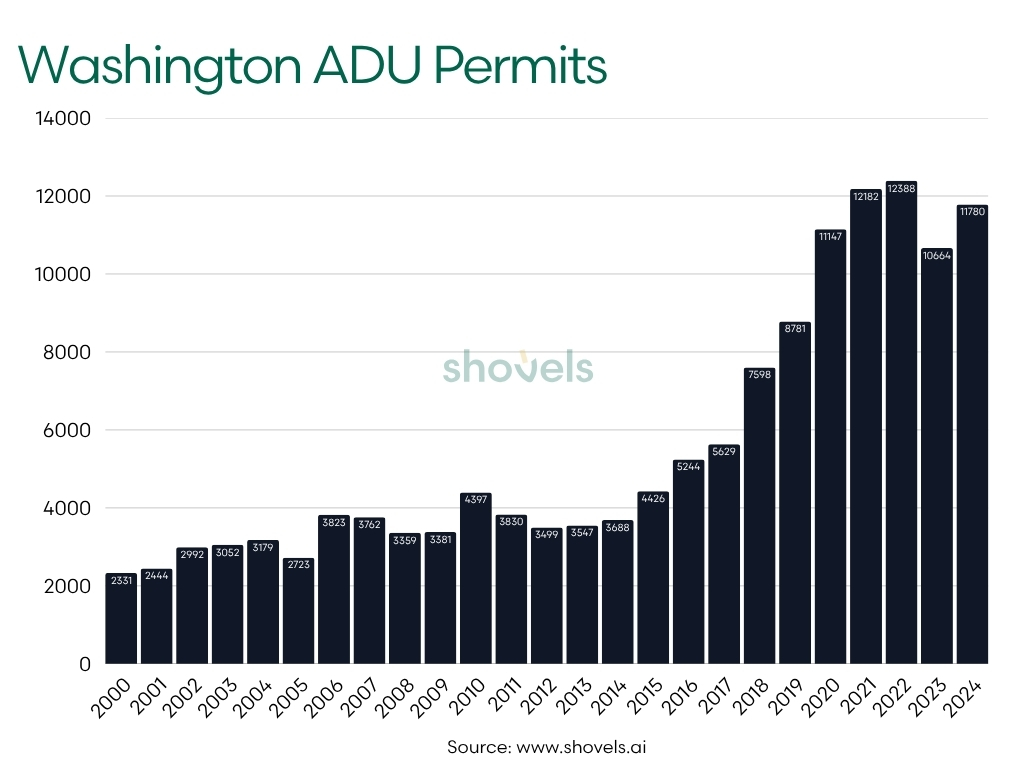
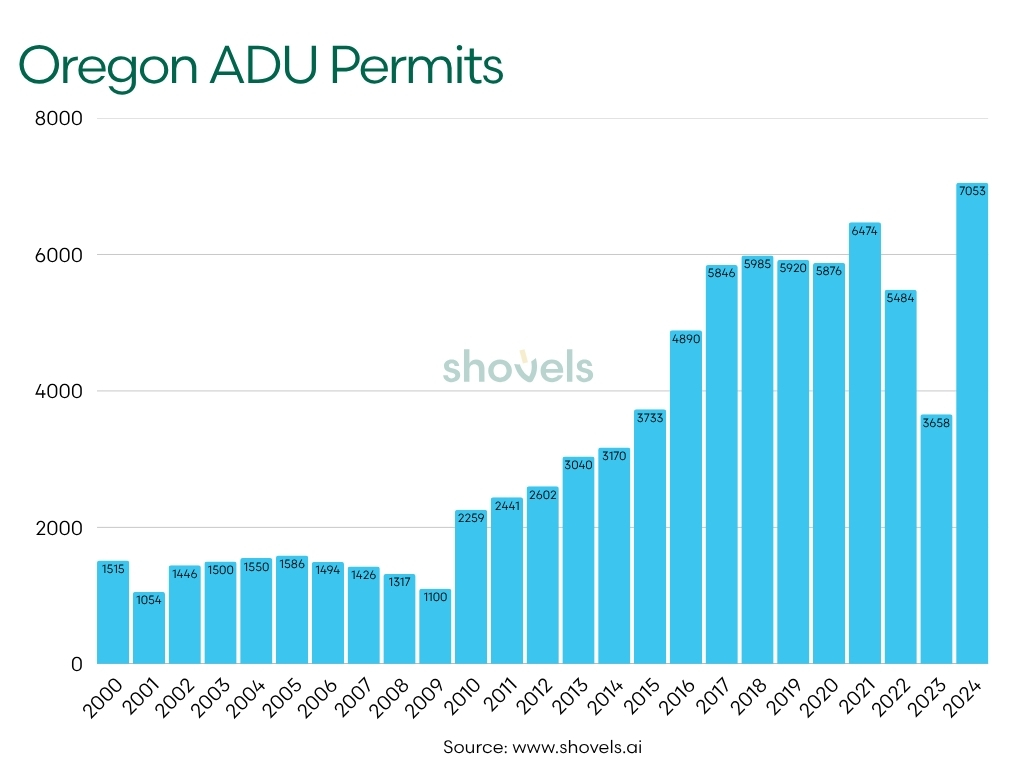
California leads with 32% of all ADU permits nationwide, followed by Washington (6%) and Oregon (3%). All three states implemented comprehensive statewide ADU legislation (CA 2017, OR 2018, WA 2023) that made approvals ministerial (meaning local jurisdictions must approve qualifying projects by right) and systematically removed local barriers such as excessive parking requirements, owner-occupancy mandates, and prohibitive impact fees. These reforms directly correlate with dramatic increases in permit numbers. California's legislative package, which included SB 1069, AB 68, AB 881, and SB 13, fundamentally restructured the approval process. Los Angeles alone saw ADU permits surge by a factor of 30 following these changes, with ADUs eventually accounting for one-fifth of all housing permits citywide. The Pacific Northwest followed suit, with Washington's 2019 reforms and Oregon's 2017 and 2019 legislation creating similar ministerial pathways.
|
|
2. High-Growth Sun Belt States Show Strong Organic Demand
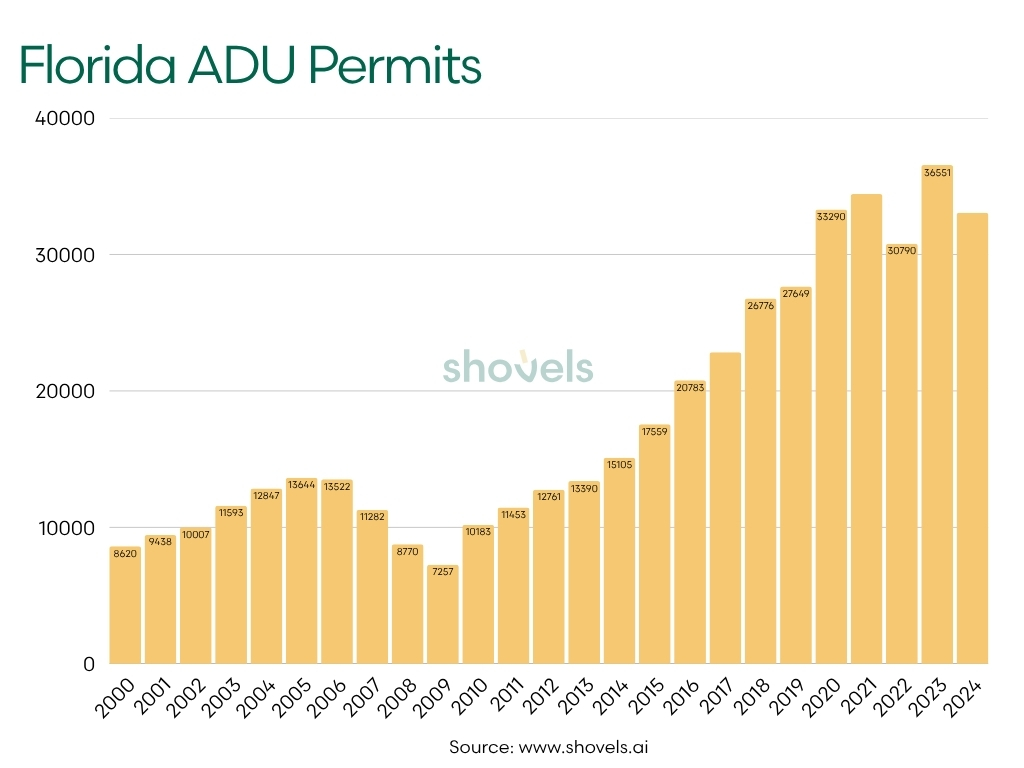
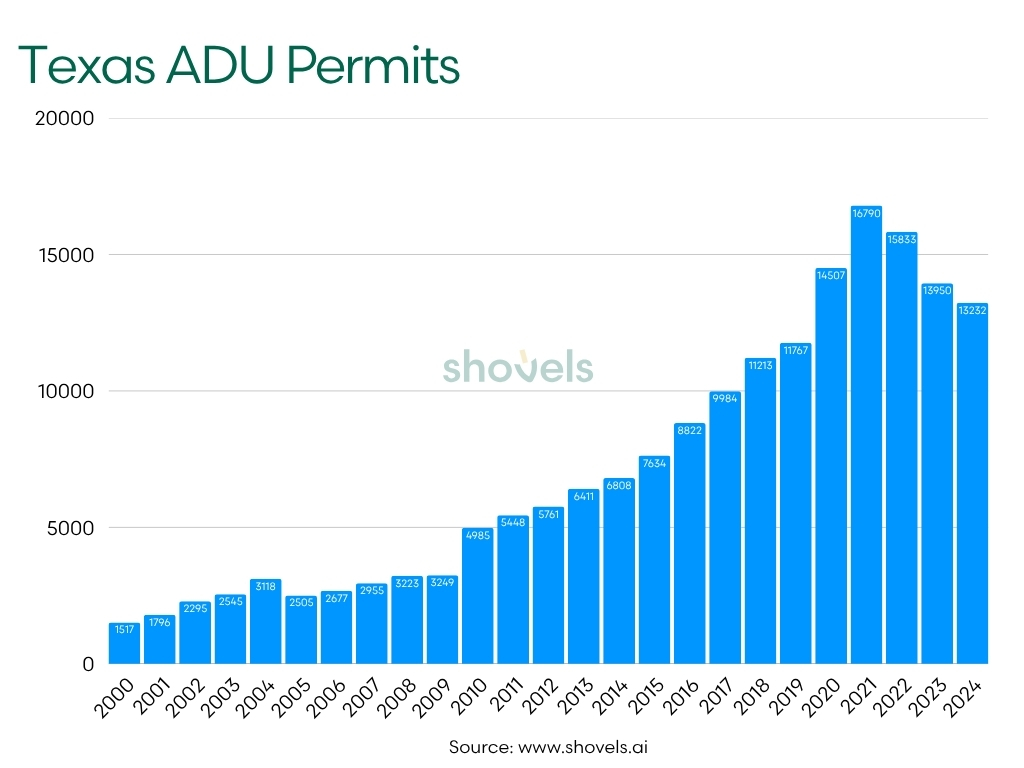
Florida ranks second nationally with 18% of all ADU permits, followed by Texas (8%), North Carolina (6%), and Arizona (3%). These states demonstrate robust ADU activity driven primarily by rapid population growth and acute housing demand, even without comprehensive statewide ADU mandates. The Sun Belt's combination of population influx, relatively affordable land, and pro-development regulatory environments has created fertile ground for ADU construction. In many of these markets, ADUs serve as both income-generating assets for homeowners and naturally occurring affordable housing for workers and family members. The absence of top-down policy mandates suggests that when housing demand is strong enough and local regulations are permissive, ADUs will emerge organically as a market response.
|
|
3. Coastal Housing Markets With Severe Affordability Challenges
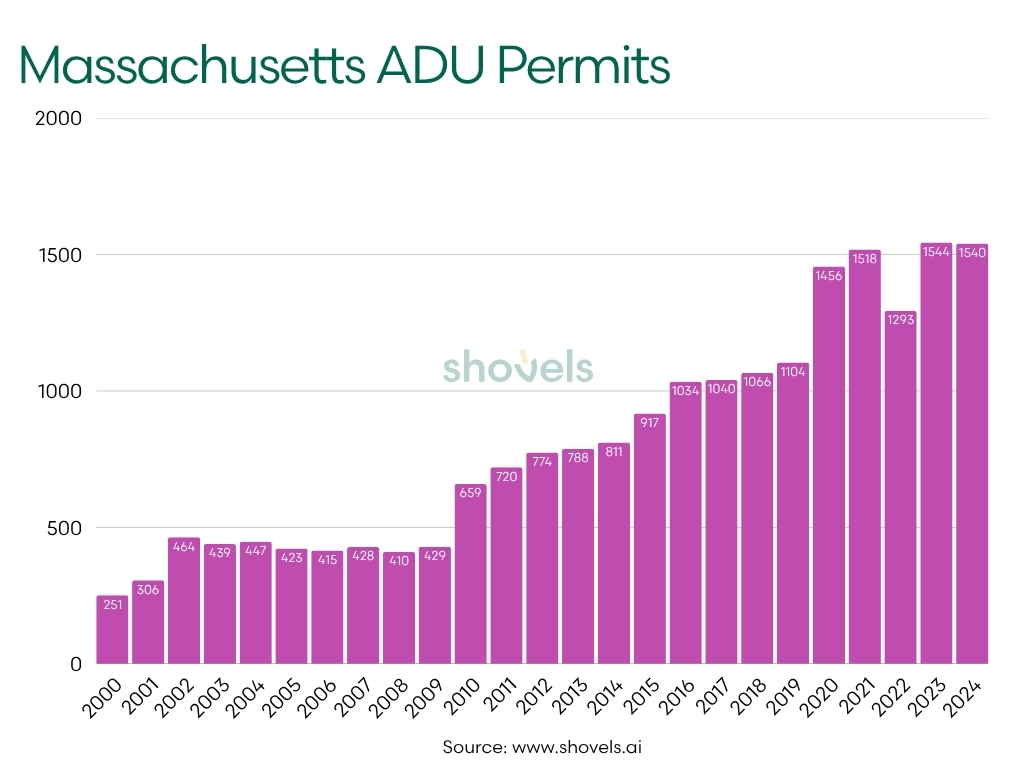
States facing the nation's most expensive housing (California, Washington, Oregon, Massachusetts, and Hawaii) appear prominently in the rankings. In these constrained markets, where undeveloped land is scarce and new construction costs are prohibitively high, ADUs offer one of the few practical pathways to add housing units in already built-out neighborhoods. Hawaii's ranking (24th nationally despite its small population) is particularly telling: the state has extreme land constraints and housing costs, making ADUs an essential tool for creating both multigenerational housing and rental supply. Massachusetts similarly faces severe supply-demand imbalances in Greater Boston and other metro areas, driving ADU interest even before the state's 2024 MBTA Communities law accelerated multifamily and ADU development near transit.
|
|
Note: The plateau and subsequent dip in Oregon from 2017-2013 align with fewer permits reaching "final" and more lingering in earlier statuses. Likely contributors include staffing constraints, processing delays, or policy/code changes affecting timelines - not to mention the impact of COVID.
The concentration in the top 10 states (which account for 83% of all permits since 2018) shows that ADU development remains heavily dependent on either explicit policy support or extreme housing market pressure to overcome local regulatory hurdles.
| STATE_NAME | ADU_PERMITS | PERCENT_OF_TOTAL | RANK |
|---|---|---|---|
| California | 429503 | 32% | 1 |
| Florida | 240143 | 18% | 2 |
| Texas | 103140 | 8% | 3 |
| Washington | 80156 | 6% | 4 |
| North Carolina | 77302 | 6% | 5 |
| Oregon | 41910 | 3% | 6 |
| Virginia | 36125 | 3% | 7 |
| Arizona | 34258 | 3% | 8 |
| Colorado | 33981 | 2% | 9 |
| Illinois | 22600 | 2% | 10 |
| Maryland | 20470 | 2% | 11 |
| Louisiana | 20094 | 1% | 12 |
| South Carolina | 17428 | 1% | 13 |
| Georgia | 15363 | 1% | 14 |
| Nevada | 14884 | 1% | 15 |
| Ohio | 14635 | 1% | 16 |
| Delaware | 14152 | 1% | 17 |
| Tennessee | 13872 | 1% | 18 |
| Indiana | 12171 | 1% | 19 |
| New York | 10643 | 1% | 20 |
| Massachusetts | 9941 | 1% | 21 |
| Idaho | 9187 | 1% | 22 |
| Connecticut | 8854 | 1% | 23 |
| Hawaii | 7680 | 1% | 24 |
| Minnesota | 6593 | 0% | 25 |
| Iowa | 6554 | 0% | 26 |
| Missouri | 5420 | 0% | 27 |
| Alabama | 5037 | 0% | 28 |
| Wisconsin | 4885 | 0% | 29 |
| New Mexico | 4844 | 0% | 30 |
| Rhode Island | 4619 | 0% | 31 |
| Oklahoma | 3809 | 0% | 32 |
| West Virginia | 3313 | 0% | 33 |
| Utah | 3119 | 0% | 34 |
| Pennsylvania | 3084 | 0% | 35 |
| Kansas | 2955 | 0% | 36 |
| Kentucky | 2652 | 0% | 37 |
| Nebraska | 2438 | 0% | 38 |
| North Dakota | 2349 | 0% | 39 |
| Michigan | 2125 | 0% | 40 |
| Wyoming | 1839 | 0% | 41 |
| Mississippi | 1539 | 0% | 42 |
| Arkansas | 1524 | 0% | 43 |
| New Hampshire | 1375 | 0% | 44 |
| Vermont | 745 | 0% | 45 |
| South Dakota | 717 | 0% | 46 |
| Maine | 412 | 0% | 47 |
| Alaska | 100 | 0% | 48 |
| New Jersey | 93 | 0% | 49 |
| Montana | 1 | 0% | 50 |
ADU Permits as a Share of New Single-Family Residential Construction
When viewed as a percentage of total new single-family residential construction permits, ADU activity reveals a strikingly different outcome than raw permit counts per state alone. This ratio illuminates where ADUs are being adopted most aggressively relative to traditional single-family home construction, and highlights markets where ADUs may be displacing or substituting for conventional housing starts.
 Single-family residential construction numbers provided by the United States Census Bureau: https://www.census.gov/construction/bps/current.html
California Leads in ADU Share
California leads the nation with ADUs representing 127% of new residential construction permits, meaning more ADUs are being permitted than traditional homes. This extraordinary ratio reflects the state's aggressive statewide ADU legalization, extreme housing costs, and lot scarcity. For every 100 traditional homes permitted, California adds 127 ADUs, transforming ADUs from a niche housing type into a primary vehicle for adding residential capacity in built-out neighborhoods.
Small Markets and Dense Urban Centers Show High Ratios
Washington D.C. (97%), Rhode Island (82%), and Connecticut (72%) demonstrate exceptionally high ADU-to-construction ratios, reflecting severe land constraints and mature urban environments. In these markets, ADUs represent densification and adaptive reuse rather than competing with greenfield subdivisions. Oregon (72%) and Washington (62%) continue to show strong adoption thanks to early statewide legalization and streamlined approval processes.
Hawaii and Northeast Markets Embrace ADUs
Hawaii ranks 7th nationally at 54%, driven by extreme land constraints and housing costs that make ADUs essential for both multigenerational housing and rental supply. Illinois (37%), Delaware (34%), and Maryland (32%) show that ADUs are filling gaps in mature metros where undeveloped land is scarce and infrastructure already exists. Massachusetts (27%) ranks 11th, reflecting the impact of the state's 2024 MBTA Communities law accelerating ADU development near transit.
Growth States Show Lower Ratios Despite High Volumes
Florida (27%), Virginia (27%), and Texas (9%) rank lower despite appearing in the top states for raw permit counts. Fast-growing states like Texas, Idaho (12%), and Arizona (9%) still have abundant land for traditional subdivisions, so ADUs represent a smaller share of overall residential construction. The pattern suggests ADUs emerge as a dominant housing form primarily in land-constrained or slow-growth markets, while growth states build both ADUs and conventional homes at scale.
Policy and Market Pressure Drive Ratios
The states with the highest ADU-to-construction ratios share common traits: either strong statewide ADU legalization (California, Oregon, Washington) or severe housing constraints that make traditional development difficult (D.C., Rhode Island, Hawaii). The ratio metric effectively separates markets where ADUs are a policy-driven or necessity-driven response from those where they're simply one option among many in a growing housing market.
| STATE | ADU_SHARE | RANK |
|---|---|---|
| CA | 126.7% | 1 |
| DC | 96.6% | 2 |
| RI | 81.9% | 3 |
| CT | 72.1% | 4 |
| OR | 71.9% | 5 |
| WA | 62.1% | 6 |
| HI | 53.6% | 7 |
| IL | 37.2% | 8 |
| DE | 34.3% | 9 |
| MD | 31.5% | 10 |
| MA | 27.4% | 11 |
| FL | 27.3% | 12 |
| VA | 27.3% | 13 |
| CO | 22.2% | 14 |
| LA | 21.1% | 15 |
| WV | 18.8% | 16 |
| ND | 18.0% | 17 |
| NC | 16.8% | 18 |
| WY | 16.5% | 19 |
| NV | 15.3% | 20 |
| OH | 12.8% | 21 |
| NY | 12.3% | 22 |
| NM | 12.1% | 23 |
| ID | 12.0% | 24 |
| IA | 11.9% | 25 |
| NH | 11.3% | 26 |
| VT | 10.7% | 27 |
| KS | 9.7% | 28 |
| TX | 9.4% | 29 |
| AL | 9.4% | 30 |
| AZ | 9.0% | 31 |
| MO | 8.0% | 32 |
| AK | 7.2% | 33 |
| OK | 7.2% | 34 |
| TN | 7.1% | 35 |
| NE | 6.9% | 36 |
| SD | 6.6% | 37 |
| SC | 6.4% | 38 |
| MN | 6.0% | 39 |
| IN | 5.9% | 40 |
| WI | 5.7% | 41 |
| GA | 5.3% | 42 |
| KY | 5.0% | 43 |
| AR | 3.9% | 44 |
| UT | 3.4% | 45 |
| MI | 3.1% | 46 |
| PA | 3.0% | 47 |
| MS | 2.4% | 48 |
| ME | 1.1% | 49 |
County ADU Leaders Since 2018
While state-level permit data tells one story, mapping data at the county level across more than 3,000 subdivisions provides a more complete picture. Analyzing permit data across every U.S. county issuing at least 100 ADU permits since 2018 shows that ADU production is no longer a West Coast story alone, though California remains dominant.
Concentration and Policy Leadership
California still leads nationally, with Los Angeles County alone approving more than 126,000 ADUs, far more than any other jurisdiction. In fact, Los Angeles County issued nearly 4X the next highest county, Lee in Florida with 34K ADU permits. California’s legislative reforms from 2016 onward (SB 1069, AB 68, AB 881, SB 13, and subsequent updates) effectively removed local zoning barriers, set 60–120-day approval clocks, and prohibited onerous parking mandates. As a result, eight of the top fifteen counties are in California: Los Angeles, San Diego, Santa Clara, Orange, Riverside, San Bernardino, Alameda, and Sacramento.
Emerging Hotspots Outside California
While California dominates, ADU activity has surged in several other regions:
- Florida counties like Lee, Polk, Volusia, Manatee, and Sarasota collectively permitted over 100,000 ADUs, reflecting both demand for secondary housing in fast-growing retirement markets and local willingness to permit flexible structures on suburban lots.
- Washington’s King County (Seattle) and Oregon’s Multnomah County (Portland) have maintained strong volumes thanks to early statewide legalization and “clear and objective” local standards.
- Colorado (Denver County) and Arizona’s Maricopa County (Phoenix) are fast climbers. both states recently enacted or expanded by-right ADU laws.
- North Carolina’s Wake County (Raleigh) and Texas counties like Travis (Austin) and Tarrant (Fort Worth) show the policy trend spreading across the Sunbelt, tied to affordability challenges and urban infill incentives.
Suburban and Sunbelt Expansion
Florida and North Carolina's top-ten positions show that Sunbelt metros are catching up, driven by demographic pressure. Aging populations need multigenerational housing options, and warm-climate construction economics make small detached units cheaper to build. Texas, Georgia, and South Carolina counties rank lower but are climbing year over year as local zoning boards adapt to state preemption bills.
Interpreting the Patterns
Three themes explain the hierarchy:
- Statewide policy preemption works. Where states standardize ADU rules, local production skyrockets.
- Housing pressure and lot availability intersect. Coastal metros build ADUs to fight scarcity; suburban Sunbelt counties approve them for family flexibility.
- Economic incentives drive adoption. In high-cost markets, rental income motivates homeowners; in lower-cost metros, ADUs serve as family or retirement housing.
When pulling the data, we looked at all counties issuing at least 100 ADU permits since 2018, resulting in 627 counties across the nation. Here’s the breakdown of the top 20 states, with their county counts that made that cut:
| STATE | COUNTY_COUNT |
|---|---|
| FL | 76 |
| CA | 71 |
| TX | 48 |
| NC | 46 |
| OR | 38 |
| WA | 37 |
| VA | 35 |
| LA | 25 |
| CO | 19 |
| OH | 19 |
| MD | 16 |
| GA | 15 |
| AZ | 13 |
| IL | 13 |
| MA | 12 |
| SC | 11 |
| IN | 9 |
| NY | 8 |
| TN | 8 |
Note: States may have more jurisdictions than counties. Example, while Florida only has 67 counties, there are 389 permit jurisdictions, which include municipal, county, and other state agencies responsible for issuing permits. Since 2018, 76 of those jurisdictions issued over 100 ADU permits, making the top of the list above.
ADU Laws and Regulations Across America
Housing policy and land use rules in the U.S. are primarily governed at the state and local levels, creating significant regional variations in ADU regulations:
- California leads with progressive reforms since 2016, streamlining approvals and eliminating barriers like excessive parking requirements. LA county subsequently enacted a “pre-approved ADU standard plans program” to streamline builds.
- Oregon, Washington, and Vermont have implemented similar statewide reforms to encourage ADUs in traditionally single-family zones.
- States like Texas and Florida maintain local control, resulting in inconsistent city-by-city regulations.
These regulatory differences stem from each region's unique political landscape, available land, infrastructure capacity, and community perspectives on housing density. In summary:
| State | Key ADU Policy | Effective Year | Impact |
|---|---|---|---|
| California | By-right statewide, 120-day permit shot clock, no parking near transit | 2020 | >100,000 ADUs approved |
| Washington | Two ADUs per lot, capped fees, clear design rules | 2023 | Fastest growth rate since 2023 |
| Oregon | Statewide legalization (HB 2001) | 2023 | Embedded in “middle housing” reforms |
| Vermont | HOME Act (S.100) eases zoning & parking | 2024 | Early-stage growth |
| Montana | SB 528 mandates at least one ADU per lot | 2024 | Full rollout in 2025 |
| Arizona | HB 2720 legalizes ADUs in large cities | 2024 | STR restrictions included |
| Colorado | HB 24-1152 allows ADUs statewide + financing support | 2025 | Launching June 30, 2025 |
Recent Municipal Trends in ADU Implementation
While state laws set the framework, cities across the country are actively updating their local codes to comply with and build upon these mandates. According to a Re-Zone.ai analysis of 150 cities, municipalities are removing barriers through zoning code revisions, streamlining permits, and eliminating parking requirements. California cities like Corona and San Diego are updating ordinances to reflect SB 1211 and AB 2533, while Arizona cities are aligning with HB 2720. Denver stands out for multiple spot rezonings that transform residential zones to support ADU integration.
Most recently, New York City has officially legalized Accessory Dwelling Units — allowing homeowners across all five boroughs to convert basements, attics, and garages or build backyard cottages into legal apartments under the city’s new “City of Yes” housing initiative. The policy, paired with the “ADU For You” support program, aims to add up to 80,000 new housing units by easing permits, offering pre-approved designs, and providing financing options. While supporters see it as a major step toward affordability and infill housing, some residents have raised concerns about parking, infrastructure, and safety standards.
Across the country, cities and states are rapidly rewriting housing laws to make ADUs easier to build. In the past month alone, St. Louis eased rules on “mother-in-law suites,” Colorado clarified its ADU permitting path, and Wisconsin advanced a package of pro-housing bills. Hawaii’s statewide reforms face pushback even as leaders defend them, Cape Cod debates ADUs near protected shorelines, and San Diego County reports that ADUs now make up over 30 percent of new housing permits. Together, these headlines mark a clear national trend: local governments are turning to small, flexible homes as a practical response to America’s housing shortage.
- St Louis: Mayor signs bill easing requirements on ‘mother-in-law suites’ as housing push continues
- Colorado: What it takes to build an ADU
- New York: NYC accepting applications for basement, backyard apartments: 10 things to know
- New York: ADAMS ADMINISTRATION OPENS APPLICATION PORTAL FOR HOMEOWNERS TO BUILD ANCILLARY DWELLING UNITS
- New York, Cape Cod: Barnstable Commissioners reaffirm their position on accessory dwelling units within the Cape Cod National Seashore
- Hawaii: Erasing progress not the way to move forward
- Wisconsin: Five bills to boost housing sail through Assembly committee, while others meet opposition
- Wisconsin: Accessory Dwellings Unit bill could see amendment. (MADISON)
- San Diego: San Diego County ADUs Account for Over 30% of New Housing Permits
- Scottsdale, AZ: Scottsdale amends 'casita' ordinance to mirror state law
- Massachusetts: Despite housing shortage, Berkshires slow to embrace ADUs — here’s why
The ADU Permit Process (and Why It Matters)
Permitting determines whether ADUs get built. A streamlined process can mean the difference between success and abandonment. In my case, when building my ADU, I was fortunate that my general contractor was familiar with all up-to-date ADU regulations and he applied for the permit on my behalf.
Why ADU Permits Are Important
- Safety & compliance – ensures code adherence for structural, electrical, and fire safety.
- Legal rental use – only permitted ADUs can be rented or sold legally.
- Financing eligibility – lenders increasingly require evidence of legal permitting.
How to Check Local ADU Regulations and Get a Permit
- Research your local zoning code – Visit your city or county planning department website to review ADU ordinances, or use third-party tools to search zoning rules by address.
- Verify state and local requirements – Check for lot size minimums, setback rules, height limits, parking mandates, and owner-occupancy requirements.
- Consult with your planning department – Schedule a pre-application meeting to clarify requirements and identify potential obstacles early.
- Hire a designer or use pre-approved plans – Many cities offer pre-approved ADU designs that expedite permitting. Licensed architects or ADU specialists can also help navigate local codes.
- Submit your permit application – Include site plans, floor plans, elevations, and engineering documents. In reform states, approvals typically come within 60–120 days.
- Coordinate utility connections – Work with local utilities early to schedule water, sewer, and electrical hookups, as delays here can stall construction.
Common Barriers That Stifle ADU Growth
- Owner-occupancy requirements (limit financing, flexibility).
- Excessive parking mandates (often make lots infeasible).
- Discretionary design review (creates local veto points).
- High impact or utility fees.
- Utility connection delays.
The Future of ADUs and Housing Affordability
ADUs are not a silver bullet, but they are a scalable part of a balanced housing policy. When paired with financing tools, pre-approved design plans, and clear standards, ADUs can:
- Add housing quickly.
- Empower homeowners.
- Diversify neighborhoods.
Looking Ahead: Policy Integration and Scaling
The future of ADUs lies in integrating them into broader housing affordability strategies. As reform states demonstrate what's possible, the next wave of innovation will focus on connecting ADU production with explicit affordability goals. This means designing financing programs that prioritize lower-income homeowners, creating deed-restricted affordable ADU programs, and pairing ADU legalization with tenant protections and anti-displacement measures.
Emerging Financing Models
The biggest barrier to ADU growth remains upfront capital. Future progress depends on expanding access to low-interest loans, forgivable loans tied to affordability covenants, and public-private financing partnerships. Programs like California's CalHFA ADU grants and New York City's "ADU For You" initiative point toward a future where municipalities actively subsidize ADU construction in exchange for below-market rents or long-term affordability commitments.
Technology and Standardization
Prefabrication and modular construction will play a growing role in reducing ADU costs and construction timelines. As more jurisdictions adopt pre-approved design catalogs and standardized utility connection processes, building an ADU will become faster and more predictable. Digital permitting platforms and AI-powered zoning tools will further streamline the approval process, making ADUs accessible to a broader range of homeowners.
Federal Policy Potential
While ADU reform has been driven primarily at the state and local level, federal policy could accelerate adoption nationwide. Potential federal actions include conditioning infrastructure or housing grants on ADU-friendly zoning, creating federal tax incentives for ADU construction, and establishing national financing programs similar to FHA-backed ADU loans. Federal leadership could help standardize best practices and incentivize lagging states to adopt meaningful reforms.
The Affordability Equation
ADUs won't solve housing affordability alone, but they represent a crucial tool in a comprehensive strategy. When combined with zoning reform that allows mid-density housing, tenant protections, social housing programs, and targeted subsidies, ADUs can meaningfully expand the supply of naturally occurring affordable housing. The key is ensuring that ADU policies don't just benefit wealthy homeowners but actively support low- and moderate-income families in building wealth and accessing housing.
The Path Forward
As cities and states continue to remove barriers through zoning updates, pre-approved designs, financing programs, and standardized utility connections, ADUs will play an increasingly important role in addressing housing shortages. The formula is clear: legalize, standardize, de-risk, and finance. When done right, ADUs add housing quickly, create economic opportunity for homeowners, and make neighborhoods more diverse and adaptable to 21st-century living patterns.
ADU Policy Playbook: What Works
- Legalize ADUs statewide (by-right, with a 120-day shot clock).
- Ban owner-occupancy mandates.
- Reduce parking and fee requirements.
- Mandate clear, objective design standards.
- Standardize utility connection processes.
- Support ADU financing for low-income homeowners.
- Allow more than one ADU per lot.
Conclusion
America's housing crisis demands bold, scalable solutions, and ADUs offer exactly that. By transforming underutilized residential land into productive housing, ADUs add supply where it's needed most: in established neighborhoods with existing jobs, schools, and infrastructure. They won't solve the crisis alone, but when combined with smart policy reforms and accessible financing, ADUs represent one of the fastest, most cost-effective tools available to expand housing opportunity across the country.The formula is clear: legalize, standardize, de-risk, and finance— and watch thousands of small homes add up to meaningful relief in the fight against housing scarcity.
Frequently Asked Questions About Accessory Dwelling Units (ADUs)
What is an ADU?
An accessory dwelling unit (ADU) is a secondary housing unit on a single-family residential lot. ADUs go by many names — granny flats, in-law suites, backyard cottages, casitas, or secondary suites. They can be detached structures in a backyard, converted garages, basement apartments, or additions to an existing home. ADUs include their own kitchen, bathroom, and living space, making them fully functional independent homes.
Are ADUs legal in my state?
Yes — ADUs are now legal in most U.S. states, but specific rules vary significantly by location. States like California, Washington, Oregon, Colorado, and Vermont have implemented strong statewide reforms that require local governments to allow ADUs by-right with streamlined permitting. Other states have more limited frameworks or leave ADU regulation entirely to local municipalities. Check our state-by-state comparison table above to see your state's specific ADU laws, including whether owner-occupancy is required, how many ADUs are allowed per lot, and typical permit timelines.
Do ADUs increase property value?
Yes. Legal, permitted ADUs typically increase property values by 20–35%, according to real estate studies. The exact increase depends on the ADU's size, quality, location, and local rental market. An ADU adds both physical square footage and income-generating potential, making properties more attractive to buyers. However, unpermitted ADUs can actually decrease property value and create legal liability, which is why obtaining proper permits is essential.
How much does it cost to build an ADU?
ADU construction costs vary widely based on size, type, location, and finishes. Garage conversions typically cost $50,000–$150,000. Detached new construction ADUs range from $150,000–$400,000 depending on size and market. Prefab or modular ADUs can sometimes reduce costs to $100,000–$250,000. The most significant cost factors include site preparation, utility connections, permit fees, and local labor rates. In high-cost markets like the San Francisco Bay Area, costs can exceed $500 per square foot.
Can I rent my ADU on Airbnb or as a short-term rental?
It depends on your local regulations. Some states and cities (like Arizona) explicitly restrict short-term rentals for ADUs to preserve long-term housing supply. Other jurisdictions allow short-term rentals but may require separate permits, business licenses, and compliance with occupancy taxes. Many ADU reforms specifically prohibit short-term rental use to ensure ADUs serve as permanent housing. Check your city's short-term rental ordinances and ADU regulations before listing your unit on platforms like Airbnb or VRBO.
How long does it take to get an ADU permit?
In states with strong ADU reforms like California and Washington, permit approval typically takes under 120 days by law. However, in jurisdictions without streamlined processes, permitting can take 6–18 months or longer. The timeline depends on several factors: whether your jurisdiction has by-right approval or requires discretionary review, the completeness of your application, local planning department capacity, and whether you're using pre-approved plans. Many cities now offer expedited review for ADUs that use pre-approved designs. Check out our recent index that sheds light on this topic.
Do I need to live on the property to build an ADU?
It depends on your state and local laws. Many older ADU ordinances require the property owner to live in either the primary home or the ADU — known as an owner-occupancy requirement. However, leading ADU reform states like California, Washington, Oregon, and Colorado have banned owner-occupancy mandates, recognizing that they limit financing options and prevent property owners from maximizing housing production. Check your local regulations to see if owner-occupancy applies in your area.
Do ADUs require separate utility connections?
Sometimes. Requirements vary by jurisdiction and utility provider. Some ADUs can share existing water, sewer, and electrical service with the main house through submetering. Others require separate connections, which can add $10,000–$50,000+ to project costs depending on distance from existing infrastructure. Many ADU reform laws now require utility companies to publish standardized connection fees and timelines to reduce uncertainty. Early coordination with your local utility providers is critical to avoid delays and budget overruns.
Do I need parking for my ADU?
Not necessarily. Many ADU reform laws have eliminated or significantly reduced parking requirements, recognizing that mandatory parking increases costs and reduces feasibility on small urban lots. California, for example, prohibits parking requirements for ADUs within half a mile of transit. However, some jurisdictions still require one parking space per ADU. Check your local zoning code or consult with your planning department to understand parking requirements in your area.
Can I have more than one ADU on my property?
In many reformed jurisdictions, yes. California allows up to two ADUs per single-family lot — typically one detached unit and one attached or garage conversion. Oregon permits ADUs in all single-family zones statewide. Local rules vary widely, so check your city or county's specific ADU ordinance. Some areas limit ADUs to one per lot, while progressive jurisdictions allow multiple units to maximize housing production on existing lots.
How do I find pre-approved ADU plans?
Many cities and counties now offer libraries of pre-approved ADU designs that meet local building and zoning codes. These plans expedite permitting because structural, electrical, and code compliance have already been reviewed. Check your local planning department website or search for "[Your City] pre-approved ADU plans." Additionally, organizations like the American Institute of Architects (AIA) and state housing agencies often provide ADU design resources. Using pre-approved plans can save thousands of dollars in architectural fees and reduce permit review time.
Are there financing options specifically for ADUs?
Yes. Financing options for ADUs have expanded significantly in recent years. Homeowners can use home equity lines of credit (HELOCs), cash-out refinancing, construction loans, or personal loans. Some lenders now offer ADU-specific loan products. Additionally, several states and cities offer low-interest loan programs, grants, or forgivable loans for homeowners who build ADUs and rent them at below-market rates. The State of California, for example, offers the CalHFA ADU Grant Program. New York City provides financing support to help homeowners cover upfront ADU construction costs.
How do ADUs help with housing affordability?
ADUs expand housing supply without requiring new land or major infrastructure investment. Because they're smaller and less expensive to build than traditional homes, ADUs typically rent for less than comparable apartments, creating naturally affordable housing options. They also allow homeowners to generate rental income, which can help cover mortgage payments and build wealth. At scale, ADUs contribute meaningfully to overall housing production — in San Diego County, ADUs now represent over 30% of new housing permits, and California has approved over 100,000 ADUs since 2020.
What are the most common barriers to building an ADU?
The most common barriers include: - High upfront construction costs ($100,000–$400,000+) - Complex or lengthy permitting processes in unreformed jurisdictions - Owner-occupancy requirements that limit financing flexibility - Excessive parking mandates that make small lots infeasible - Utility connection delays and high impact fees - Lack of contractor familiarity with ADU regulations - Restrictive design review processes that create local veto points
States and cities that have removed these barriers see significantly higher ADU production rates.
Where can I find ADU permit data and trends?
Platforms like Shovels.ai track millions of building permits across the U.S., including detailed ADU permit data. This data helps researchers, policymakers, and industry professionals understand where ADUs are being built, how regulations impact production, and how ADU growth contributes to overall housing supply. Many cities and counties also publish annual ADU permit reports on their planning department websites.