

It's hard to understand precisely why homeowners choose to invest in their homes at certain times. By looking at specific installations at the census tract level, we can begin to develop this understanding.
In this post, we look specifically at solar adoption in San Diego, California. The understanding of what drives building electrification at the neighborhood level has become essential for policymakers, urban planners, and sustainability advocates. At Shovels, we've been analyzing permit data across the United States to uncover these types of patterns in construction activity.
One question has particularly intrigued us: Why do some communities adopt building electrification faster than others?
Our recent analysis of the San Diego-Chula Vista-Carlsbad metropolitan area has revealed some surprising insights about solar adoption patterns that challenge conventional assumptions about urban electrification.
The Big Question
What factors drive electrification adoption? The usual suspects include:
- Tax incentives
- Energy prices
- "Keeping up with the Joneses" social influence
- Housing stock age
- Resident wealth
- Solar company marketing efforts
But which of these factors actually matter most? And how can we measure their impact?
Our Analytical Approach
Rather than starting with hypotheses about what might drive adoption, we took a data-first approach:
- Focus on a diverse region: We selected the San Diego-Chula Vista-Carlsbad, CA metropolitan area because California has excellent electrification data and this region offers demographic diversity.
- Census tract analysis: We analyzed at the census tract level (smaller than ZIP codes or cities) to capture neighborhood patterns and connect to public datasets.
- Building Electrification (BE) density metric: We developed a metric to measure the cumulative adoption of electrification technologies over time.
Why a Composite Electrification Metric Matters
Studying building electrification through a single technology (like just solar panels) gives an incomplete picture. True urban sustainability comes from the combined adoption of multiple complementary technologies. Our building electrification (BE) density metric captures this holistic transformation by:
- Accounting for the synergistic relationship between different electrification technologies
- Recognizing communities making progress across multiple dimensions
- Identifying neighborhoods that might serve as models for comprehensive electrification
- Helping policymakers understand which areas have balanced adoption versus those with lopsided patterns
How We Calculate Building Electrification (BE) Density
The Shovels BE density score consists of:
- Base score (0-100): The average of percentile rankings for solar, heat pump, and EV charger adoption rates across census tracts. This creates a balanced foundation that values all three technologies equally.
- Technology leadership bonus: +10 points for each technology where the tract ranks in the top 10% (90th percentile) of adoption. This rewards neighborhoods showing exceptional adoption of specific technologies.
- Comprehensive adoption bonus: +15 additional points if a tract is in the top 10% for ALL three technologies simultaneously. This significant bonus recognizes truly forward-thinking communities that have embraced electrification holistically.
This scoring system allows us to identify not just high adoption areas, but specifically those neighborhoods that demonstrate balanced, multi-technology transitions away from fossil fuels—the true leaders in urban electrification.
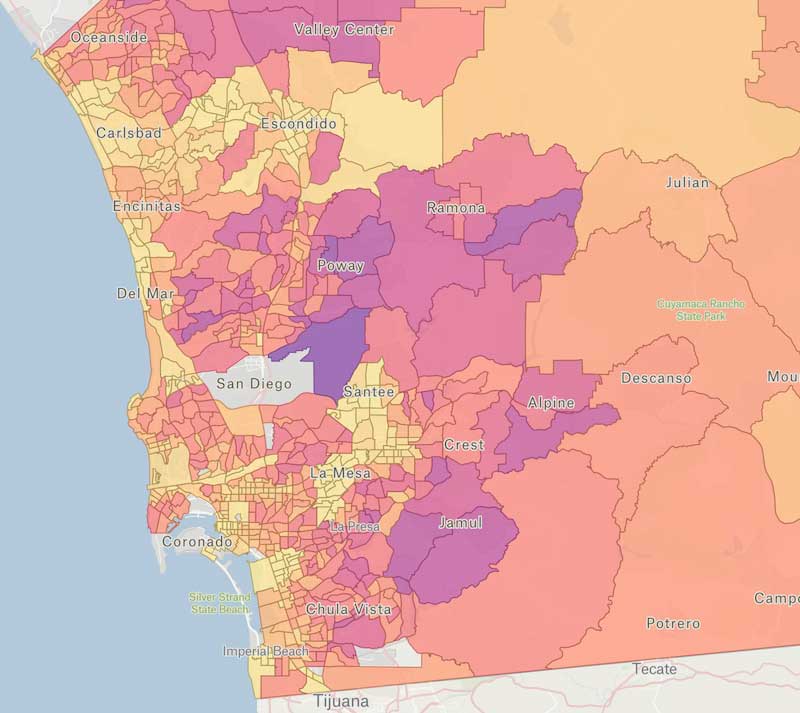
Key Findings: Two Geographic Clusters Stand Out
When we mapped BE density across the region, we discovered something intriguing: the highest-ranking census tracts were not randomly distributed but clustered primarily in two cities - Poway and Chula Vista.

Background on Poway and Chula Vista
Poway
Poway is a suburban city located in San Diego County, California, often referred to as "The City in the Country" due to its rural feel despite being part of the San Diego metropolitan area. It has a population of approximately 50,000 residents.
Key characteristics:
- Incorporated in 1980 but most of its housing stock dates to the 1970s.
- Located inland, about 25 miles northeast of downtown San Diego
- Higher median household income than the county average ($110,000+)
- Predominantly residential with some light industrial areas
- Known for excellent school district (Poway Unified School District serves parts of neighboring communities as well)
- More spacious lots and properties (typically quarter-acre to acre+ lots)
- Demographics skew more affluent and less diverse than the county average
- Contains a mix of older established neighborhoods and newer developments

Chula Vista
Chula Vista is the second-largest city in the San Diego metropolitan area, with a population of approximately 275,000 residents. Its name means "beautiful view" in Spanish.
Key characteristics:
- Incorporated in 1911
- Located just south of San Diego and north of the Mexican border
- Has experienced rapid growth since the 1980s and a lot of new construction
- Divided geographically between the older western portion (closer to the bay) and newer eastern developments
- Eastern Chula Vista (where most of the high solar adoption areas are located) consists largely of master-planned communities built since the 1990s
- More ethnically diverse than the county average, with a large Hispanic/Latino population (approximately 60%)
- Mix of working-class, middle-class, and upper-middle-class neighborhoods
- Has been proactive in sustainability initiatives, including the Chula Vista Climate Action Plan
The contrast between these two cities makes their similar solar adoption rates particularly interesting - Poway is smaller, more affluent, with older housing stock and more rural character, while Chula Vista is larger, more diverse, with newer housing in its eastern developments and a more suburban/urban character.
Solar Adoption Growth Patterns
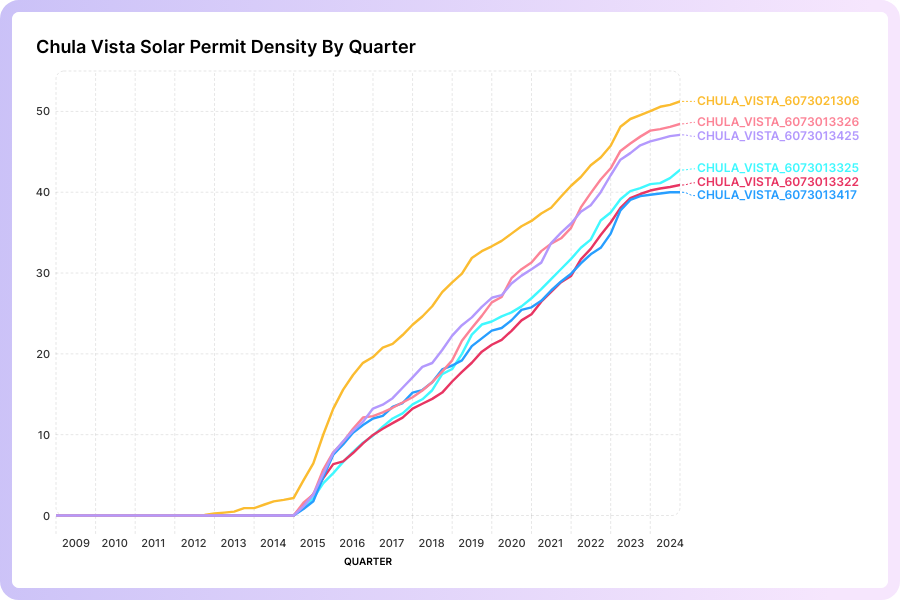
When tracking solar permit density over time, both Poway and Chula Vista show remarkable growth trajectories, but with distinct patterns that reflect their different development timelines and community characteristics. The quarter-by-quarter data reveals not just when adoption began, but how quickly it accelerated and whether growth has been sustained.
Chula Vista:
- Steep growth curve starting in 2015 in most high-density tracts, coinciding with the city's implementation of its "Solar Ready" ordinance
- The highest density tract began growing two years earlier (2013), possibly serving as a catalyst for surrounding neighborhoods
- Consistent growth of about 4.5 points per year since 2017, showing remarkable stability even through economic fluctuations
- All high-adoption tracts show nearly parallel growth trajectories, suggesting coordinated development or similar market forces
- Solar adoption reached 50+ permits per 100 households in top tracts by 2023
- Growth pattern shows minimal seasonality, indicating year-round installation activity
- Eastern master-planned communities show the highest adoption rates, with newer homes (post-2000) embracing solar technology
Poway:
- Generally higher solar density compared to Chula Vista throughout the time series
- Began adoption 3-5 years earlier than Chula Vista, with meaningful growth beginning around 2010-2011
- Initial adoption concentrated in higher-income neighborhoods before spreading throughout the city
- Peak early growth of 5.2 points per year (2014-2017), settling to 4.2 points annually in recent years
- More varied adoption curves between different census tracts compared to Chula Vista, suggesting less coordinated development
- By 2023, top tracts reached 65+ permits per 100 households, approximately 30% higher than Chula Vista's peak
- Growth continued steadily even in older neighborhoods with pre-1980 housing stock
- Shows evidence of "neighborhood effect" where adoption clusters in adjacent areas
- Highest-density tract (607301705) shows distinctly faster growth than others, reaching 65+ permits per 100 households by 2023
Both cities demonstrate strong and sustained solar adoption despite their different demographic profiles, housing stock age, and development patterns, challenging conventional assumptions about which neighborhoods are most likely to embrace renewable energy technologies.
Comparing Housing and Adoption Characteristics
When we dove deeper into the housing characteristics and adoption patterns, we discovered some counterintuitive findings:
| Metric | Poway | Chula Vista |
|---|---|---|
| Properties | 8,797 units | 5,939 units |
| Median Build Year | 1979 | 2002 |
| Permit Activity | 83.4% | 68.9% |
| Solar Adoption | 55.0% | 53.1% |
| Heat Pump Adoption | 1.4% | 1.3% |
| EV Charger Adoption | 3.1% | 1.9% |
| Combined Electrification | 19.8% | 18.8% |
What stands out immediately is that Poway has nearly identical solar adoption rates to Chula Vista despite having much older homes. This contradicts the conventional wisdom that newer homes are more suitable for solar installations.
Looking at housing stock more closely reveals that Poway has a more diverse and older housing stock, yet manages to achieve comparable solar adoption.
The Permitting Factor: Comparing with San Diego
Looking at this data comparison between Poway, San Diego, and Chula Vista, several key insights emerge about how residential solar permitting varies significantly across these neighboring jurisdictions:
| Metric | Poway | San Diego | Chula Vista |
|---|---|---|---|
| Total Residential Solar Permits | 8,393 | 110,618 | 21,725 |
| Median Job Value (Residential) | $18,407 | $23,540 | $15,300 |
| Average Job Value (Residential) | $26,518 | $173,015 | $19,231 |
| Median Approval Duration | 27 days | 84 days | 0 days |
| Average Approval Duration | 38 days | 136 days | 12 days |
| Median Permit Fees | No data | $299 | $457 |
| Average Permit Fees | No Data | $359 | $587 |
Scale and Volume Differences
San Diego processes by far the largest number of residential solar permits (110,618), which is approximately 5 times more than Chula Vista (21,725) and 13 times more than Poway (8,393). This massive difference in volume likely influences their respective processes and systems.
Permit Value Anomalies
The most striking anomaly is San Diego's average job value ($173,015), which is roughly 6.5 times higher than Poway's ($26,518) and 9 times higher than Chula Vista's ($19,231). However, the median values are much closer ($23,540 for San Diego vs. $18,407 for Poway and $15,300 for Chula Vista). This suggests San Diego has some extremely high-value residential solar projects skewing its average upward.
Processing Efficiency Contrasts
The approval duration data reveals dramatic differences in permitting efficiency:
- Chula Vista: Remarkably fast with 0 days median approval time (suggesting same-day approvals) and a 12-day average
- Poway: Moderate processing time with 27 days median and 38 days average
- San Diego: Significantly slower with 84 days median and 136 days average
Chula Vista appears to have created an extremely efficient permitting process that somehow processes permits much faster than both Poway and San Diego, despite handling more than double Poway's volume.
Fee Structure Variations
The permit fee data shows an interesting pattern:
- San Diego has lower median fees ($299) compared to Chula Vista ($457)
- However, Chula Vista's solar adoption rate is higher than San Diego's
This suggests that permit fees alone don't explain adoption differences, and that processing speed may be a more significant factor than cost.
Implications and Questions
This data raises important questions:
- How has Chula Vista achieved such rapid approval times, and could their process be replicated elsewhere?
- What accounts for San Diego's dramatically higher average job values? Are they handling fundamentally different types of residential solar installations?
- Does Poway's lack of fee data reflect a different approach to permitting or just a data collection issue?
- How much does the processing time difference (0 days vs. 84 days median) influence homeowner decisions to install solar?
The fact that Chula Vista combines the fastest approval times with higher adoption rates suggests that streamlined permitting may be more important than lower fees in promoting residential solar adoption. San Diego's significantly longer approval times may be creating a barrier to adoption despite having lower fees than Chula Vista.
What Might Explain These Patterns?
Our research suggests several potential factors that might be driving the higher adoption rates in Poway and Chula Vista:
- Local Policy Initiatives: In 2015, Chula Vista added a "Solar Ready" ordinance requiring residential units to be pre-wired for solar photovoltaics, while Poway established an expedited permitting process for small residential rooftop solar systems.
- Cost Factors: Chula Vista's significantly lower permit fees ($458 vs. San Diego's $6,420) likely reduce barriers to installation.
- Franchise Fees: Chula Vista has a 2% franchise fee on energy, which may impact electricity costs and make solar more attractive.
- Targeted Marketing: Solar companies may have concentrated their door-to-door sales efforts in Poway and Chula Vista.
- Community Network Effects: Once adoption begins in a neighborhood, visible solar installations may accelerate the "keeping up with the Joneses" effect.
Finding the "Sweet Spot" for Solar Market Expansion
Why Target Areas with Moderate Building Electrification Scores
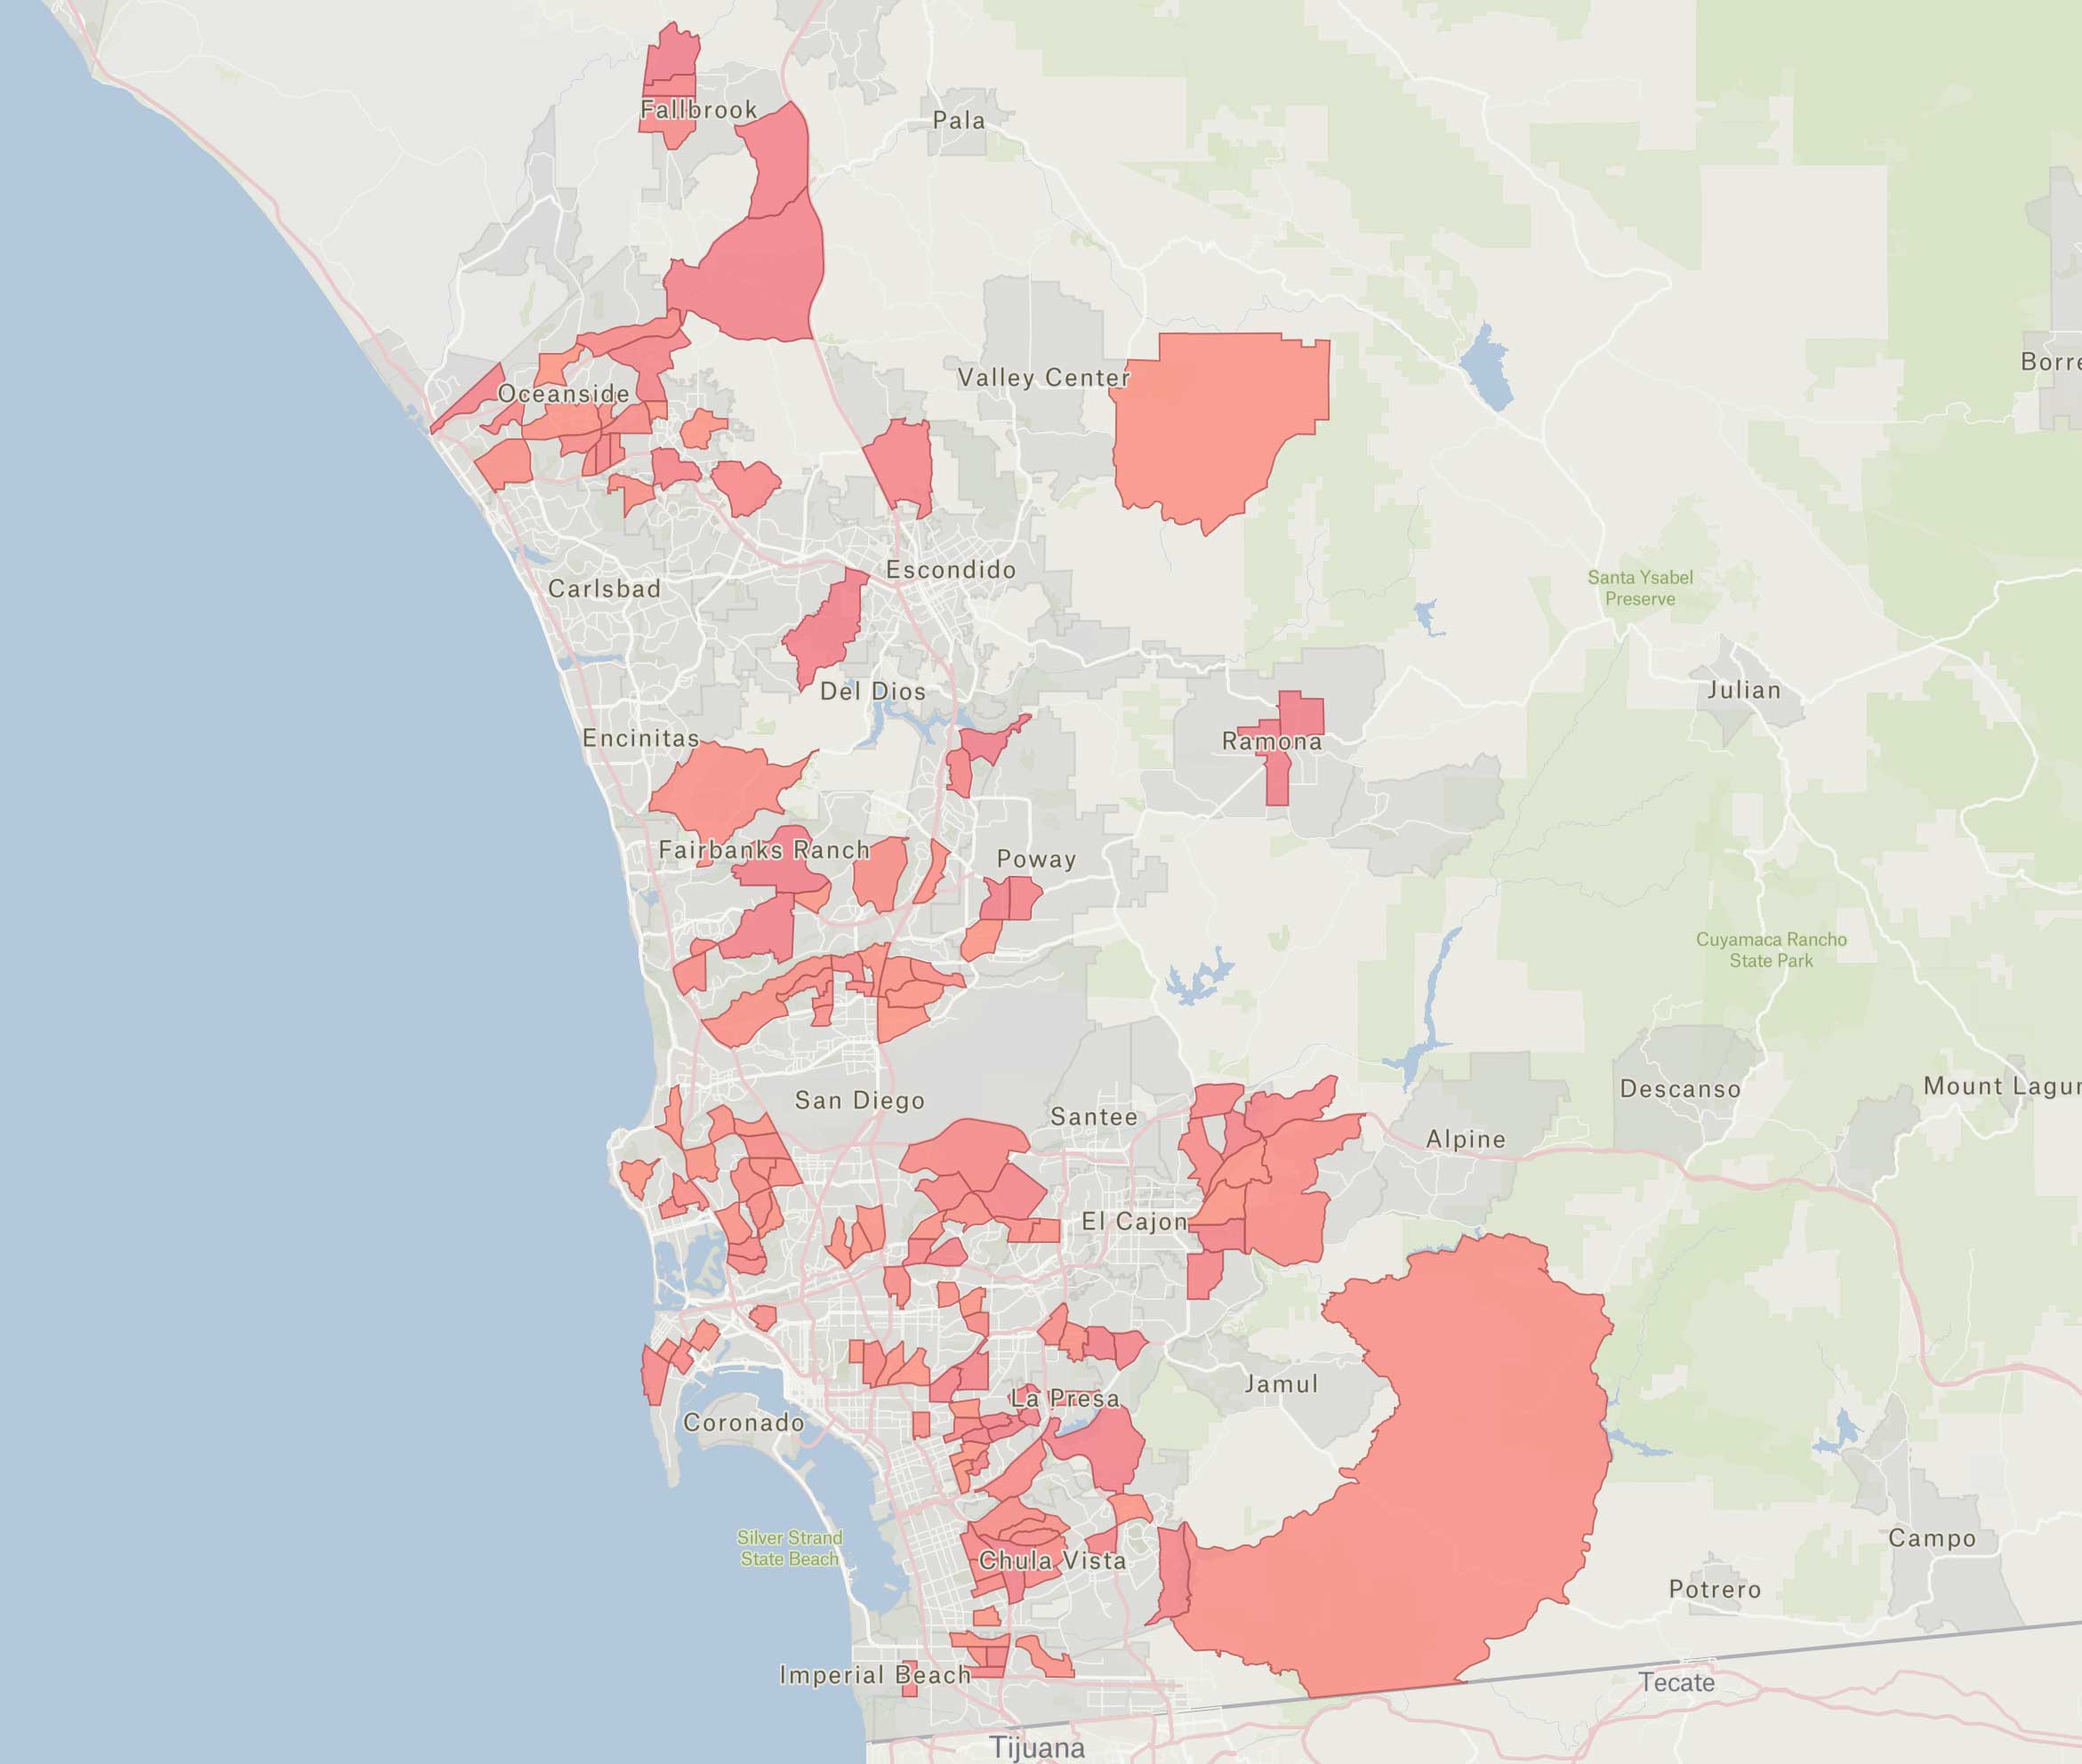
The map of the San Diego metropolitan area reveals an intriguing pattern of building electrification (BE) adoption. While our analysis has focused on the high-performing areas in Poway and Chula Vista, there's a compelling case for solar companies to direct their attention to census tracts with moderate BE scores of around 30.
These "middle-tier" adoption areas, highlighted in light pink on the map, represent communities that have begun their electrification journey but haven't yet reached saturation. Several factors make these moderate-adoption tracts particularly attractive targets:
Growth Trajectory Advantage
Census tracts with BE scores around 30 are likely in the steep part of their adoption S-curve. Unlike high-adoption areas that may be approaching saturation, or low-adoption areas that haven't yet overcome initial barriers, these middle-adoption communities have:
- Demonstrated receptiveness to solar technology
- Established proof points with visible installations
- Overcome initial community skepticism
- Not yet reached market saturation
Lower Competition Landscape
The map shows these moderate-adoption tracts scattered throughout the San Diego region, including areas near El Cajon, portions of northern San Diego, and sections of Oceanside. Solar companies may find:
- Less competitive pressure than in high-adoption hotspots
- Lower customer acquisition costs
- More available qualified properties
- Potentially faster permitting as these jurisdictions refine their processes
Network Effect Potential
These moderate-adoption areas represent the perfect environment for triggering "solar contagion" – the documented tendency for solar adoption to spread through social networks and neighborhoods. The map shows clusters of moderate adoption where:
- Successful installations provide visible demonstration effects
- Local social proof exists but hasn't saturated the market
- Word-of-mouth referrals can accelerate growth
- Neighborhood competition may motivate additional homeowners
Targeting Efficiency
Looking at the geographic distribution on the map, these moderate-adoption areas provide an efficient targeting strategy that balances risk and opportunity:
- Diverse geographic spread across multiple jurisdictions
- Varied neighborhood types from coastal to inland communities
- Mix of newer and established neighborhoods
- Proximity to high-adoption areas that can serve as success models
For solar companies seeking to optimize their marketing and sales efforts, these moderate-adoption census tracts represent the "Goldilocks zone" – not too early, not too late, but just right for accelerated growth. By focusing on communities with BE factors around 30, companies can potentially achieve higher conversion rates while helping these areas advance along their electrification journey.
Conclusions and Next Steps
Our analysis reveals that building electrification adoption doesn't follow simplistic patterns based on housing age or neighborhood wealth alone. The similar adoption rates between Poway (with older homes) and Chula Vista (with newer homes) suggest that policy interventions, permitting processes, and cost factors may play outsized roles.
For policymakers seeking to accelerate urban electrification, several lessons emerge:
- Streamline permitting: Fast approvals and lower fees appear to correlate with higher adoption rates.
- Pre-wiring requirements: Chula Vista's "Solar Ready" ordinance may have removed barriers to installation.
- Focus on accessible installations: Both Poway and Chula Vista show higher adoption with lower-cost installations ($15,000-$18,600) compared to San Diego's higher-cost projects.
More research is needed to fully understand these patterns. Future investigations could:
- Analyze energy price differences at a more granular level
- Track door-to-door sales campaign patterns
- Investigate at the Census Block rather than Census Tract level
- Evaluate the longer-term impact of the 2015 ordinances in both cities
As cities worldwide seek to meet climate goals through building electrification, understanding the success stories of communities like Poway and Chula Vista offers valuable insights for creating policies that accelerate adoption while ensuring accessibility across diverse housing stocks and neighborhoods.
Frequently Asked Questions
Q: What is building electrification (BE) density, and how is Shovels measuring it?
A: Building electrification density is a composite score that measures the cumulative adoption of solar panels, heat pumps, and EV chargers within a census tract. The score consists of a base score (0-100) averaging percentile rankings across all three technologies, plus bonus points for top-10% performance in individual technologies or across all three simultaneously.
Q: Why do Poway and Chula Vista have similar solar adoption rates despite very different housing stock?
A: Despite Poway's median build year of 1979 and Chula Vista's of 2002, both cities achieved solar adoption rates above 53%. This suggests that housing age alone does not determine solar adoption. Local policy initiatives, streamlined permitting processes, and lower installation costs appear to play a more significant role than the age of homes.
Q: How does permitting speed affect residential solar adoption?
A: The data strongly suggests that faster permitting correlates with higher adoption. Chula Vista has a median approval time of 0 days (same-day approvals) and a 53% solar adoption rate, while San Diego's 84-day median approval time correlates with lower adoption. This indicates that streamlined permitting may be more important than lower fees in driving solar installations.
Q: What census tracts should solar companies target for the best growth opportunities?
A: Shovels recommends targeting census tracts with moderate BE scores around 30. These "middle-tier" areas have demonstrated initial receptiveness to solar, have visible proof points, and have not yet reached market saturation. They offer lower competition, lower customer acquisition costs, and strong potential for the "neighborhood effect" where visible installations drive further adoption.
Q: What policy factors helped drive solar adoption in Chula Vista and Poway?
A: In 2015, Chula Vista enacted a "Solar Ready" ordinance requiring new residential units to be pre-wired for solar, and also maintains significantly lower permit fees ($458 vs. San Diego's $6,420). Poway established an expedited permitting process for small residential rooftop solar systems. Both cities also benefit from a 2% franchise fee on energy, community network effects, and targeted marketing by solar companies.