

We are thrilled to announce another Kaggle dataset from the Shovels vault. Our latest file is a comprehensive mapping of state, county, and building permit jurisdictions.
What is this list of building permit jurisdictions?
The file includes over 10,000 building permit jurisdictions (AHJs -- authority-having jurisdictions), and relates each jurisdiction to its respective state and county.
We found this mapping buried in an obscure government website. We noticed that when we clicked on a state, a select box appeared with all of the counties in that state. This mapping is widely available from the US Census and many other open data sources.
But when we clicked on the county, another select box appeared with every building permit jurisdiction in the county. That got our attention. Before this discovery, we didn't know of a single source of truth for how many AHJs are out there for building permits. Now we can count at least 10,000 of them.
Who needs a list of every building permit jurisdiction?
When architects, developers, and homeowners start a new project, the first question they might ask is, "Where do I file my building permits?" The answer is far from obvious! Many cities don't have building departments; they delegate building permitting to the county.
The list we are open-sourcing today includes every building permit jurisdiction. If a city or town is on this list, then they issue their own building permits. If a city or town is not on this list, then it's safe to conclude that their AHJ is the county.
We figure many folks who work in cities and counties don't know every AHJ within their boundaries. Now they do.
How many building permit jurisdictions are in each state?
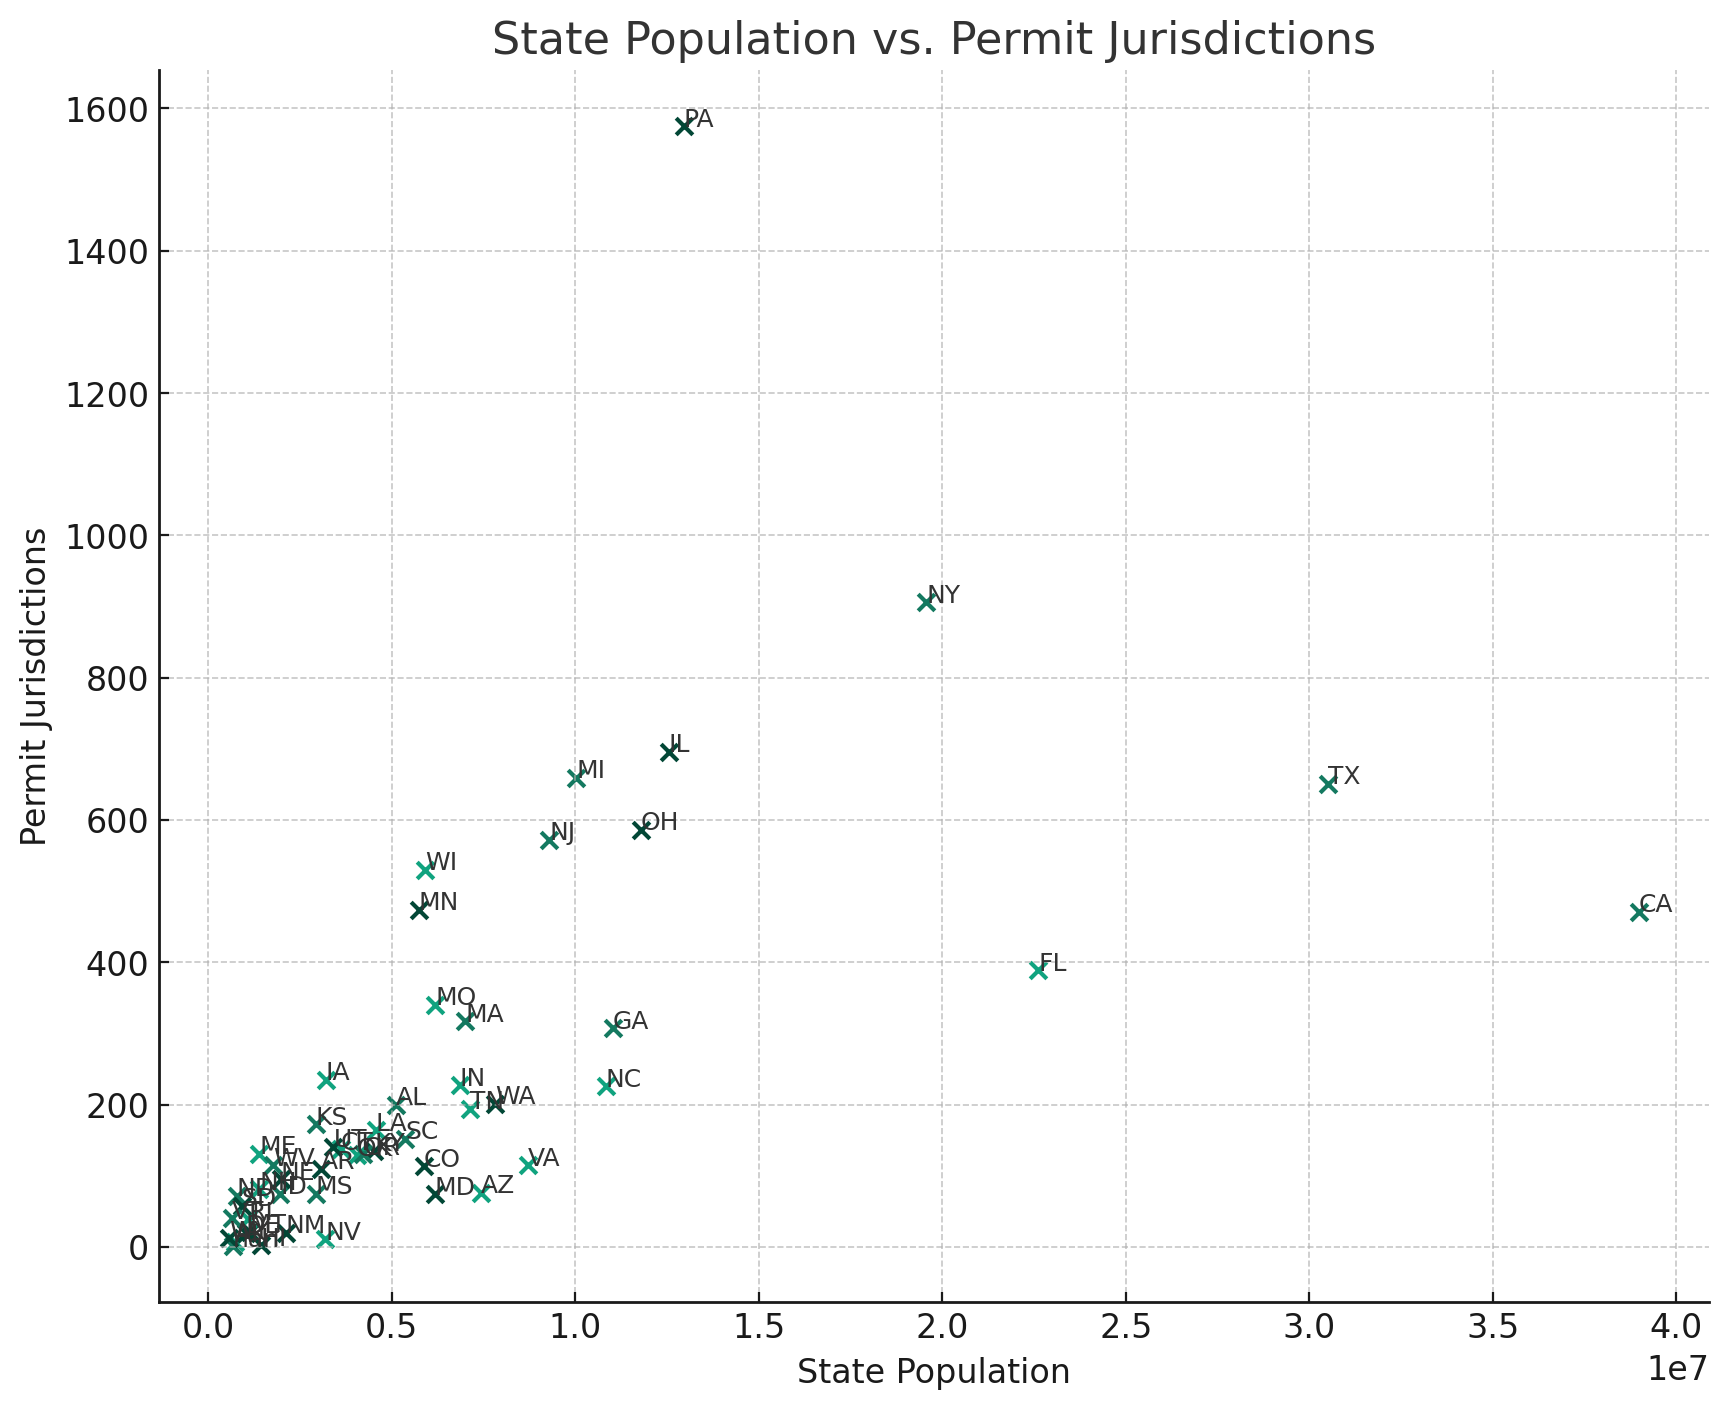
We got curious and decided to ask this data a few questions. How many AHJs are in each state? Does that jurisdiction count correlate with population? We had to merge in some public census data to figure this out.
On average, there are about ten permit jurisdictions per county. If a county has a million residents, that means each permit jurisdiction serves about 100,000 people.
Pennsylvania stands out with the highest number of permit jurisdictions, totaling 1575. No other state comes close! It's unclear why Pennsylvania needs so many of them. For example, although Pennsylvania has the same population as Ohio, it has almost 3X the number of building permit jurisdictions.
This chart makes the outliers easy to see.
And here's a table of every state, its population, number of jurisdictions, and the ratio of jurisdictions per 100,000 residents.
| State | Population | Permit Jurisdictions | Jurisdictions per 100,000 Residents |
|---|---|---|---|
| Alaska | 733406 | 7 | 0.954451 |
| Alabama | 5108468 | 200 | 3.91507 |
| Arkansas | 3067732 | 110 | 3.58571 |
| Arizona | 7431344 | 76 | 1.0227 |
| California | 38965193 | 471 | 1.20877 |
| Colorado | 5877610 | 113 | 1.92255 |
| Connecticut | 3617176 | 137 | 3.78749 |
| District of Columbia | 678972 | 1 | 0.147281 |
| Delaware | 1031890 | 20 | 1.93819 |
| Florida | 22610726 | 389 | 1.72042 |
| Georgia | 11029227 | 307 | 2.78351 |
| Hawaii | 1435138 | 2 | 0.139359 |
| Iowa | 3207004 | 235 | 7.32771 |
| Idaho | 1964726 | 75 | 3.81733 |
| Illinois | 12549689 | 696 | 5.54595 |
| Indiana | 6862199 | 227 | 3.30798 |
| Kansas | 2940546 | 172 | 5.84925 |
| Kentucky | 4526154 | 135 | 2.98266 |
| Louisiana | 4573749 | 164 | 3.58568 |
| Massachusetts | 7001399 | 317 | 4.52767 |
| Maryland | 6180253 | 74 | 1.19736 |
| Maine | 1395722 | 131 | 9.38582 |
| Michigan | 10037261 | 659 | 6.56554 |
| Minnesota | 5737915 | 474 | 8.26084 |
| Missouri | 6196156 | 340 | 5.48727 |
| Mississippi | 2939690 | 75 | 2.55129 |
| Montana | 1132812 | 21 | 1.85379 |
| North Carolina | 10835491 | 226 | 2.08574 |
| North Dakota | 783926 | 72 | 9.18454 |
| Nebraska | 1978379 | 95 | 4.80191 |
| New Hampshire | 1402054 | 81 | 5.77724 |
| New Jersey | 9290841 | 572 | 6.1566 |
| New Mexico | 2114371 | 20 | 0.945908 |
| Nevada | 3194176 | 11 | 0.344377 |
| New York | 19571216 | 906 | 4.62925 |
| Ohio | 11785935 | 586 | 4.97203 |
| Oklahoma | 4053824 | 129 | 3.18218 |
| Oregon | 4233358 | 130 | 3.07085 |
| Pennsylvania | 12961683 | 1575 | 12.1512 |
| Rhode Island | 1095962 | 39 | 3.55852 |
| South Carolina | 5373555 | 152 | 2.82867 |
| South Dakota | 919318 | 58 | 6.30902 |
| Tennessee | 7126489 | 194 | 2.72224 |
| Texas | 30503301 | 651 | 2.1342 |
| Utah | 3417734 | 141 | 4.12554 |
| Virginia | 8715698 | 115 | 1.31946 |
| Vermont | 647464 | 40 | 6.17795 |
| Washington | 7812880 | 201 | 2.57267 |
| Wisconsin | 5910955 | 530 | 8.9664 |
| West Virginia | 1770071 | 115 | 6.49691 |
| Wyoming | 584057 | 12 | 2.05459 |
Conclusion
Our mission is to make government data meaningful and actionable. Our permit database, like the one we're open-sourcing today, is designed to make government data useful. It's a step in the right direction.
Here are the links again:
Grab it on Kaggle or download the CSV. You can also check data coverage across all jurisdictions in the Shovels platform.
Frequently Asked Questions
Q: What is a building permit jurisdiction (AHJ)?
A: An AHJ, or authority-having jurisdiction, is the government entity responsible for issuing building permits in a given area. Some cities issue their own permits, while others delegate permitting to the county. Shovels identified over 10,000 such jurisdictions across the United States.
Q: How do I know if my city issues its own building permits or if the county handles them?
A: If a city appears on the Shovels jurisdiction list, it issues its own building permits. If a city is not on the list, the county is likely the authority-having jurisdiction for building permits in that area.
Q: Where can I download the list of building permit jurisdictions?
A: The dataset is available for free on Kaggle at the Building Permit Jurisdictions in the United States dataset page, or you can download the CSV file directly from the Shovels website.
Q: Why does Pennsylvania have so many building permit jurisdictions compared to other states?
A: Pennsylvania has 1,575 permit jurisdictions, far more than any other state, and roughly 3 times as many as Ohio despite having a similar population. The exact reason for this is unclear, but it stands out as a significant outlier, with 12.15 jurisdictions per 100,000 residents compared to the national average of about 10 jurisdictions per county.