
Greetings!
I'm writing from Sunriver, OR, where my family's vacation ground to a halt due to air quality. There's a wildfire in Oregon. Several, actually, but the one that's bothering me right now is smoldering 75 miles to the west, and it smells like the inside of a chimney.
In happier news:
- We finally broke through a bunch of data processing hurdles to load up all of California into our internal database. The API update is imminent! We now show 21M building permits in California, where the air is perfect.
- We're still following up with Florida, Texas, and New York. We'll know more about going nationwide after this, but I'm confident that we'll get there by the end of summer.
- Our really smart friend made a cool dashboard of building electrification permits in Contra Costa County. We also tried to predict the number of EV charging permits in 2024. Links to both are below.
- Early-bird pricing is here. How does $1K/mo for unlimited access through 2023 sound?
Processing update
The full API data load is just days away. We want this next release to be pretty much perfect! With that in mind, we made these improvements:
- Cleared out all the "nan" and "null" values in the API results
- Simplified our tag list and made sure that each one has permits
- Further improved our address matching (this one was tricky!)
- Sped up the overall processing time by using more efficient data structures
Here are a few cool statistics:
- Californians file about 100,000 building permits each month
- LA and Orange Counties make up a third of all historical CA building permits
- LA, San Diego, Riverside, and Orange Counties have a third of all solar permits 🌞
- LA and Sacramento Counties (finally, some NorCal representation) are the leaders in EV charging ⚡️
- In 2022, LA County filed the most ADU permits
- Also in 2022, Riverside County led in new homes
Reminder: you can get all of this detail (the individual addresses and contractors) using our API.
Things to do with permits: Charts and dashboards
It should not be surprising that there's a lot of interest in building permits for home electrification. We're seeing this interest from climate tech companies, financial institutions, and even the public sector.
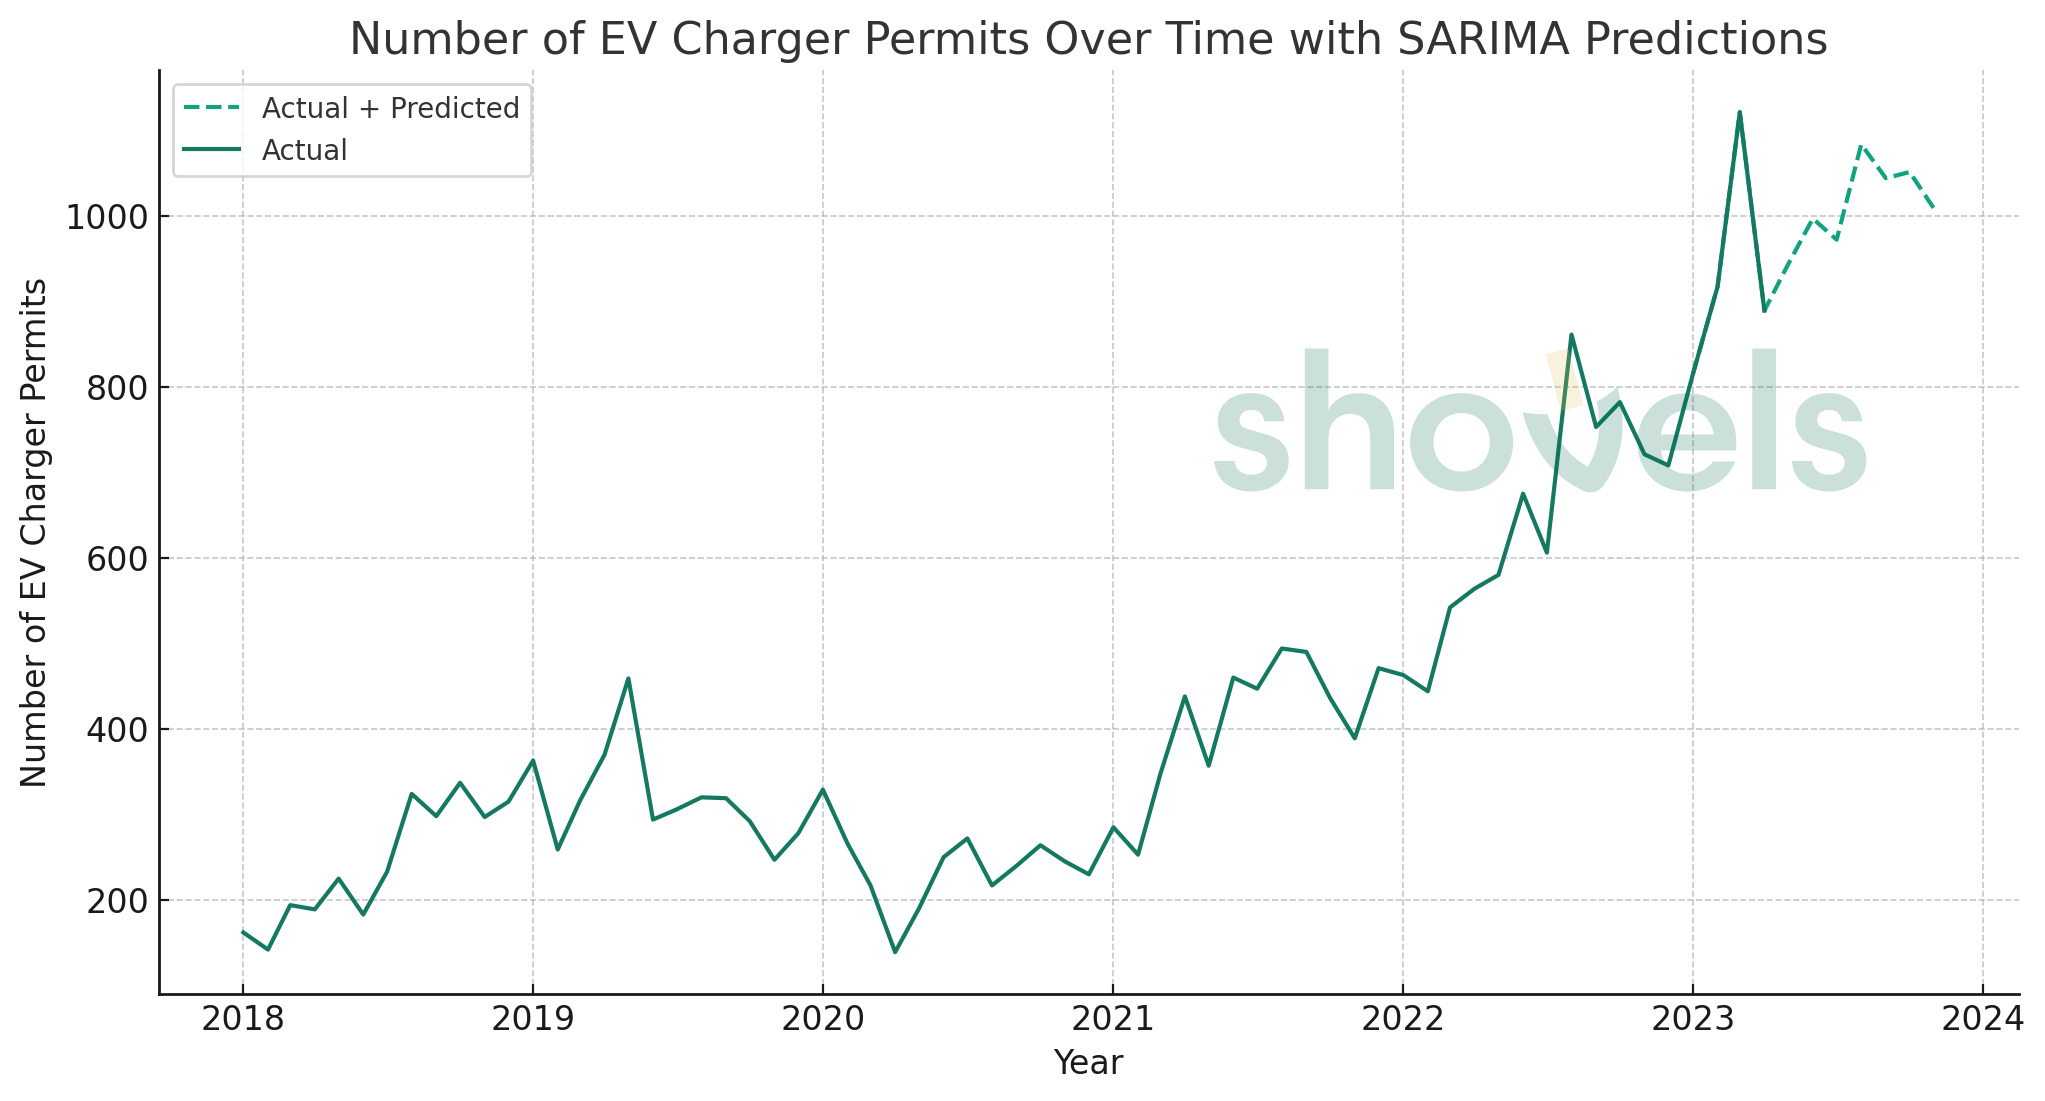
Tracking the progress of residential EV chargers is important for transportation authorities who need to plan for public EV charging stations. Communities that have more residential chargers will have less demand for public ones, so those resources can go elsewhere.
Sarah Daniels made this amazing dashboard of building electrification permits in Contra Costa County using Shovels data. If you see a need for something like this in your own community, please let us know!
We also put on our data science hats and built a prediction model for EV charger permits in CA through 2024. Predictions are the dotted line. We even decided to write a blog post about it!

Early bird pricing
We've been having a bunch of conversations about what all this Shovels data is going to cost. The short answer is this: we still don't know.
So we have a solution! Early-bird pricing that you can lock in now and keep for the rest of the year.
🐣 Early bird extra special offer 🐣
$1,000/mo
- Unlimited API requests (subject only to a reasonable rate limit)
- Nationwide coverage (meaning: everything we have loaded)
- Access to every endpoint (no future feature gating)
- Available through 2023
There are some hints here for future pricing. Plans will be limited by usage, geography, and/or endpoints. This plan locks you into an awesome price for everything!
We'll offer this to the first 10 customers who sign up. Just hit reply to get in.