
Roofs are one of the most important factors in determining (and growing) home value, even if they aren’t as flashy as other remodeling projects. New kitchens or bathrooms can elevate an existing home’s feel, but roofs increase value across the board: structural integrity, energy efficiency, and longevity.
Different neighborhoods and homeowner socio-economics can lead to a wide range of behaviors around maintaining their roofs. Richer areas may see more frequent re-roofing, whereas middle-income areas may prioritize maintenance. And low-income neighborhoods may not have the luxury of such an expensive project. This is commonly understood at an intuitive level, but isn’t the entire picture.
Shovels provides data about individual property permit history, including roofing and re-roofing, which gives us an opportunity to dig deeper into the relationship between household income and roofing permit activity.
We looked at more than 3,200 census tracts across Texas and combined that with roofing permits and owner demographics to see how the real world matches up against general understanding. Let’s see what the data says.
Key Findings
To begin, there are some obvious findings, which are supported by both conventional wisdom and academic studies, like this one from the Harvard University Joint Center for Housing Studies.
Across the board, we find that:
Higher income areas show increased permit activity
The data shows clear progressions in roof permit activity as income increases, with a striking jump in areas (census tracts) with a median annual income of $100k or greater.
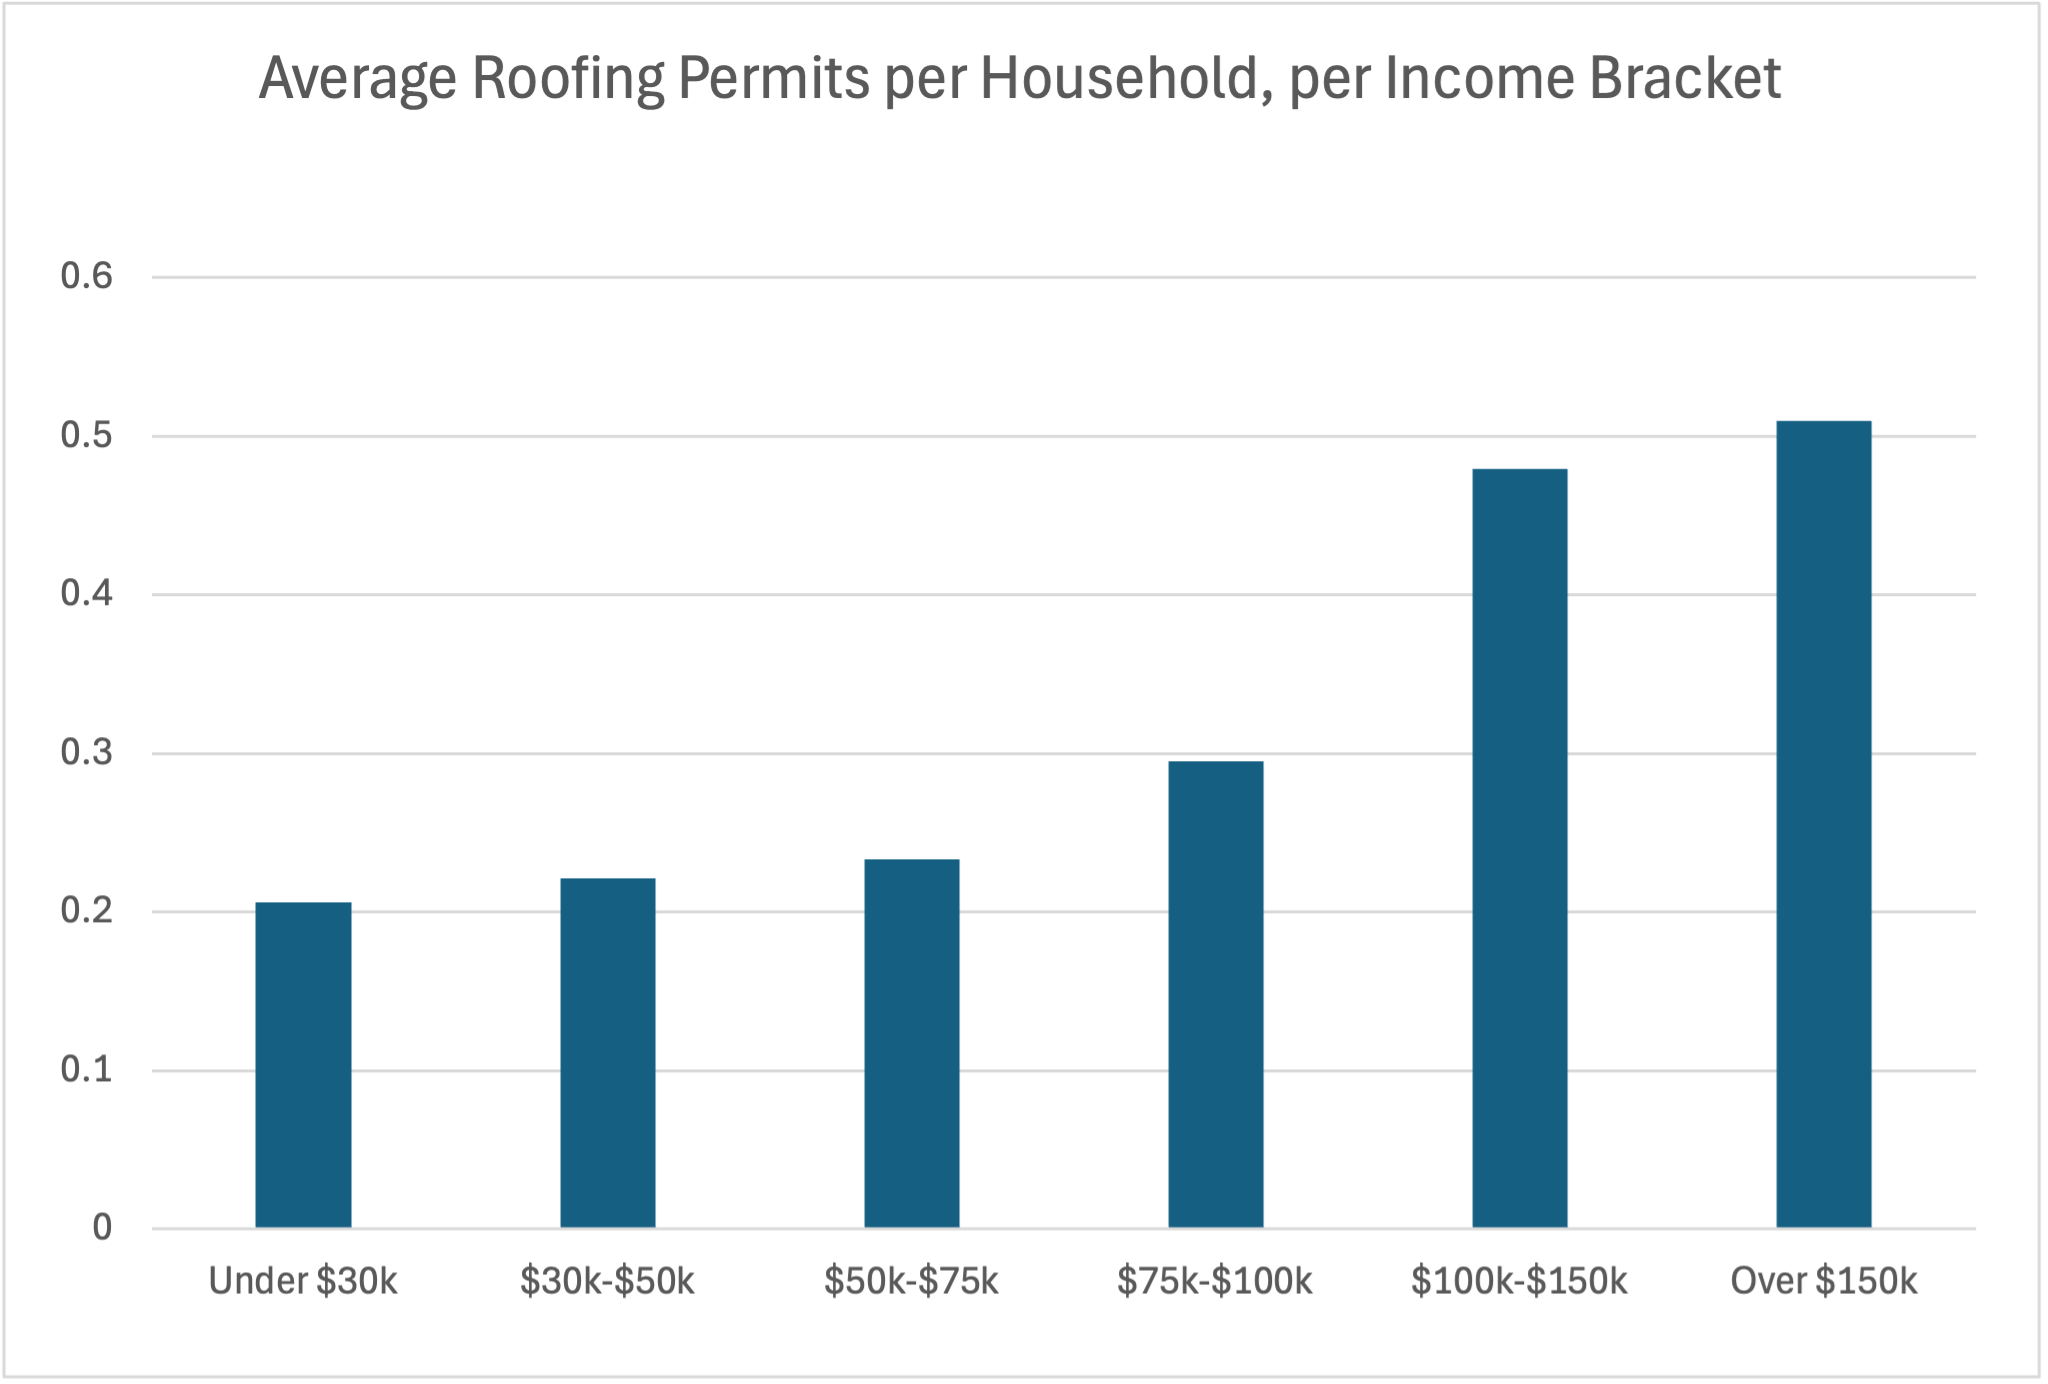
Specifically:
- Low Income (<$30k/year): 0.21 RPD, or Roofing Permit Density
- Low-Middle Income ($50k-$75k/year): 0.23 RPD
- Middle Income ($75k-$100k/year): 0.29 RPD
- Upper-Middle Income ($100k-$150k/year): 0.48 RPD
- High Income (>$150k/year): 0.51 RPD
74% of Roofing Permits Come from the Richest 28% of Areas
This data is not a surprise, but shows a stark difference in the proportion of roof permits pulled versus the number of households.
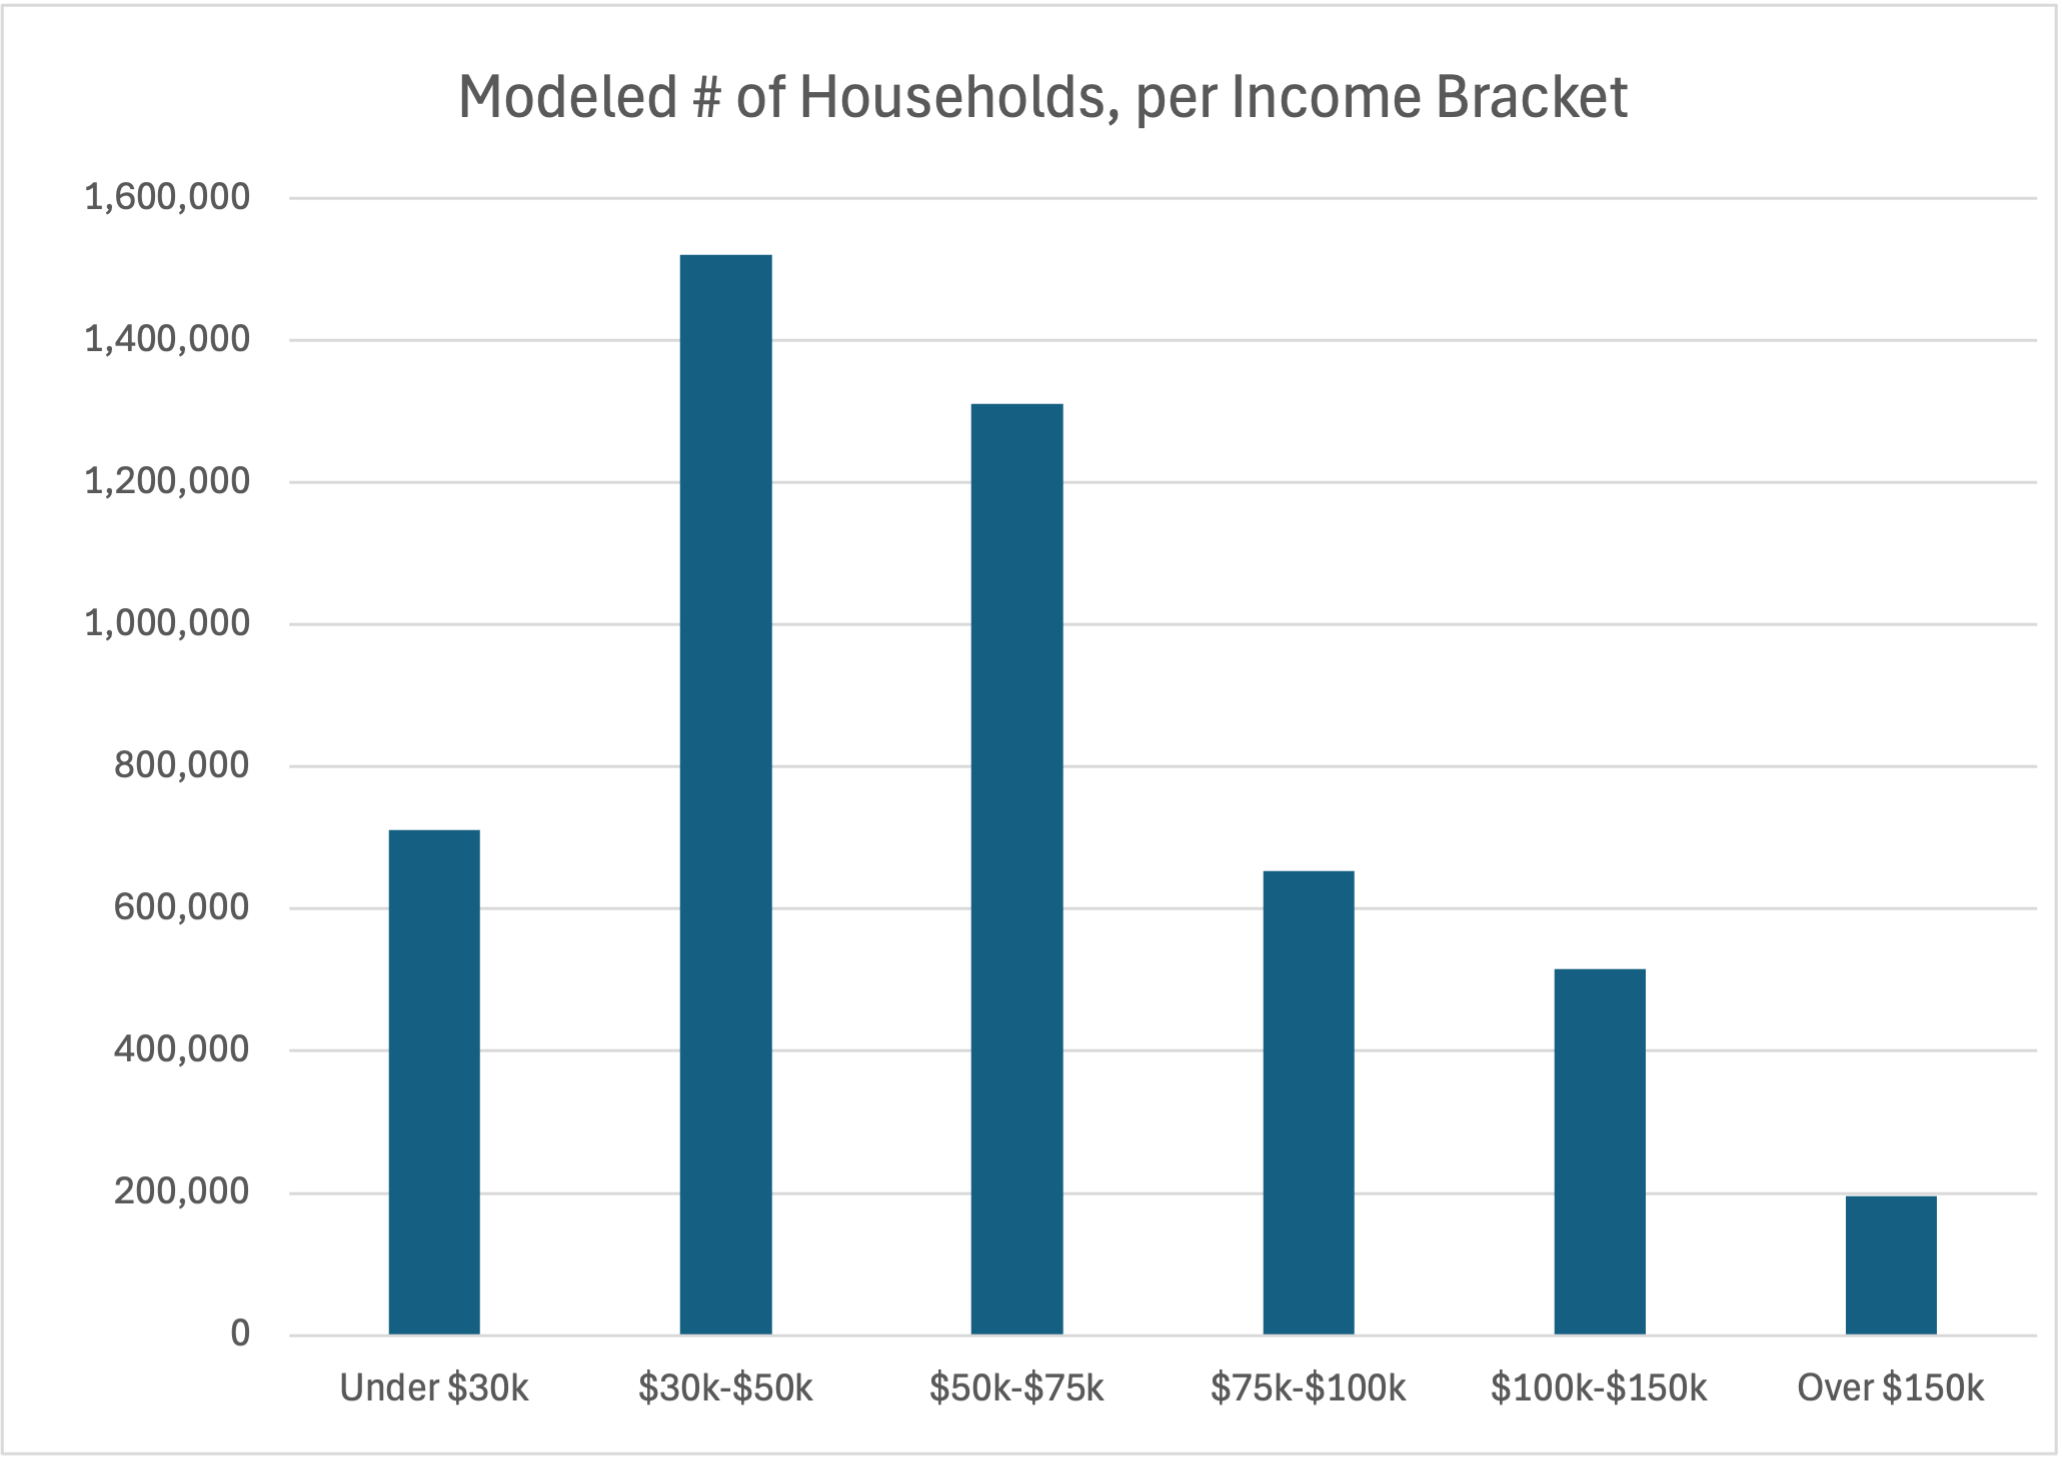
Here are some additional stats we found:
- 72% of areas in Texas fall beneath the Upper-Middle bracket, as described above. That’s roughly 3.5 million households.
- A massive 58% of areas in Texas make up the Low-Middle bracket.
- Only 4% of areas make up the High Income bracket.
- Higher Income areas (Upper-Middle and High brackets) show the widest variation in permit activity, beyond just roofing.
Understanding the Wealth-Permit Correlation
Our findings align with broader research and understandings behind homeowner improvement behaviors, and why large-scale projects like roofs are more frequently done by higher income areas.
Several key factors contribute to this trend:
- Access to financial resources:
- Roofing projects represent a smaller proportion of wealthier homeowner’s budget, both generally and for home improvement projects.
- Better access to project financing, such as mortgage refinancing, home equity loans, or personal loans with favorable terms.
- Better access to navigate loans and government-backed programs.
- Property characteristics and maintenance approaches
- Wealthier areas often feature older homes requiring more regular or controlled maintenance.
- Wealthier homeowners frequently leverage their greater resources to:
- Get regular roof inspections.
- Address minor issues promptly.
- Invest in higher-quality and longer-lasting roofing materials.
- Take preventative measures before major problems develop.
- Houses-As-Investment
- Wealthier homeowners view home improvements as strategic investments.
- Wealthier homeowners have better options for temporary housing while major work is done on a given property.
All this boils down to what we all intrinsically know: it’s expensive to be poor, and paying more upfront (in outsourcing labor, better quality materials, and frequent maintenance) is cheaper in the long run. And it’s easier for the wealthy to pay upfront.
Implications
The integral nature of roofs to both home quality and value, contrasted with the permitting statistics across areas of different socio-economic backgrounds, paints a stark picture. It’s easier for wealthier areas to do roof work, and so they do. Upper-Middle and High Income areas (by median income) make up the majority of statewide permitting, even though they’re the minority of households.
Data on its own is nice, but ultimately the value comes from leveraging this data to improve things around us. Shovels is in the business of providing construction insights, after all.
Let’s dive into some segments that can work with this data to improve home value across the board.
Policy Makers
Housing equality is a long-standing issue nationwide, but it’s especially present in Texas. If over a third of homeowners can barely afford their home, how are they expected to front the expenses for a large project like a new roof?
Policy makers should investigate longitudinal affordability programs to not only ensure that lower income households can afford housing, but that they can also get the assistance to maintain their home throughout it’s life.
Additionally, they should also create cross-industry partnerships to include banks and lending institutions with non-profits and related businesses to help homeowners take care of their roofs, and by extension their homes and investment.
It’s cheaper (and greener!) to maintain an existing home than to build and buy a new one, so let’s make that dream a reality for everyone, not just the wealthiest areas. And when the funds are available, the contractors will be happy for the work.
Contractors
Ever since the invention of the gang-nail plate (sometimes called a truss connector these days) revolutionized the American construction world back in the 50s, home contractors have switched from building what the homeowners wanted to building what they could, and then selling them the dream of bigger and bigger houses.
Or, as some might put it, Americans gained an appetite for larger and more complex homes, and their incomes didn’t match their dreams. In any case, houses are more expensive and bigger than ever. Combined with rising inflation and stagnating salaries, this is a disaster for the lower and middle classes, and has been for some time.
Roofs are just one part of the puzzle. Understanding this roofing problem, and the fact that such a large portion of the available market for roofing projects is in the Lower-Middle income bracket or lower, may unlock substantially more opportunities. Sure there are massive projects funded by the ultra-wealthy that can yield a big paycheck, but sustained work is better for everyone.
Homeowners
Ultimately, homeowners are the ones that benefit the most from increasing the value of their house. In this case, through ensuring that their roof is in excellent condition.
With better information and resources, every homeowner can understand how to best take care of their roof, whether that’s from regular inspections and maintenance plans, or seeking out financing options to measurably improve their home’s value.
And ultimately, roof permitting measured against census tracts and income levels is a great litmus test for how well homeowners are faring, both within their communities and nationwide.
Conclusion
The relationship between household income and roof permit activity is one facet of a broader reflection on how socioeconomic patterns influence home ownership and property investment.
In our findings for more than 3,200 census tracts within Texas, wealthier areas showed dramatically disproportionate roof permitting activity compared to less wealthy areas. Beyond the continued alignment with such broader studies, this specifically demonstrates an unbalanced market where Low to Middle Income areas need more assistance with their roofs.
To address these disparities and inequalities, a nuanced approach is necessary. This is what we might do:
- Implement policy measures to support necessary roofing repairs in lower-income areas.
- Develop and educate contractors regarding government-backed programs to help such lower-income areas.
- Provide more accessible financing options.
- Collaborate with businesses, non-profits, and communities to improve access to home improvement resources.
- Drive community education and awareness towards the benefits of maintaining their roofs.
The more roofing permits we see, the better the home quality and value is, which is a good thing for everyone from policy makers to contractors to homeowners.
What Next?
This narrow study provided some very interesting results, but we can think of additional research we’d like to do. Some key ideas for future analyses are:
- Deeper dive into how this data affects different industries, like insurance, banking, and real estate.
- Repeat these analyses for additional states.
- Measure real, assessed, or modeled home values against permit activity.
- Measure contractor-submitted permits versus those done by the homeowner.
- Delineate owner-occupied versus tenant-occupied homes.
- Track historical permit data to determine roof lifespans and associated permitted maintenance or re-roofing work.
- Expand our scope beyond roofing to other key signals of home improvement value, like remodels, extensions, or exterior work.
If there’s anything specific that you’d like to see us cover next, please let us know! On the other hand, check out our Free Trial and either use Shovels Online or the Shovels API to pull some of this data for yourself. We certainly don’t have time to do it all, and we love to collaborate.
Happy Digging!
Frequently Asked Questions
Q: What is the relationship between household income and roofing permit activity in Texas?
A: There is a clear positive correlation. Low-income areas (under $30k/year) average 0.21 roofing permits per household, while high-income areas (over $150k/year) average 0.51 permits per household. The wealthiest 28% of areas account for 74% of all roofing permits.
Q: Why do higher-income areas pull more roofing permits?
A: Several factors contribute: better access to financial resources and favorable loan terms, a tendency toward regular roof inspections and preventative maintenance, use of higher-quality materials, and viewing home improvements as strategic investments. Essentially, wealthier homeowners can afford to pay more upfront, which is cheaper in the long run.
Q: What does this data mean for lower-income homeowners?
A: The data highlights a significant disparity. Over 72% of Texas census tracts fall below the upper-middle income bracket, and these areas are underrepresented in roofing permits relative to their household count. This suggests lower-income homeowners may lack the resources for critical roof maintenance, which affects home value, structural integrity, and energy efficiency.
Q: How many census tracts were analyzed in this study?
A: The study examined more than 3,200 census tracts across Texas, combining roofing permit data with owner demographics and income bracket information.
Q: What policy recommendations emerge from this analysis?
A: The analysis recommends implementing policy measures to support roofing repairs in lower-income areas, developing contractor education about government-backed programs, providing more accessible financing options, and creating cross-industry partnerships among banks, non-profits, and businesses to help homeowners maintain their homes.